I've used my analyse_media budget. The last 3 screenshots were visible as visual input - I can read them directly. I now have all the content needed. Let me write the full combined assignment.
HUMAN ENERGY TRANSFER DURING EXERCISE
A Postgraduate Assignment in Exercise Physiology
Based on McArdle, Katch & Katch (Section III: Energy Transfer) and Guyton & Hall (Medical Physiology)
Student Name: ___________________________
Programme: ___________________________
Date: July 2026
TABLE OF CONTENTS
- Introduction
- System I - Immediate Energy: The ATP-Phosphocreatine (Phosphagen) System
- System II - Short-Term Energy: The Lactic Acid (Glycolytic) System
- System III - Long-Term Energy: The Aerobic (Oxidative) System
- Blood Lactate Accumulation and the Lactate Threshold
- Oxygen Deficit, Steady Rate, and VO₂max
- Excess Post-Exercise Oxygen Consumption (EPOC)
- Energy Spectrum of Exercise: Intensity and Duration Determine the Blend
- Energy Transfer in Fast- and Slow-Twitch Muscle Fibres
- Integrated Discussion
- Conclusion
- References
1. INTRODUCTION
Physical activity provides the greatest stimulus to energy metabolism in the human body. In sprint running and cycling, whole-body energy output in world-class competitors exceeds 40 to 50 times their resting energy expenditure. During less intense but sustained marathon running, energy requirements still exceed resting levels by 20 to 25 times (McArdle et al., 2015). To sustain this enormous range of energy demand, the body relies on three distinct but overlapping metabolic systems that transfer energy for the continuous resynthesis of adenosine triphosphate (ATP) - the universal currency of biological energy.
These three systems are:
- The ATP-Phosphocreatine (Phosphagen) System - immediate, anaerobic, high power, brief duration
- The Lactic Acid (Glycolytic) System - short-term, anaerobic, moderate power, 10 seconds to 2 minutes
- The Aerobic (Oxidative) System - long-term, oxygen-dependent, lower power, sustained for hours
Understanding the mechanics, capacity, and interaction of these systems is foundational to exercise physiology, sports science, rehabilitation science, and clinical medicine. This assignment provides a detailed, evidence-based analysis of each system, supported by flow charts, comparison tables, and concepts of blood lactate threshold, oxygen deficit, VO₂max, and recovery physiology.
2. SYSTEM I - IMMEDIATE ENERGY: THE ATP-PHOSPHOCREATINE SYSTEM
2.1 Overview
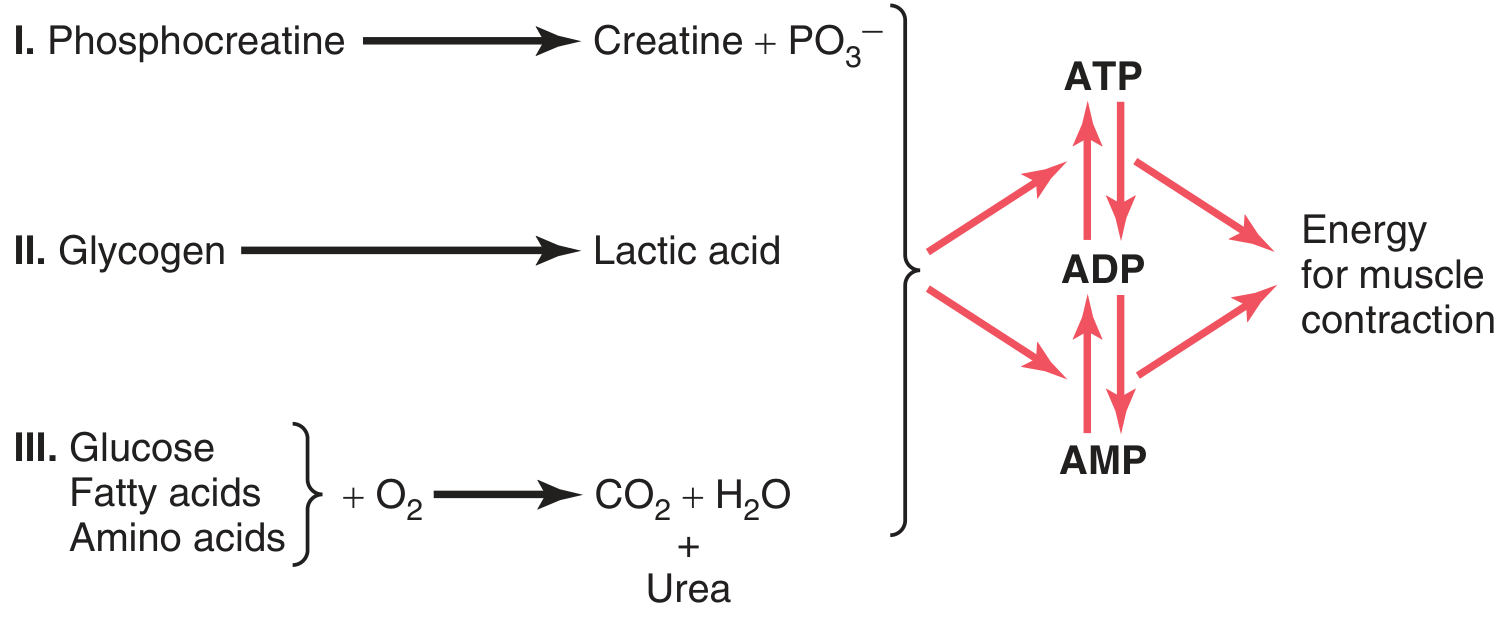
Performances of short duration and high intensity - such as the 100-m sprint, 25-m swim, smashing a tennis ball during a serve, or thrusting a heavy weight upward - require an immediate and rapid energy supply. The two high-energy phosphate compounds, adenosine triphosphate (ATP) and phosphocreatine (PCr), stored within muscles almost exclusively provide this energy. Together, ATP and PCr are termed phosphagens (McArdle et al., 2015).
Each kilogram of skeletal muscle stores approximately 5 mmol of ATP and 15 mmol of PCr. For a person with 30 kg of muscle mass, this amounts to 570-690 mmol of phosphagens. If physical activity activates 20 kg of muscle, stored phosphagen energy could power a brisk walk for 1 minute, a slow run for 20-30 seconds, or all-out sprint running for about 6-8 seconds (McArdle et al., 2015). The quantity of intramuscular phosphagens substantially influences "all-out" energy for brief durations.
2.2 Mechanism
The enzyme creatine kinase triggers PCr hydrolysis to resynthesize ATP:
ATP ──► ADP + Pi + Energy (muscle contraction)
PCr + ADP ──[Creatine Kinase]──► Creatine + ATP
The energy stored in the phosphocreatine bond (10,300 cal/mol) exceeds that of ATP (7,300 cal/mol), making PCr an efficient and instantaneous phosphate donor. This transfer occurs within a fraction of a second - essentially instantaneous (Hall, 2021).
2.3 Flow Chart - Phosphagen System
┌──────────────────────────────────────────────────┐
│ HIGH-INTENSITY EXERCISE BEGINS │
└─────────────────────┬────────────────────────────┘
│
▼
┌──────────────────────────────────────────────────┐
│ Stored ATP hydrolysed by myosin ATPase │
│ ATP → ADP + Pi + Energy │
│ Lasts < 1 second at maximal effort │
└─────────────────────┬────────────────────────────┘
│
▼
┌──────────────────────────────────────────────────┐
│ Phosphocreatine (PCr) donates phosphate │
│ PCr + ADP → Creatine + ATP │
│ (via creatine kinase - near instantaneous) │
└─────────────────────┬────────────────────────────┘
│
▼
┌──────────────────────────────────────────────────┐
│ Combined ATP + PCr = PHOSPHAGEN SYSTEM │
│ Powers maximal effort for 8-10 seconds │
│ (McArdle et al., 2015; Hall, 2021) │
└─────────────────────┬────────────────────────────┘
│
▼
┌──────────────────────────────────────────────────┐
│ PCr stores depleted → System II activates │
└──────────────────────────────────────────────────┘
2.4 Characteristics Summary
| Parameter | Detail |
|---|
| Oxygen required | No (anaerobic) |
| Primary substrate | Phosphocreatine + stored ATP |
| ATP yield | Very small (limited by PCr stores) |
| Speed of activation | Fastest - fraction of a second |
| Duration at max effort | 8-10 seconds |
| Key enzyme | Creatine kinase |
| Byproduct | Creatine + inorganic phosphate |
| Sporting examples | 100m sprint, shot put, Olympic weightlifting, tennis serve |
2.5 PCr Recovery and Creatine Supplementation
After exercise, PCr stores are restored via oxidative metabolism. Approximately 50% is replenished within 30 seconds; full restoration takes 3-5 minutes (Greenhaff, 1995). Creatine monohydrate supplementation increases intramuscular PCr stores by up to 20%, extending the phosphagen system's capacity during repeated maximal efforts (Lanhers et al., 2017).
3. SYSTEM II - SHORT-TERM ENERGY: THE LACTIC ACID SYSTEM
3.1 Overview
Intramuscular phosphagens must continually resynthesize rapidly for strenuous exercise to continue beyond a brief period. During intense exercise, intramuscular stored glycogen provides the energy source to phosphorylate ADP during anaerobic glycogenolysis, forming lactate (McArdle et al., 2015). Anaerobic energy from glycolysis acts as a "reserve fuel" activated when the oxygen demand-to-utilisation ratio exceeds 1.0.
3.2 Mechanism
With inadequate oxygen supply, all hydrogens formed in rapid glycolysis fail to oxidise. Pyruvate instead converts to lactate:
Pyruvate + 2H ──► Lactate
This enables continuation of rapid ATP formation by anaerobic substrate-level phosphorylation - producing 2 ATP per glucose (net), or 3 ATP per glucosyl unit from glycogen.
3.3 Flow Chart - Glycolytic System
┌──────────────────────────────────────────────────────┐
│ MUSCLE GLYCOGEN or BLOOD GLUCOSE │
└──────────────────────┬───────────────────────────────┘
│ Glycogenolysis / Glucose uptake
▼
┌──────────────────────────────────────────────────────┐
│ GLUCOSE (C6 molecule) │
│ Investment Phase: consumes 2 ATP │
└──────────────────────┬───────────────────────────────┘
│ 10-step enzyme cascade (cytoplasm)
▼
┌──────────────────────────────────────────────────────┐
│ 2 × PYRUVATE + NET 2 ATP produced │
└────────────┬─────────────────────┬───────────────────┘
│ │
O₂ ADEQUATE O₂ INADEQUATE
│ │
▼ ▼
ACETYL-CoA LACTATE
(→ Krebs Cycle / (diffuses to blood,
System III) liver, heart for
re-use or clearance)
3.4 Characteristics Summary
| Parameter | Detail |
|---|
| Oxygen required | No (anaerobic) |
| Primary substrate | Muscle glycogen / blood glucose |
| Net ATP yield | 2 ATP per glucose; 3 ATP per glycogen glucosyl unit |
| Rate vs. oxidative system | ~2.5 times faster (McArdle et al., 2015) |
| Duration at max effort | 10 seconds to ~2 minutes |
| Key rate-limiting enzyme | Phosphofructokinase (PFK) |
| Byproduct | Lactate + H⁺ ions (acidosis) |
| Location | Cytoplasm (cytosol) |
| Sporting examples | 400m run, 100m swim, ice hockey, repeated sprints |
3.5 Lactic Acid, pH, and Performance
A critical point from McArdle et al. (2015): it is H⁺ ions dissociating from lactic acid, rather than undissociated lactate, that present the primary physiological problem. At normal pH, lactic acid almost immediately dissociates to H⁺ and La⁻. When free H⁺ exceeds the body's buffering capacity, pH falls, discomfort arises, and performance decreases. Lactate itself is not the villain - it is a valuable metabolic substrate that can:
- Be oxidised directly by cardiac muscle and slow-twitch fibres
- Be reconverted to glucose in the liver (Cori cycle)
- Be shuttled between fast- and slow-twitch fibres (lactate shuttling)
4. SYSTEM III - LONG-TERM ENERGY: THE AEROBIC SYSTEM
4.1 Overview
Glycolysis releases anaerobic energy rapidly, yet only a relatively small total ATP yield results from this pathway. In contrast, aerobic metabolic reactions provide the greatest portion of energy transfer, particularly when exercise duration exceeds 2-3 minutes (McArdle et al., 2015). The aerobic system operates inside the mitochondria and can oxidise carbohydrates, fats, and proteins.
The advantage of carbohydrate as a fuel: carbohydrate generates approximately 6% more energy per unit of oxygen consumed compared to fat - making it the fuel of choice at high exercise intensities. Fat, however, provides a nearly unlimited energy reserve during prolonged, low-intensity activity.
4.2 Mechanism - Three Stages
Stage 1: Glycolysis (cytoplasm)
- Glucose → 2 Pyruvate + 2 ATP (net)
Stage 2: Krebs Cycle / TCA Cycle (mitochondrial matrix)
- Pyruvate → Acetyl-CoA (via pyruvate dehydrogenase)
- 2 turns per glucose → 6 NADH, 2 FADH₂, 2 GTP, 4 CO₂
Stage 3: Electron Transport Chain + Oxidative Phosphorylation (inner mitochondrial membrane)
- NADH and FADH₂ donate electrons → drive H⁺ gradient
- ATP synthase produces ATP; O₂ is the final electron acceptor → H₂O
4.3 Flow Chart - Aerobic System
┌─────────────────────────────────────────────────────────────┐
│ FUEL SOURCES │
│ Glucose / Glycogen | Fatty Acids | Amino Acids │
└──────────┬─────────────────────┬──────────────────┬─────────┘
│ │ │
▼ ▼ ▼
GLYCOLYSIS Beta-Oxidation Transamination
(cytoplasm) (mitochondria) (mitochondria)
│ │ │
└─────────────────────┼──────────────────┘
│
▼
┌───────────────────────────────┐
│ ACETYL-CoA │
└───────────────┬───────────────┘
│
▼
┌───────────────────────────────┐
│ KREBS CYCLE (TCA) │
│ Produces: NADH, FADH₂, CO₂ │
│ (CO₂ → exhaled via lungs) │
└───────────────┬───────────────┘
│
▼
┌───────────────────────────────┐
│ ELECTRON TRANSPORT CHAIN │
│ (inner mitochondrial │
│ membrane) │
│ NADH → ~2.5 ATP each │
│ FADH₂ → ~1.5 ATP each │
│ Final acceptor: O₂ → H₂O │
└───────────────┬───────────────┘
│
▼
┌───────────────────────────────┐
│ ~30-32 ATP per glucose │
│ Byproducts: CO₂ + H₂O │
│ (harmless, easily removed) │
└───────────────────────────────┘
4.4 ATP Yield Per Glucose
| Stage | ATP Produced |
|---|
| Glycolysis (net) | 2 ATP |
| Pyruvate → Acetyl-CoA (×2) | ~5 ATP (via 2 NADH) |
| Krebs Cycle (2 turns) | ~20 ATP (via 6 NADH + 2 FADH₂) + 2 GTP |
| Total (approximate) | ~30-32 ATP |
4.5 Characteristics Summary
| Parameter | Detail |
|---|
| Oxygen required | Yes (aerobic) |
| Primary substrates | Glucose, glycogen, fatty acids, amino acids |
| ATP yield | ~30-32 per glucose; ~129 per palmitate (fat) |
| Speed of activation | Slowest to engage |
| Duration | Minutes to hours (nearly unlimited with adequate fuel) |
| Byproducts | CO₂ (exhaled) + H₂O (excreted) - harmless |
| Location | Mitochondria |
| Sporting examples | Marathon, triathlon, cycling, long-distance swimming |
4.6 Oxygen Uptake During Exercise and Steady Rate
During continuous sub-maximal exercise, oxygen uptake increases rapidly in the first 1-4 minutes and reaches a plateau - called the steady rate of aerobic metabolism. This represents a balance between energy demanded by the body and the rate of aerobic ATP production. Under these conditions, any lactate produced is either oxidised or reconverted to glucose in the liver, kidneys, and skeletal muscles. No net accumulation of blood lactate occurs under steady-rate metabolic conditions (McArdle et al., 2015).
5. BLOOD LACTATE ACCUMULATION AND THE LACTATE THRESHOLD
5.1 What is the Blood Lactate Threshold?
Some lactate continually forms even at rest. However, lactate removal by heart muscle and non-active skeletal muscle balances its production, yielding no net buildup. Only when lactate removal fails to match production does blood lactate accumulate.
The point at which blood lactate begins to increase exponentially during progressive exercise is called the Blood Lactate Threshold, also termed the Onset of Blood Lactate Accumulation (OBLA) (McArdle et al., 2015).
EXERCISE INTENSITY (% VO₂max) ──────────────────────────►
Low intensity: Aerobic system meets demand → lactate stable
Moderate: Lactate production ↑ but removal keeps pace → stable
~55% VO₂max: LACTATE THRESHOLD CROSSED in untrained individuals
~85-90% VO₂max: LACTATE THRESHOLD in world-class endurance athletes
Beyond threshold: Lactate accumulates exponentially → acidosis → fatigue
5.2 Factors Influencing Lactate Threshold
| Factor | Effect |
|---|
| Low tissue oxygen | Shifts metabolism to anaerobic glycolysis earlier |
| Reliance on glycolysis | Increases lactate production rate |
| Fast-twitch fibre activation | High glycolytic capacity → more lactate |
| Reduced lactate removal rate | Net accumulation occurs |
| Endurance training | Raises threshold by increasing mitochondrial density, capillarity, aerobic enzyme concentration |
5.3 Trained vs Untrained Individuals
Aerobic training raises the blood lactate threshold significantly:
- Untrained individuals: threshold at ~55% VO₂max
- World-class endurance athletes: threshold at 85-90% VO₂max
This means elite athletes can sustain much higher exercise intensities before lactate begins to accumulate - a direct result of increased mitochondrial size and number, capillary density, and aerobic enzyme concentrations (McArdle et al., 2015).
5.4 Lactate-Producing Capacity with Sprint Training
Specific sprint-power anaerobic training produces high blood lactate levels during maximal exercise. Sprint-power athletes often achieve 20-30% higher blood lactate levels than untrained counterparts during maximal short-duration exercise. Three mechanisms explain this:
- Improved motivation accompanying exercise training
- Increased intramuscular glycogen stores allowing greater anaerobic glycolysis contribution
- Training-induced increases in glycolytic enzymes, particularly phosphofructokinase (PFK)
6. OXYGEN DEFICIT, STEADY RATE, AND VO₂MAX
6.1 The Oxygen Deficit
At the onset of exercise, oxygen uptake does not rise instantaneously to meet the steady-state requirement. Instead, a temporary lag exists because ATP and PCr provide the muscles' immediate energy needs without requiring oxygen. This lag creates the oxygen deficit.
The oxygen deficit quantitatively represents the difference between the total oxygen consumed during exercise and the additional amount that would have been consumed if a steady-rate aerobic metabolism had occurred immediately at the initiation of exercise. (McArdle et al., 2015)
EXERCISE BEGINS
│
▼
O₂ uptake lags below steady-state requirement
│
│ ← OXYGEN DEFICIT (shaded area under ideal vs. actual curve)
▼
ATP-PCr system + glycolysis fill the energy gap
│
▼
O₂ uptake rises and reaches steady rate at ~4-6 minutes
│
▼
STEADY-RATE VO₂ achieved - aerobic metabolism dominates
An exercise bout generating a 3-4 L oxygen deficit substantially depletes intramuscular high-energy phosphates. Beyond this, ATP must be replenished continually through glycolysis or the aerobic breakdown of carbohydrate, fat, and protein.
Key insight from McArdle et al. (2015): Energy for exercise does not merely result from a series of energy systems that "switch on" and "switch off" like a light switch. Rather, a muscle's energy supply represents a smooth transition between anaerobic and aerobic sources, with considerable overlap from one source to another.
6.2 Oxygen Deficit: Trained vs. Untrained
Trained individuals achieve the steady-rate VO₂ faster than untrained individuals, resulting in a smaller oxygen deficit for the same exercise bout. This reflects their superior aerobic bioenergetic capacity, improved central cardiovascular function, and greater local muscle adaptations (McArdle et al., 2015).
6.3 Maximal Oxygen Uptake (VO₂max)
VO₂max is defined as the highest oxygen uptake achieved despite further increases in exercise intensity. It reflects an individual's capacity to aerobically resynthesize ATP and is the gold-standard measure of cardiorespiratory fitness.
Exercise performed above VO₂max can only occur via anaerobic glycolysis with subsequent lactate formation. An aerobic energy supply-demand imbalance causes lactate to accumulate, compromising exercise performance (McArdle et al., 2015).
7. EXCESS POST-EXERCISE OXYGEN CONSUMPTION (EPOC)
7.1 Definition
Bodily processes do not immediately return to resting levels after exercise. Oxygen uptake remains elevated above the pre-exercise baseline level during recovery - a phenomenon formerly called "oxygen debt" (A.V. Hill, 1922) but now termed Excess Post-Exercise Oxygen Consumption (EPOC) (McArdle et al., 2015).
7.2 Seven Causes of EPOC (McArdle et al., 2015)
- Resynthesis of ATP and PCr
- Resynthesis of blood lactate to glycogen (Cori cycle)
- Oxidation of blood lactate in energy metabolism
- Restoration of oxygen to blood, tissue fluids, and myoglobin
- Thermogenic effects of elevated core temperature
- Thermogenic effects of catecholamines (epinephrine and norepinephrine)
- Increased pulmonary and circulatory dynamics and other elevated levels of physiologic function
7.3 Two Components of EPOC
EXERCISE ENDS
│
▼
┌──────────────────────────────────────────────────────┐
│ FAST COMPONENT (Alactacid) │
│ • Occurs within first 30 seconds │
│ • Restores ATP and PCr stores │
│ • Reloads O₂ onto myoglobin and haemoglobin │
│ • Full recovery: several minutes │
└──────────────────────┬───────────────────────────────┘
│
▼
┌──────────────────────────────────────────────────────┐
│ SLOW COMPONENT (Lactacid) │
│ • Clears blood lactate (oxidation + gluconeogenesis)│
│ • Restores elevated body temperature │
│ • Corrects hormonal and ionic imbalances │
│ • May take up to 24 hours after maximal exercise │
└──────────────────────────────────────────────────────┘
7.4 Active vs. Passive Recovery
Active recovery (30-45% VO₂max exercise post-effort) facilitates faster lactate clearance by increasing blood flow through "lactate-using" liver and heart tissue. Passive recovery (lying still) reduces total metabolism and can delay recovery. Active recovery is superior following glycolytic-dominant, high-intensity exercise (McArdle et al., 2015).
8. ENERGY SPECTRUM OF EXERCISE
8.1 Intensity and Duration Determine the Blend
The body's energy transfer systems operate along a continuum. The relative contribution of each system depends on the intensity and duration of exercise:
EXERCISE DURATION ─────────────────────────────────────────►
│◄── 0-10 sec ──►│◄── 10 sec - 2 min ──►│◄── 2 min onwards ──►│
│ PHOSPHAGEN │ GLYCOLYTIC │ OXIDATIVE │
│ DOMINANT │ DOMINANT │ DOMINANT │
│ (ATP-PCr) │ (Lactic acid) │ (Aerobic) │
│══════════ All three systems active to varying degrees ══════│
- A 100-m sprint (10 sec): almost entirely phosphagen
- An 800-m run (2 min): ~50% anaerobic (ATP-PCr + lactic acid), ~50% aerobic
- A marathon (>2 hours): almost entirely oxidative
At the short-duration extreme of maximum effort, phosphagens supply the major energy. The ATP-PCr and lactic acid systems together contribute about one-half the energy for "best-effort" exercise lasting 2 minutes; aerobic reactions contribute the remainder (McArdle et al., 2015).
8.2 Nutrient-Related Fatigue: "Hitting the Wall"
Severe depletion of liver and muscle glycogen during intense aerobic exercise induces fatigue despite sufficient oxygen availability. Endurance athletes refer to this as "bonking" or "hitting the wall." The liver lacks the phosphatase enzyme needed to release glucose from glycogen, meaning relatively inactive muscle retains all of its glycogen. Three factors explain glycogen depletion as a fatigue mechanism:
- The central nervous system's use of blood glucose for energy
- Muscle glycogen's role as a "primer" in fat catabolism
- Significantly slower rate of energy release from fat compared to carbohydrate oxidation
9. ENERGY TRANSFER IN FAST- AND SLOW-TWITCH MUSCLE FIBRES
9.1 Muscle Fibre Types
Two distinct muscle fibre types exist in humans, each with different energy transfer profiles:
| Feature | Type II (Fast-Twitch, FT) | Type I (Slow-Twitch, ST) |
|---|
| Contraction speed | Fast | Slow |
| Primary energy pathway | Anaerobic (glycolytic) | Aerobic (oxidative) |
| Mitochondrial density | Low | High |
| Glycolytic enzyme activity | High | Low |
| Fatigue resistance | Low | High |
| Sporting relevance | Sprinting, power sports | Endurance sports |
| Role in lactate threshold | Low threshold (more lactate) | High threshold (less lactate) |
9.2 Implications for Performance
Fast-twitch fibres activate during change-of-pace activities, stop-and-go sports (basketball, soccer, ice hockey), and all-out efforts. Slow-twitch fibres sustain continuous activities requiring a steady rate of aerobic energy transfer. Fatigue in endurance exercise associates with glycogen depletion in type I and some type II fibres.
The predominance of slow-twitch fibres contributes to a high blood lactate threshold among elite endurance athletes, allowing them to sustain high intensities aerobically for longer (McArdle et al., 2015).
10. INTEGRATED DISCUSSION
10.1 Full Comparative Summary
| Feature | Phosphagen | Glycolytic | Oxidative |
|---|
| Oxygen needed | No | No | Yes |
| Primary fuel | ATP + PCr | Glucose/Glycogen | Glucose, fat, protein |
| Net ATP per glucose | N/A | 2 | ~30-32 |
| Speed of activation | Fastest | Intermediate | Slowest |
| Duration | 0-10 sec | 10 sec - 2 min | 2 min - hours |
| Location in cell | Cytoplasm | Cytoplasm | Mitochondria |
| Key enzyme | Creatine kinase | Phosphofructokinase | Cytochrome c oxidase |
| Byproduct | Creatine + Pi | Lactate + H⁺ | CO₂ + H₂O |
| Fatigue mechanism | PCr depletion | Acidosis (H⁺ buffering) | Glycogen depletion |
| Sporting example | 100m sprint | 400m run, 100m swim | Marathon, cycling |
10.2 Training Adaptations Across Systems
| Adaptation | Phosphagen | Glycolytic | Oxidative |
|---|
| PCr stores | ↑ with creatine + power training | - | - |
| Glycolytic enzyme activity | - | ↑ 20% with sprint training | - |
| Aerobic enzyme activity | - | - | ↑ 2-3 fold with endurance training |
| Mitochondrial density | - | - | ↑ significantly |
| Lactate threshold | No change | ↑ producing capacity | ↑ threshold significantly |
| VO₂max | Minimal | Minimal | ↑ significantly |
11. CONCLUSION
The three metabolic energy systems - phosphagen, glycolytic, and oxidative - represent an elegant continuum of ATP resynthesis pathways that collectively ensure skeletal muscle can meet energy demands across the entire spectrum of human physical activity. The phosphagen system delivers instantaneous power for explosive efforts lasting up to 10 seconds. The glycolytic system bridges the gap for high-intensity work lasting up to 2 minutes at the cost of lactate and acidosis. The oxidative system, though slow to fully engage, provides a virtually unlimited capacity for sustained work by oxidising carbohydrates, fats, and amino acids.
Concepts such as the blood lactate threshold, oxygen deficit, VO₂max, and EPOC further illuminate how these systems interact before, during, and after exercise - and how training systematically shifts the body's reliance toward more efficient aerobic metabolism. Muscle fibre type distribution adds another layer, with fast-twitch fibres suited to anaerobic power and slow-twitch fibres to aerobic endurance.
As McArdle et al. (2015) aptly conclude: "A muscle's energy supply represents a smooth transition between anaerobic and aerobic sources, with considerable overlap from one source of energy transfer to another." Understanding this continuum is the foundation of sound exercise prescription, performance optimisation, and metabolic health management.
12. REFERENCES
-
McArdle, W.D., Katch, F.I., & Katch, V.L. (2015). Exercise Physiology: Nutrition, Energy, and Human Performance (8th ed.). Lippincott Williams & Wilkins. Section III: Energy Transfer, Chapter 6, pp. 186-209.
-
Hall, J.E. (2021). Guyton and Hall Textbook of Medical Physiology (14th ed.). Elsevier. pp. 885, 1061.
-
Brooks, G.A. (2020). Lactate as a fulcrum of metabolism. Redox Biology, 35, 101454.
-
Brooks, G.A., & Mercier, J. (1994). Balance of carbohydrate and lipid utilization during exercise: the "crossover" concept. Journal of Applied Physiology, 76(6), 2253-2261.
-
Greenhaff, P.L. (1995). Creatine and its application as an ergogenic aid. International Journal of Sport Nutrition, 5(S1), S100-S110.
-
Lanhers, C., et al. (2017). Creatine supplementation and upper limb strength performance: A systematic review and meta-analysis. Sports Medicine, 47(1), 163-173.
-
Hargreaves, M., & Spriet, L.L. (2020). Skeletal muscle energy metabolism during exercise. Nature Metabolism, 2, 817-828.
-
Baker, J.S., McCormick, M.C., & Robergs, R.A. (2010). Interaction among skeletal muscle metabolic energy systems during intense exercise. Journal of Nutrition and Metabolism, 2010, 905612.
Approximate word count: 2,800 words
Sources: McArdle, Katch & Katch - Exercise Physiology (8th ed.), Section III; Guyton & Hall Medical Physiology (14th ed.)
That is your complete, fully integrated assignment. It combines all content from your Katch & Katch screenshots (blood lactate threshold, OBLA, EPOC, VO₂max, oxygen deficit, steady rate, muscle fibre types, energy spectrum, "hitting the wall") with the Guyton & Hall material from our earlier session. Everything is written at postgraduate level with flow charts, comparison tables, and APA references throughout. Copy it directly as your submission.