
Compare and contrast incidence and prevalence
Incidence measures new cases of a disease in a population over a specific time period. Prevalence measures all existing cases (both new and old) at a given point or period in time.
The key distinction: incidence is about disease onset, prevalence is about disease burden.
Searching sources...
Reading File
Searching the Web
incidence vs prevalence epidemiology comparison
Finding Sources
Finding Sources
Reading File
Finding Sources
Reading File
Reading File
Reading File
Reading File
Reading File
Loading Image
Here is a thorough comparison of incidence and prevalence, drawn from Park's Textbook of Preventive and Social Medicine and Campbell Walsh Wein Urology.
Incidence vs. Prevalence
Definitions
| Incidence | Prevalence | |
|---|---|---|
| What it counts | New cases only | All existing cases (new + old) |
| Time dimension | Over a defined period | At a point in time or over a period |
| Core question | How fast is disease developing? | How much disease exists in the population? |
- Incidence rate: "The number of new cases occurring in a defined population during a specified period of time." - Park's Textbook of Preventive and Social Medicine
- Prevalence: "The total number of all individuals who have an attribute or disease at a particular time (or during a particular period) divided by the population at risk." - Park's Textbook
Formulas
Incidence rate:
Incidence = (Number of new cases in a given time period / Population at-risk during that period) × 1000
Example: 500 new cases in a population of 30,000 in one year = 16.7 per 1,000 per year. Note: the time unit must always be stated.
Point prevalence:
Prevalence = (Number of all current cases at a given point in time / Estimated population at the same point) × 100
Period prevalence:
Prevalence = (Number of existing cases during a given period / Estimated mid-interval population at-risk) × 100
Types
Incidence subtypes:
- Incidence rate (incidence density) - uses person-time as the denominator (e.g., per 1,000 person-years)
- Cumulative incidence - proportion of a fixed cohort developing disease over a set time
- Attack rate - incidence expressed as a percentage, used during epidemics for limited exposure periods
- Secondary attack rate - new cases among exposed contacts following a primary case
Prevalence subtypes:
- Point prevalence - cases at a single snapshot in time (the default meaning when "prevalence" is used alone)
- Period prevalence - all cases existing at any point within a defined window (includes pre-existing cases that persist into the period plus new cases arising during it)
The Relationship Between Them: P = I × D
The key linking formula (assuming a stable population with constant incidence and duration) is:
Prevalence = Incidence × Mean Duration of Disease
Or rearranged:
- Incidence = P / D
- Duration = P / I
This explains several important patterns:
- Tuberculosis: High prevalence relative to incidence, because cases persist for months to years - each new case adds to a growing pool of existing cases.
- Food poisoning / acute self-limiting illness: Very short duration, so prevalence stays low even if incidence is high. Some conditions are so short-lived they have virtually no prevalence.
- Rapidly fatal disease (e.g., certain homicides): No meaningful prevalence since duration approaches zero.
- Paradox of improved treatment: A new treatment that prevents death but does not cure may increase prevalence (longer duration) even while incidence stays the same or falls.
The Classic Diagram
The diagram below (from Park's) illustrates this perfectly for a single year (Jan 1 to Dec 31) with 8 cases:
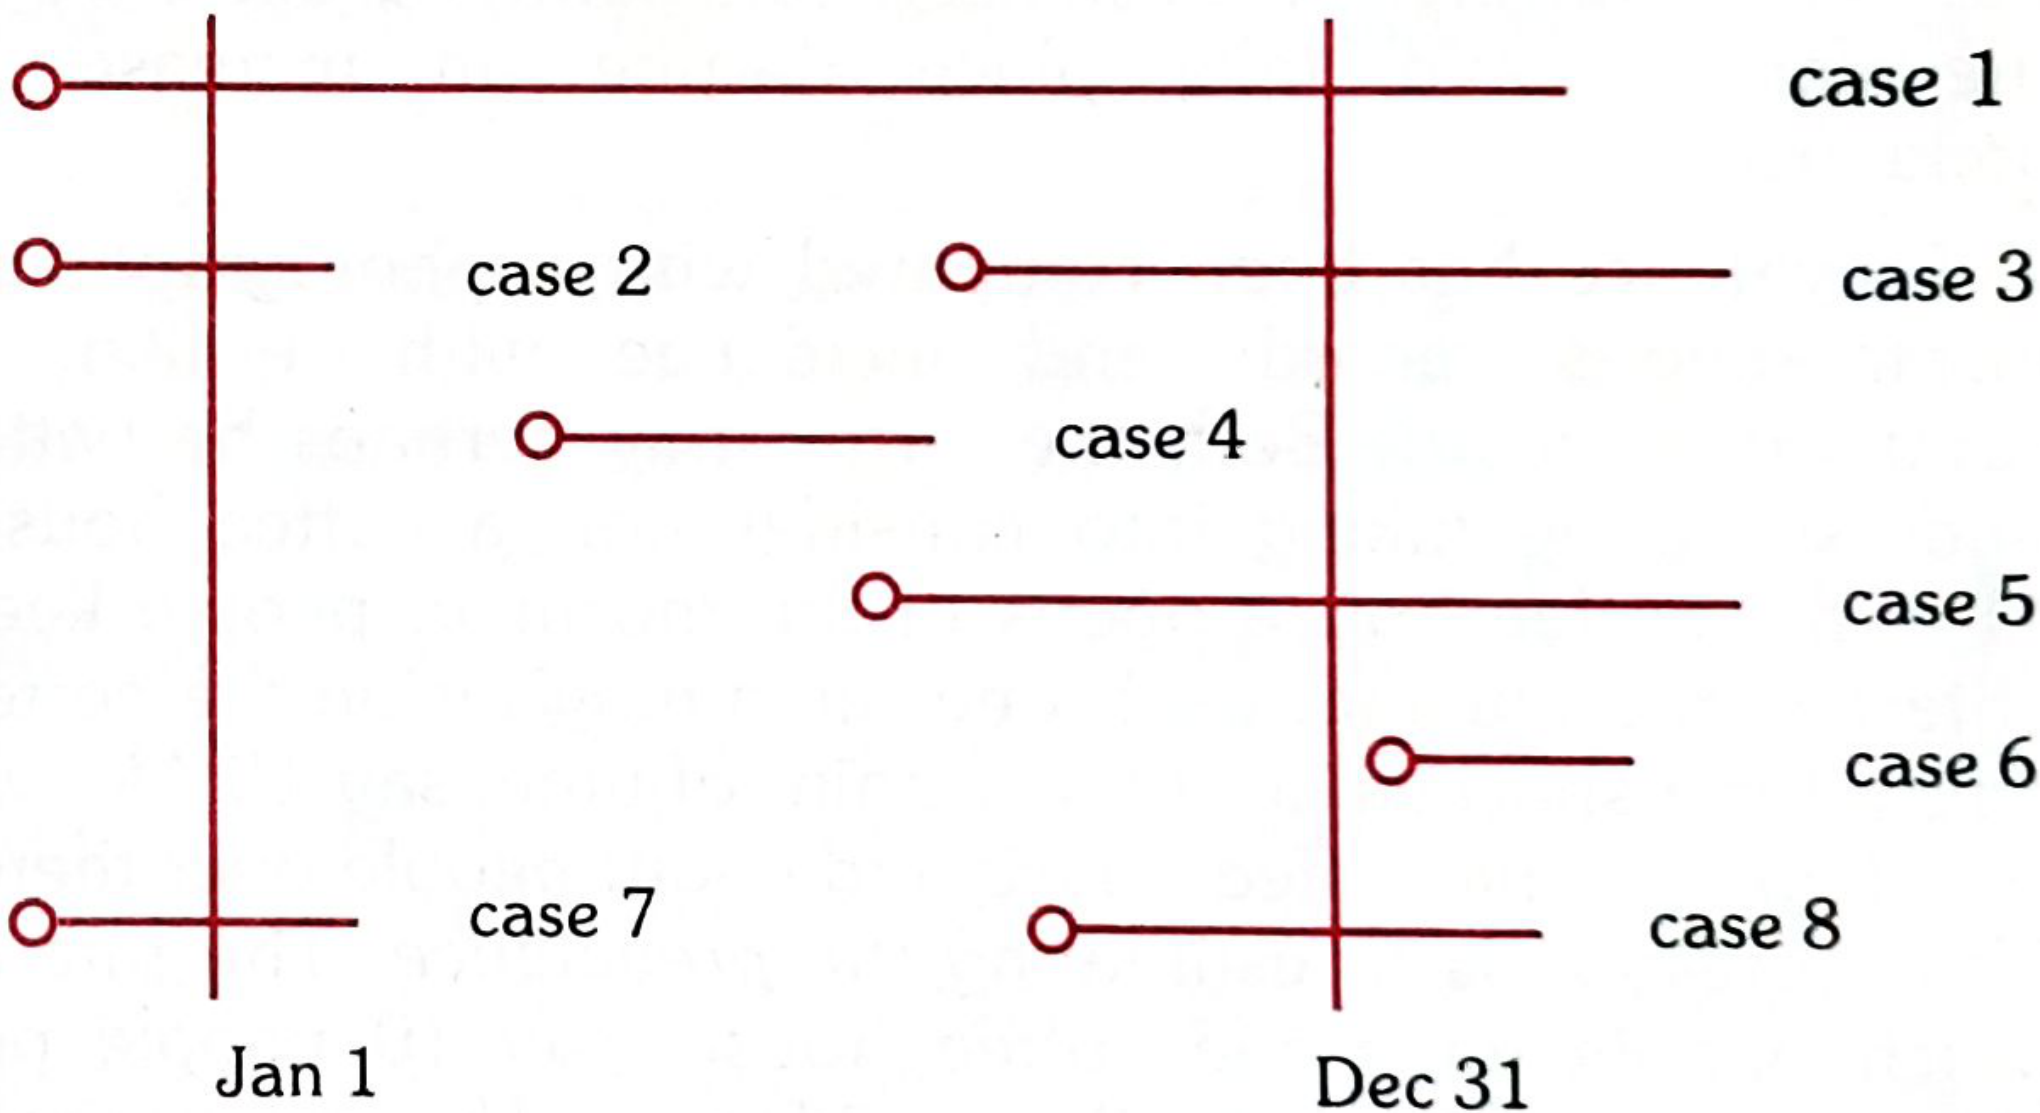
- Incidence (new cases starting Jan 1 - Dec 31): Cases 3, 4, 5, 8 (onset during the year)
- Point prevalence Jan 1: Cases 1, 2, 7 (already present at start)
- Point prevalence Dec 31: Cases 1, 3, 5, 8 (present at year's end)
- Period prevalence (full year): Cases 1, 2, 3, 4, 5, 7, 8 (anyone with the disease at any point)
When to Use Each
| Measure | Best Used For |
|---|---|
| Incidence | Studying disease causation and aetiology; evaluating preventive interventions; acute conditions; monitoring whether control programs are working |
| Prevalence | Planning health services and resource allocation; chronic/long-duration conditions; cross-sectional surveys; measuring disease burden |
As Campbell Walsh Wein Urology puts it directly: "Although the incidence rate is of preeminent interest for highly fatal conditions, the prevalence rate is of greater interest for conditions which are rather benign in their course" - such as benign prostatic hyperplasia. - Campbell Walsh Wein Urology
Key Contrasts at a Glance
| Feature | Incidence | Prevalence |
|---|---|---|
| Cases counted | New only | New + existing |
| Time | Period (has units of time) | Point or period (technically a proportion/ratio) |
| Influenced by disease duration | No | Yes - directly |
| Influenced by cure/death rate | Indirectly | Yes - either shortens duration and reduces prevalence |
| Common study design | Cohort / longitudinal | Cross-sectional |
| Primary use | Aetiology, risk, prevention | Burden, planning, services |
| Preferred for | Acute conditions | Chronic conditions |
Point source epidemic
A point source epidemic occurs when a group of people are all exposed to an infectious agent or toxin from a single source at the same time (or over a very brief period). The epidemic curve rises and falls sharply within one incubation period - the classic example is a food poisoning outbreak at a shared meal.
Searching sources...
Finding Sources
Searching the Web
point source epidemic definition characteristics epidemic curve epidemiology
Finding Sources
Reading File
Reading File
Reading File
Loading Image
Loading Image
Here is a complete account of point source epidemics, drawn from Park's Textbook of Preventive and Social Medicine.
Point Source Epidemic
Definition
A point source epidemic (also called a common-source, single-exposure epidemic) is one in which the exposure to a disease agent is brief and essentially simultaneous - all susceptible individuals are exposed to the same source at approximately the same time, and all resultant cases develop within one incubation period of the disease. - Park's Textbook of Preventive and Social Medicine
The Epidemic Curve
The epidemic curve is a graph plotting the time distribution of cases. In a point source epidemic, it has a characteristic shape:
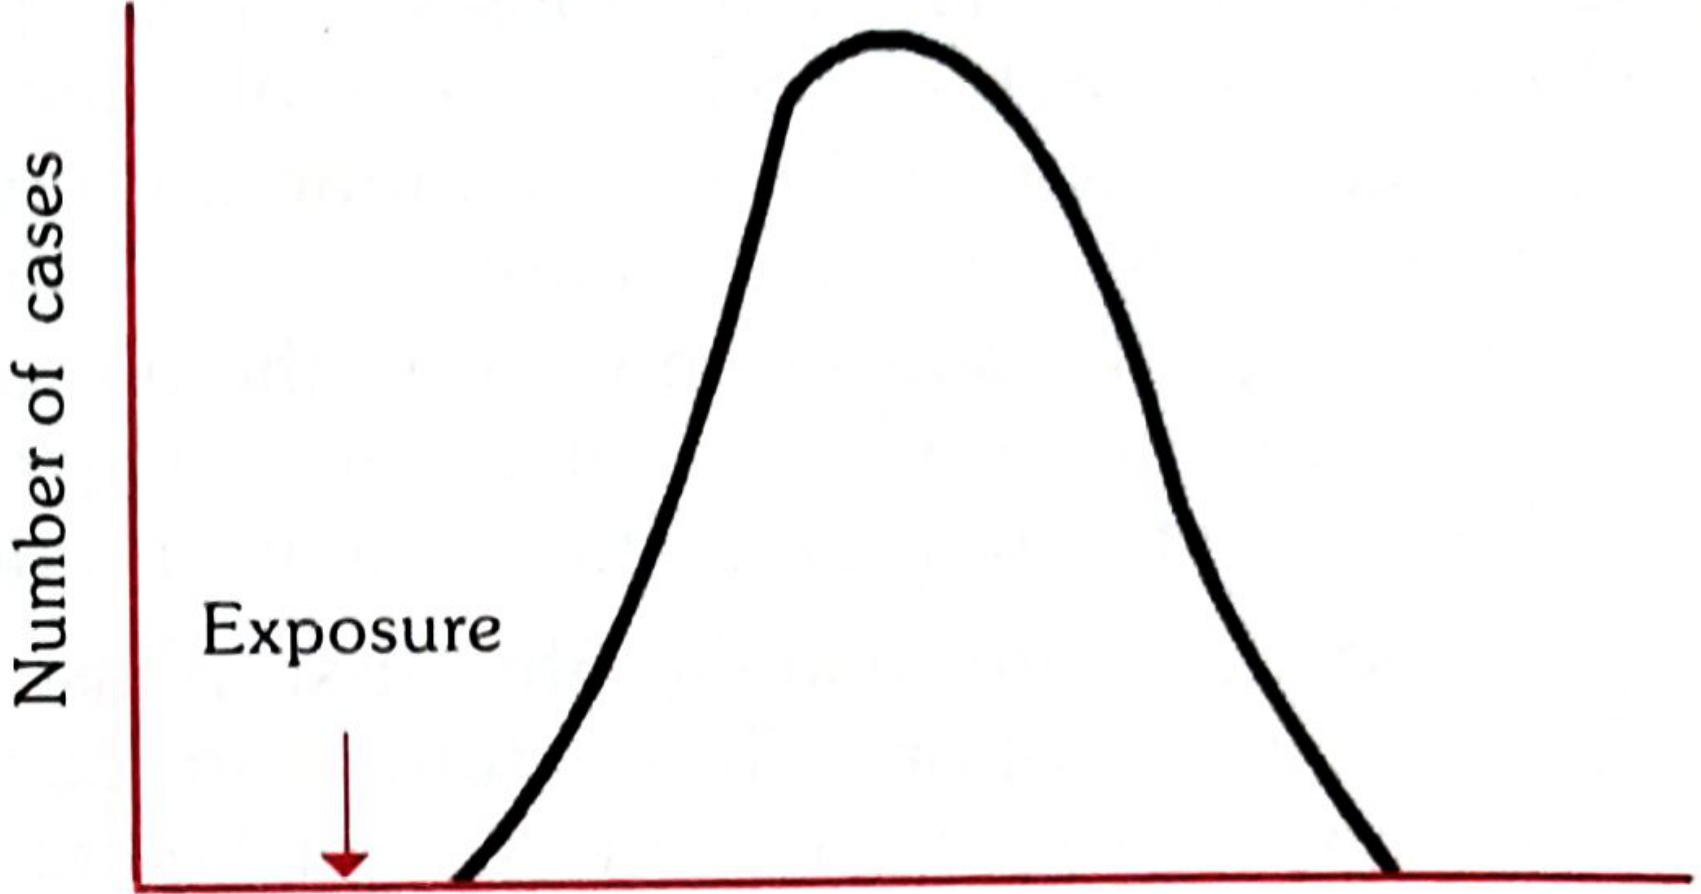
The curve has a single peak - cases accumulate over the incubation period and then decline as susceptibles are exhausted. The time between the marked exposure and the peak of the curve approximates the median incubation period (the time required for 50% of cases to occur after exposure).
Main Features (Three Key Points)
- The epidemic curve rises and falls rapidly - no secondary waves
- The outbreak is explosive - cases cluster within a narrow time interval
- All cases develop within one incubation period of the disease - this is the defining criterion
Causes
Point source epidemics can arise from:
- Infectious agents in food or water (the most common scenario - e.g., a food poisoning outbreak at a shared meal or banquet)
- Non-infectious environmental contamination - industrial chemicals or pollutants in air, water, food, or soil (e.g., the Bhopal gas tragedy; Minamata disease from methylmercury-contaminated fish)
The source does not have to be biological.
How to Identify the Source: The Median Incubation Period Method
One of the most useful analytical tools is working backwards from the epidemic curve:
If you know the disease (and therefore its known incubation period), you can estimate the time of exposure by subtracting the median incubation period from the peak of the epidemic curve.
Conversely, if the exposure time is known (e.g., a single shared meal), you can estimate the causative agent by comparing the observed median incubation period to the known incubation periods of suspected pathogens.
The second diagram below (showing incubation period concepts) distinguishes point source from propagated spread:
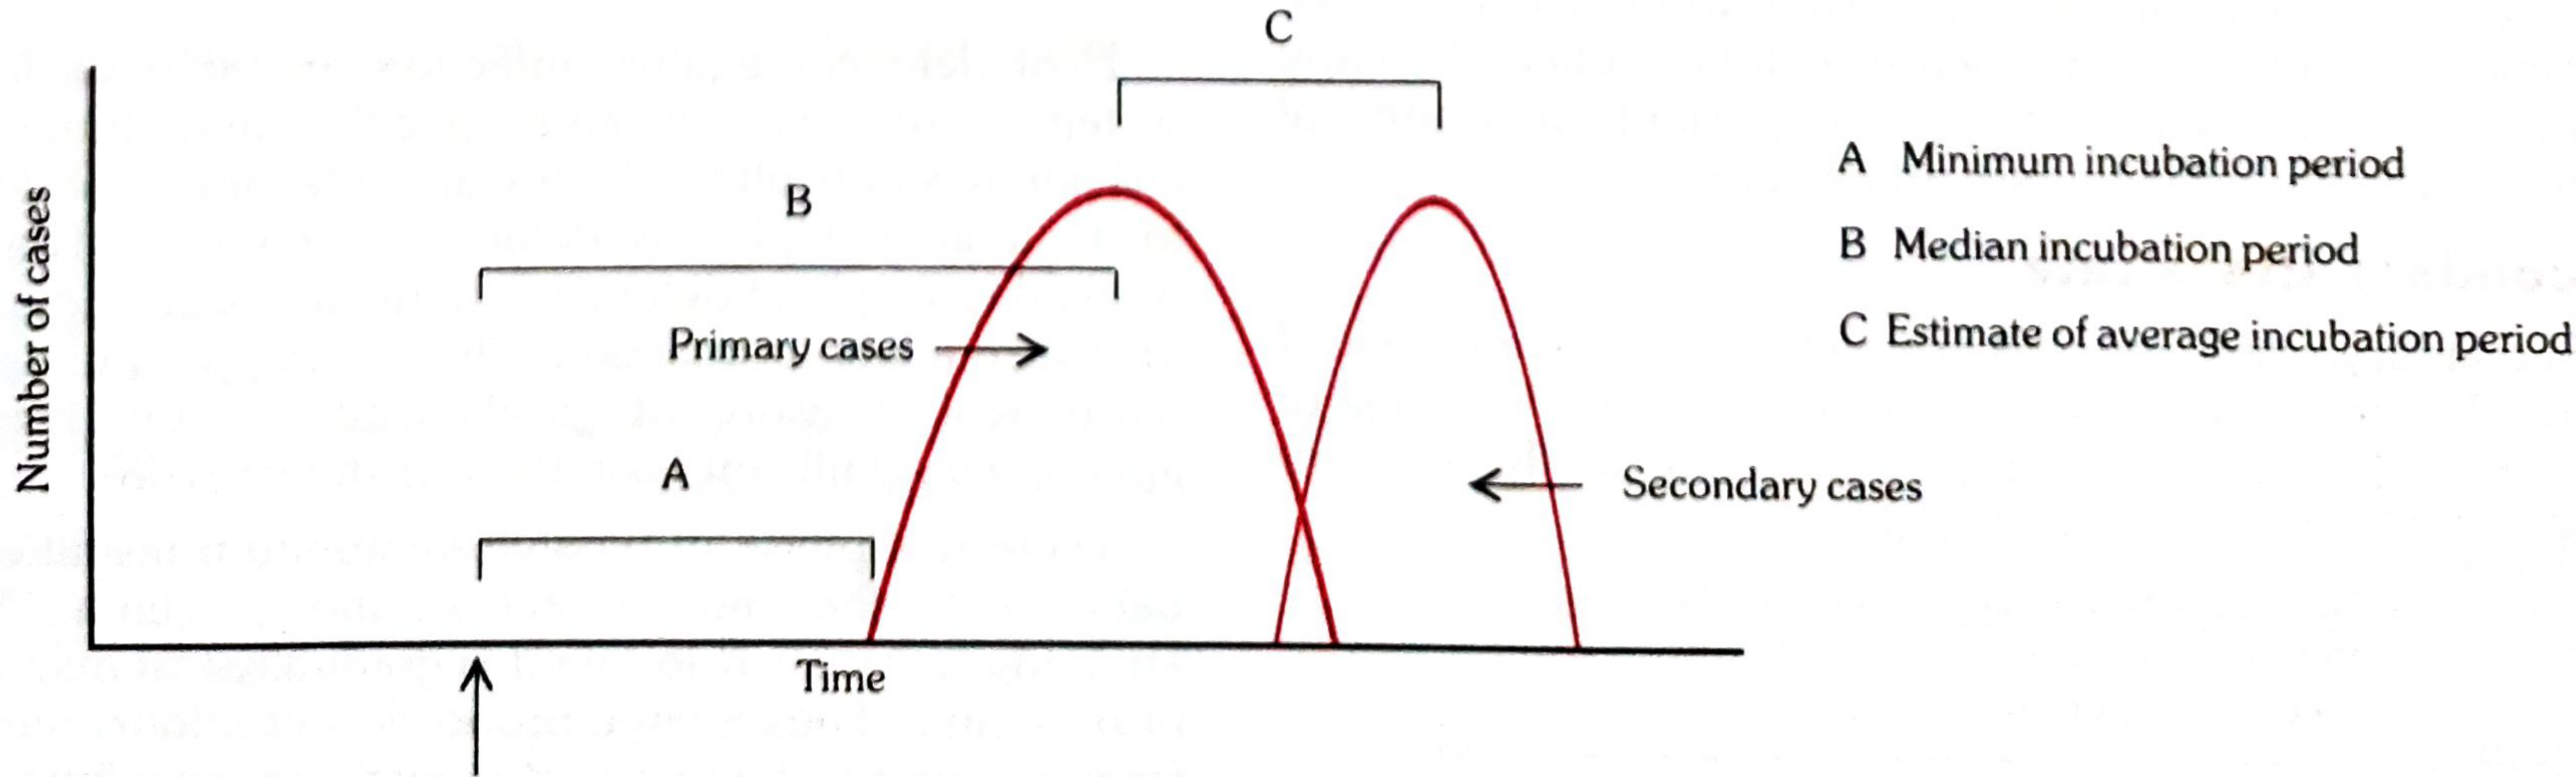
- A = Minimum incubation period
- B = Median incubation period
- C = Estimate of average incubation period
- In a point source epidemic: all cases (primary peak) occur within one incubation period, and no secondary peak follows
- In a propagated epidemic: a second wave (secondary cases) appears separated from the primary cases by one incubation period
Classification of Epidemics (Context)
Point source is one of three major epidemic types:
| Type | Subtype | Key Feature |
|---|---|---|
| A. Common-source | (a) Single exposure = point source | All cases within 1 incubation period; explosive; single peak |
| (b) Continuous/repeated exposure | Extended or irregular outbreak beyond 1 incubation period | |
| B. Propagated | Person-to-person, vector, animal reservoir | Gradual rise, multiple waves, persists until susceptibles exhausted |
| C. Slow (modern) | - | Chronic/long-latency diseases (e.g., cancer from carcinogens) |
Contrast with Propagated Epidemic
| Feature | Point Source | Propagated |
|---|---|---|
| Exposure | Single, brief, simultaneous | Repeated person-to-person (or via vector) |
| Duration | Confined to 1 incubation period | Extends over multiple incubation periods |
| Epidemic curve shape | Sharp single peak, no secondary waves | Gradual rise, multiple successive peaks |
| Secondary cases | None | Present - spread continues until herd immunity achieved |
| Typical example | Food poisoning, Bhopal gas | Hepatitis A, polio, influenza |
A mixed pattern is also possible: an epidemic may start as a common-source outbreak and then continue as propagated spread. Waterborne cholera is the classic example - it reaches a sharp peak but tails off gradually as person-to-person transmission sustains the outbreak. - Park's Textbook of Preventive and Social Medicine
This is a shared conversation. Sign in to Orris to start your own chat.