With images with red circle where imp things are there
And helpfull ecg in icu
ECG interpretation ICU critical care important findings images annotated
ECG changes ICU STEMI hyperkalemia PE pulmonary embolism annotated images red circle
STEMI ECG ST elevation annotated image site:litfl.com OR site:life-in-the-fast-lane.com
https://litfl.com/ecg-changes-in-pulmonary-embolism
hyperkalemia ECG peaked T waves widened QRS annotated image site:litfl.com OR site:ecgwaves.com
S1Q3T3 pattern ECG pulmonary embolism annotated image RBBB right heart strain
ECG in the ICU - Key Patterns with Annotated Images
1. ECG Basics - Normal Waveform (Know this first!)
| Component | Normal Value |
|---|---|
| P wave | 0.06 - 0.11 s |
| PR interval | 0.12 - 0.20 s (3-5 small boxes) |
| QRS complex | < 0.12 s (< 3 small boxes) |
| QT interval | < 0.44 s |
| ST segment | Isoelectric (flat) |
2. STEMI Equivalents - Critical ICU Patterns

What to look for (key patterns):
| Pattern | Where | What it means |
|---|---|---|
| Wellens A | V2-V3 | Biphasic T-wave - critical LAD stenosis |
| Wellens B | V2-V3 | Deeply inverted T-wave - LAD occlusion |
| Hyperacute T-wave | Any lead | Broad bulky T-waves - earliest sign of STEMI |
| De Winter T-wave | Precordial | Upsloping ST depression + tall T - LAD occlusion (no STE!) |
| Posterior OMI | V1-V4 | Maximum ST depression in anterior leads (reciprocal changes) |
| Modified Sgarbossa | Any lead | ST/S ratio ≥ 25% in LBBB - indicates true ischemia |
| Northern OMI | aVR, aVL + inf leads | ST elevation in aVR/aVL + inferior ST depression |
ICU pearl: De Winter and posterior MI are "STEMI equivalents" - they need the same urgent reperfusion but have NO ST elevation! Missing these is a common fatal error.
3. Pulmonary Embolism ECG Changes

PE ECG findings (by mechanism):
| Finding | Significance |
|---|---|
| S1Q3T3 - S wave in I, Q wave + inverted T in III | Classic but only present in ~20% of PE |
| RBBB (complete or incomplete) | RV dilation stretching right bundle |
| Right axis deviation | RV overload |
| T wave inversion V1-V4 | Most specific for PE (up to 99% specific with simultaneous inferior T inversions) |
| Sinus tachycardia | Most common - present in >70% |
| ST elevation in aVR | Massive PE / RV ischemia |
| Atrial fibrillation | Atrial stretch from RV dilation |
ICU pearl: Negative T waves in both lead III and V1 = 88% sensitive, 99% specific for PE vs ACS. This single finding is your best ECG discriminator between the two.
4. Hyperkalemia vs Hypokalemia - Electrolyte Emergencies
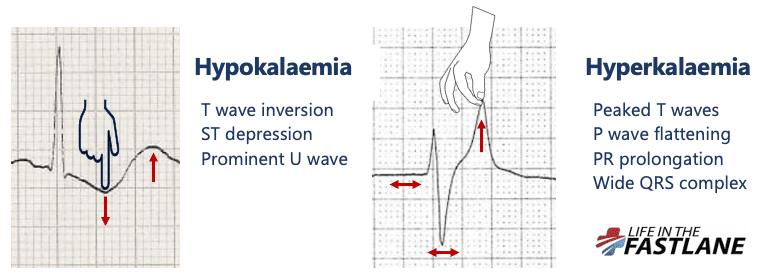

Hyperkalemia progression (K+ rising):
| K+ Level | ECG Change |
|---|---|
| 5.5 - 6.5 mmol/L | Peaked (tented) T waves - narrow, tall, symmetric |
| 6.5 - 7.5 | P wave flattening, PR prolongation |
| 7.5 - 8.0 | Wide QRS complex - sine wave pattern approaching |
| > 9.0 | Sine wave, VF, asystole |
Hypokalemia signs:
- T wave inversion + ST depression + Prominent U wave (U > T in same lead = dangerous)
ICU pearl: Peaked T waves from hyperkalemia can mimic hyperacute T waves of STEMI. Always check your potassium before activating the cath lab in an ICU patient!
5. Quick ICU ECG Checklist
1. Rate       → Tachycardia? Bradycardia?
2. Rhythm     → Regular? P waves present? P:QRS relationship?
3. Axis       → Left (LAD)? Right (RAD)?
4. PR interval → Prolonged = AV block? Short = WPW/pre-excitation?
5. QRS width  → Wide = BBB, hyperkalemia, toxin, pacemaker?
6. ST segment → Elevation (STEMI)? Depression (ischemia, PE, digoxin)?
7. T waves    → Peaked (hyperK)? Inverted (ischemia, PE, strain)?
8. QT interval → Prolonged = torsades risk (drugs, hypoMg, hypoK, hypoCA)?
9. U waves    → Prominent = hypokalemia?
6. Dangerous Arrhythmias to Spot Immediately in ICU
| Arrhythmia | Key ECG Feature | Action |
|---|---|---|
| VF | Chaotic baseline, no organized QRS | CPR + defibrillate |
| VT (pulseless) | Wide complex tachycardia, regular, rate >120 | CPR + defibrillate |
| VT (with pulse) | Wide QRS tachycardia | Amiodarone / cardiovert |
| Complete heart block (3rd degree) | P waves and QRS completely dissociated | Pacing |
| Torsades de Pointes | QRS twists around isoelectric line, long QTc | Stop causative drug, IV Mg2+ |
| SVT | Narrow complex tachycardia, no P waves | Adenosine / cardiovert |
| AF with rapid ventricular rate | Irregularly irregular, no P waves, narrow QRS | Rate control |
Summary: The "Can't Miss" ICU ECG Diagnoses
| Diagnosis | Red flag ECG finding |
|---|---|
| STEMI / OMI | STE ≥1 mm in 2 contiguous leads (or equivalent pattern) |
| Pulmonary Embolism | Sinus tach + S1Q3T3 + T inversion V1-V4 |
| Hyperkalemia | Peaked T waves → wide QRS → sine wave |
| Complete heart block | Complete P-QRS dissociation |
| Torsades | Long QTc + twisting QRS |
| Digoxin toxicity | Scooped ST ("Salvador Dali's mustache"), bradyarrhythmias |
| Hypothermia | Osborn J-wave (notch at J-point), bradycardia |
Can you explain ecg with basics how to read it for fresher with images which circle with red where important notes waves is there
ECG basics for beginners P wave QRS T wave annotated image red circle labeled
ECG paper squares big small box heart rate calculation beginner image annotated
12 lead ECG placement electrode positions diagram annotated site:litfl.com OR site:ecgwaves.com
ECG systematic approach beginner rate rhythm axis P wave QRS T wave infographic annotated
ECG axis determination lead I aVF normal left right axis deviation image annotated
📋 ECG Basics - A Complete Beginner's Guide
🔴 STEP 1 - What IS an ECG?
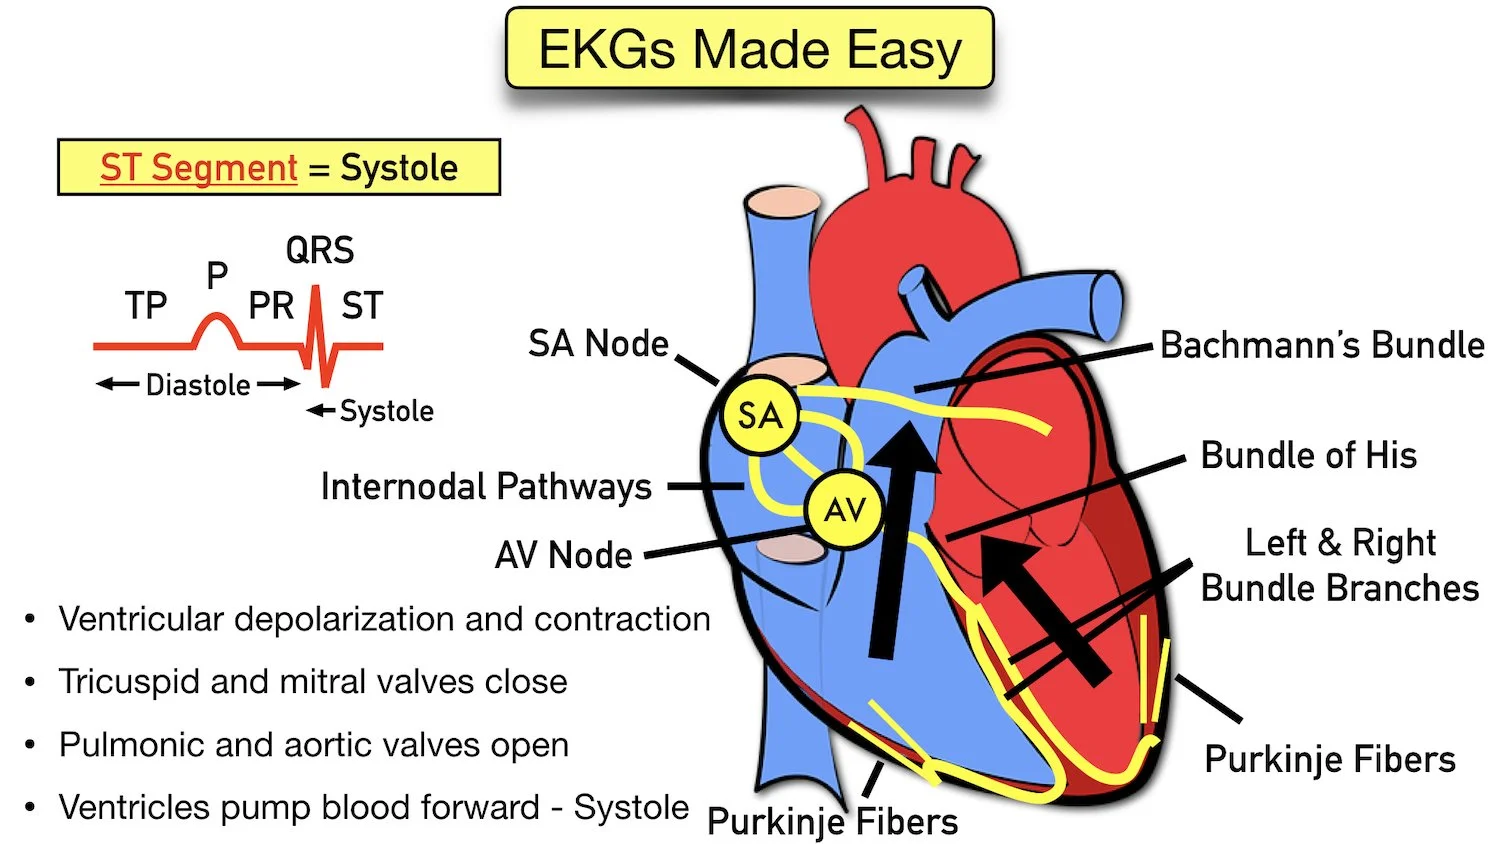
SA Node → Internodal pathways → AV Node → Bundle of His → Left & Right Bundle Branches → Purkinje Fibers
🔴 STEP 2 - Understanding the ECG Paper
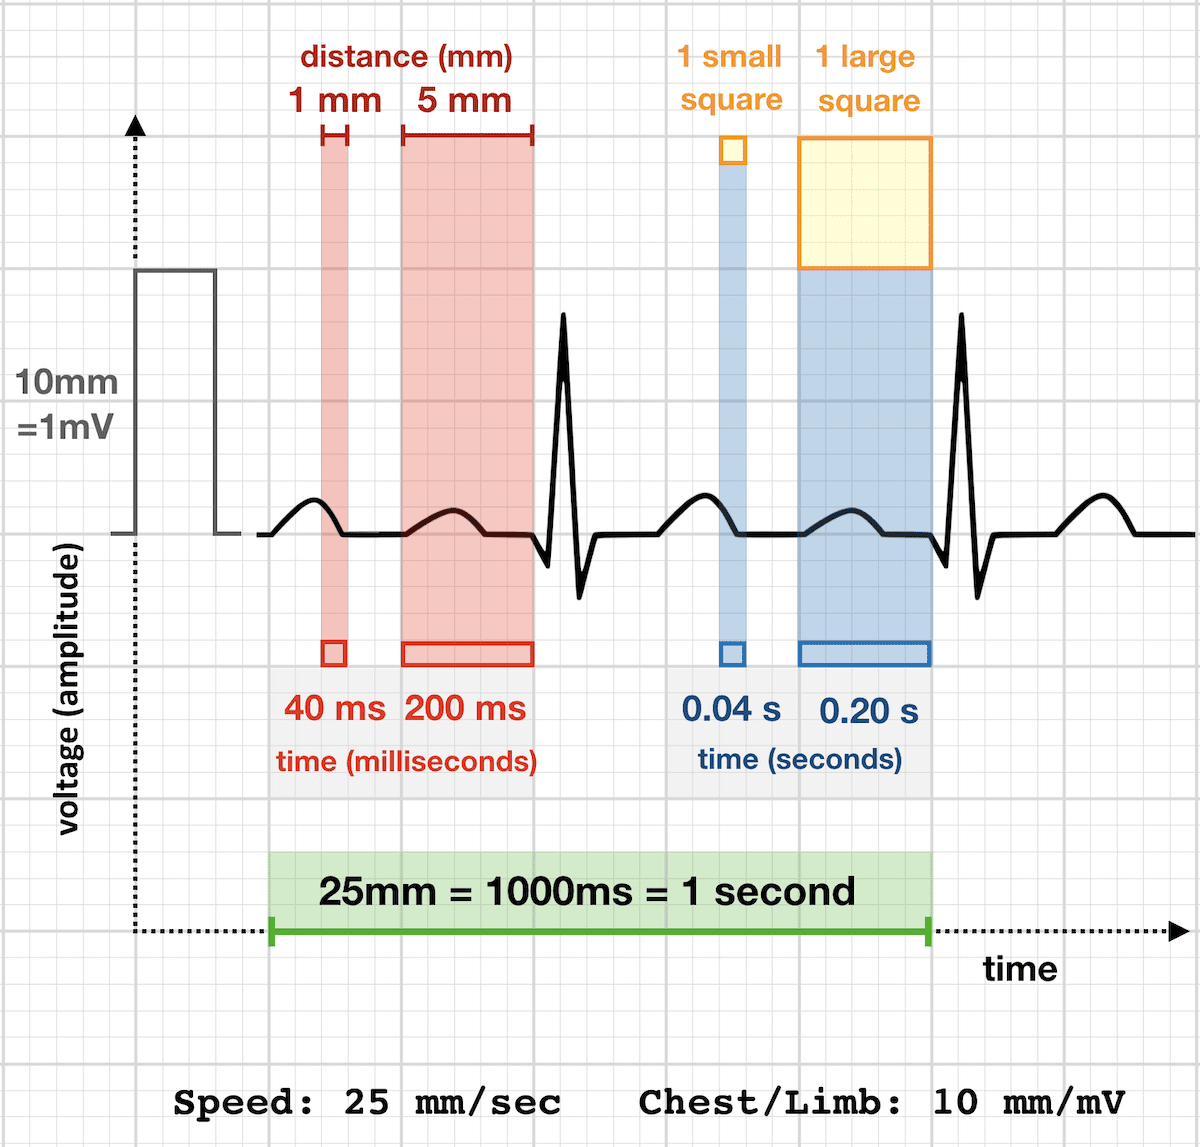
The Grid - memorize this:
| Square | Size | Time | Voltage |
|---|---|---|---|
| Small square | 1 mm | 0.04 sec (40 ms) | 0.1 mV |
| Large square (5 small) | 5 mm | 0.20 sec (200 ms) | 0.5 mV |
| Standard calibration | - | 25 mm = 1 second | 10 mm = 1 mV |
🔴 Key rule: At 25 mm/sec standard speed, 5 large boxes = 1 second
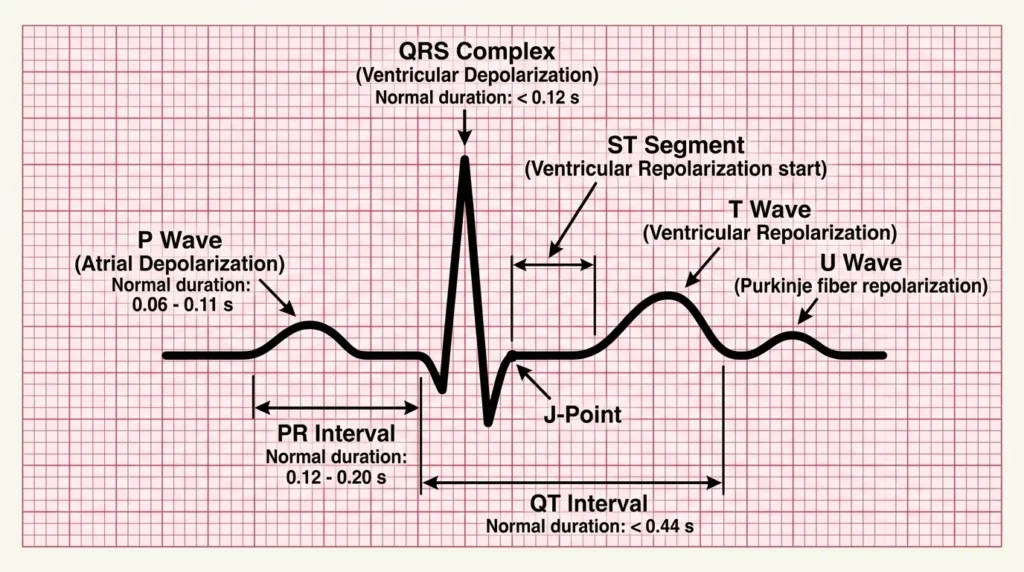
🔴 STEP 3 - The ECG Waveform Explained
Every wave explained:
🔴 P WAVE
- What it is: Atrial depolarization (atria contracting)
- Normal: Small rounded hump before the QRS
- Duration: 0.06 - 0.11 sec (< 3 small boxes)
- Height: < 2.5 mm
- Should be: Upright in leads I, II, aVF; inverted in aVR
- ❗ If absent = atrial fibrillation or junctional rhythm
🔴 PR INTERVAL
- What it is: Time from start of P wave to start of QRS (AV node delay)
- Normal: 0.12 - 0.20 sec (3 to 5 small boxes)
- ❗ Prolonged PR (>0.20 s) = AV block (1st degree)
- ❗ Short PR (<0.12 s) = WPW syndrome or junctional rhythm
🔴 QRS COMPLEX
- What it is: Ventricular depolarization (ventricles contracting - the main pumping action)
- Q wave: Small initial downward deflection
- R wave: Main upward spike - the tallest part
- S wave: Downward deflection after R
- Normal width: < 0.12 sec (< 3 small boxes)
- ❗ Wide QRS (>0.12 s) = Bundle branch block, hyperkalemia, ventricular rhythm
🔴 ST SEGMENT
- What it is: Period between ventricular depolarization and repolarization (ventricles are contracted, no electrical activity)
- Normal: Flat, at the isoelectric line (same level as baseline)
- ❗ ST elevation = STEMI (heart attack), pericarditis
- ❗ ST depression = NSTEMI, ischemia, digoxin effect
🔴 T WAVE
- What it is: Ventricular repolarization (ventricles relaxing)
- Normal: Rounded, upright in most leads; same direction as QRS
- Height: < 5 mm in limb leads, < 10 mm in precordial leads
- ❗ Peaked T waves = Hyperkalemia (earliest sign!)
- ❗ Inverted T waves = Ischemia, LVH, PE, RBBB
🔴 QT INTERVAL
- What it is: Total ventricular activity (depolarization + repolarization)
- Normal: < 0.44 sec (< 11 small boxes) - corrected for rate (QTc)
- ❗ Long QTc = Risk of Torsades de Pointes (dangerous arrhythmia)
- Causes of long QT: drugs (amiodarone, haloperidol, methadone), hypoKalemia, hypoMagnesemia, hypoCa
🔴 U WAVE
- Small positive deflection after the T wave
- Normal in some patients
- ❗ Prominent U wave = Hypokalemia
🔴 STEP 4 - How to Calculate Heart Rate
Method 1: Large Box Method (for regular rhythms - quickest!)
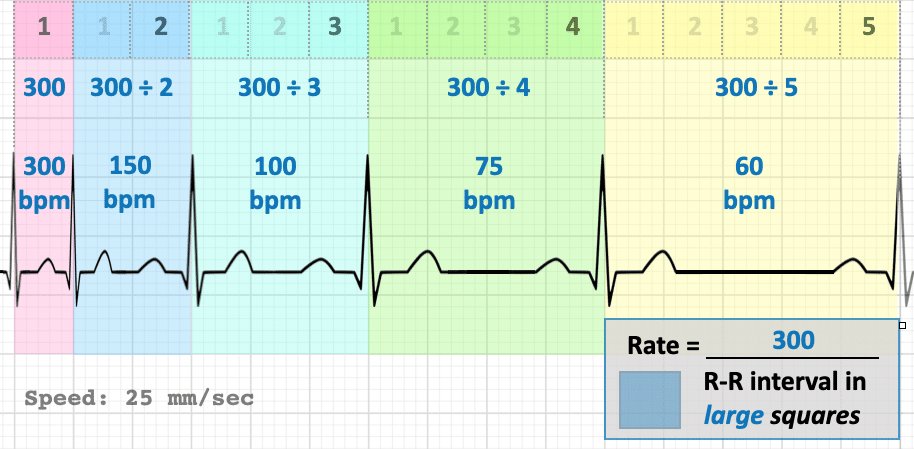
Rate = 300 ÷ number of large boxes between R waves| Large boxes between R-R | Heart Rate |
|---|---|
| 1 box | 300 bpm |
| 2 boxes | 150 bpm |
| 3 boxes | 100 bpm |
| 4 boxes | 75 bpm |
| 5 boxes | 60 bpm |
| 6 boxes | 50 bpm |
🔴 Mnemonic: 300 - 150 - 100 - 75 - 60 - 50
Method 2: Small Box Method (more precise)

Rate = 1500 ÷ number of small boxes between R wavesMethod 3: 6-Second Method (for irregular rhythms like AF)
- Count the number of QRS complexes in a 10-second strip
- Multiply by 6 = heart rate per minute
🔴 STEP 5 - Electrode Placement (How to Put On the Leads)
Chest (Precordial) Leads:
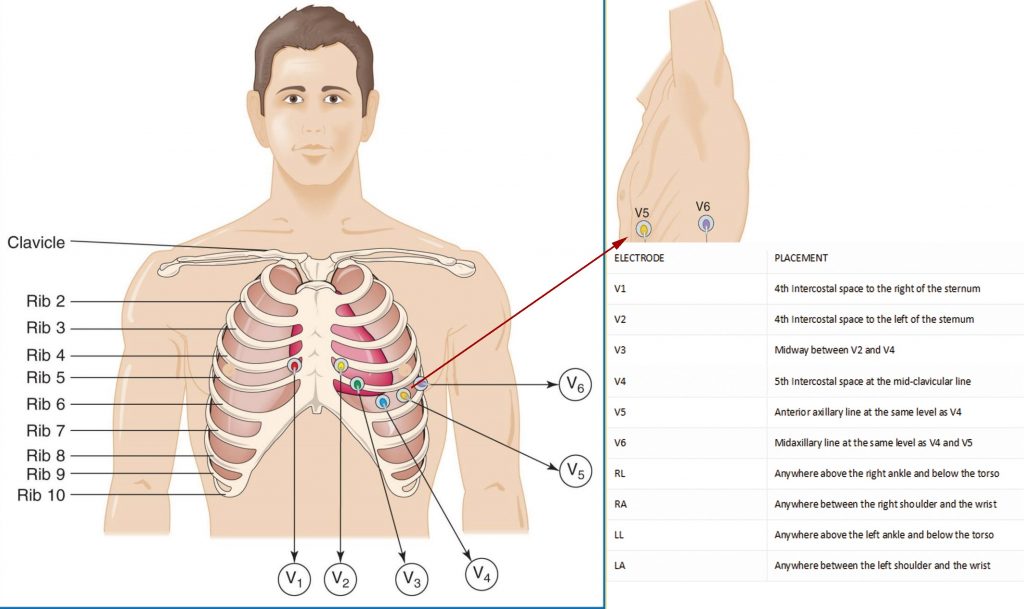
| Lead | Position |
|---|---|
| V1 | 4th intercostal space, RIGHT of sternum |
| V2 | 4th intercostal space, LEFT of sternum |
| V3 | Midway between V2 and V4 |
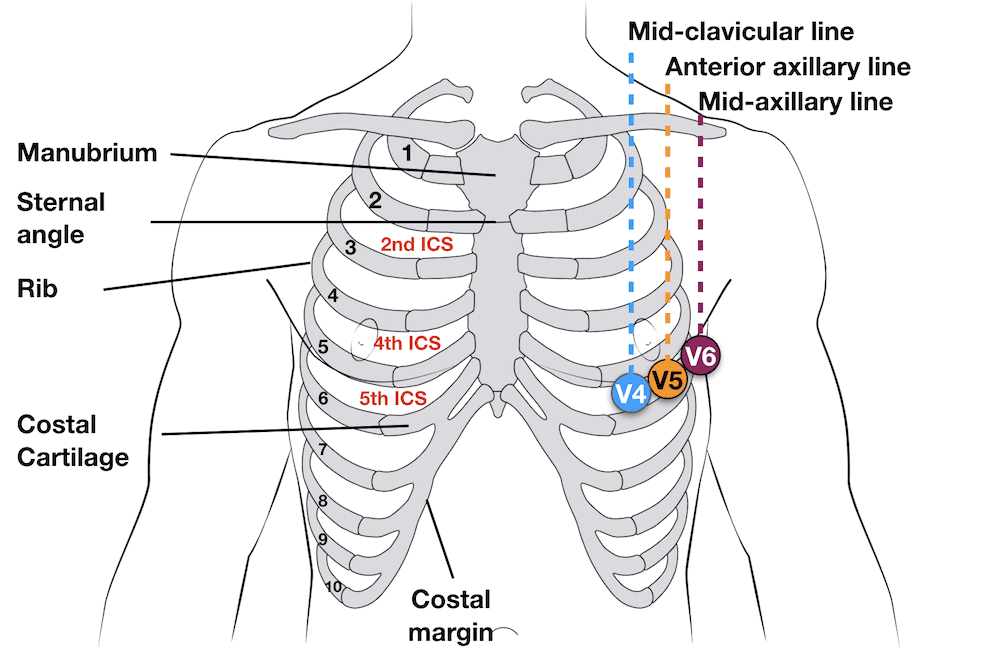
| V4 | 5th intercostal space, mid-clavicular line |
| V5 | Anterior axillary line, same level as V4 |
| V6 | Mid-axillary line, same level as V4 and V5 |
Limb Leads:
| Lead | Position |
|---|---|
| RA (Red) | Right arm |
| LA (Yellow) | Left arm |
| LL (Green) | Left leg |
| RL (Black) | Right leg (ground) |
🔴 Memory trick for limb leads: "Ride Your Green Bike" = Right arm Red, Left arm Yellow (ride a bike), Green Left leg, Black Right leg
🔴 STEP 6 - ECG Axis (Quick Method)
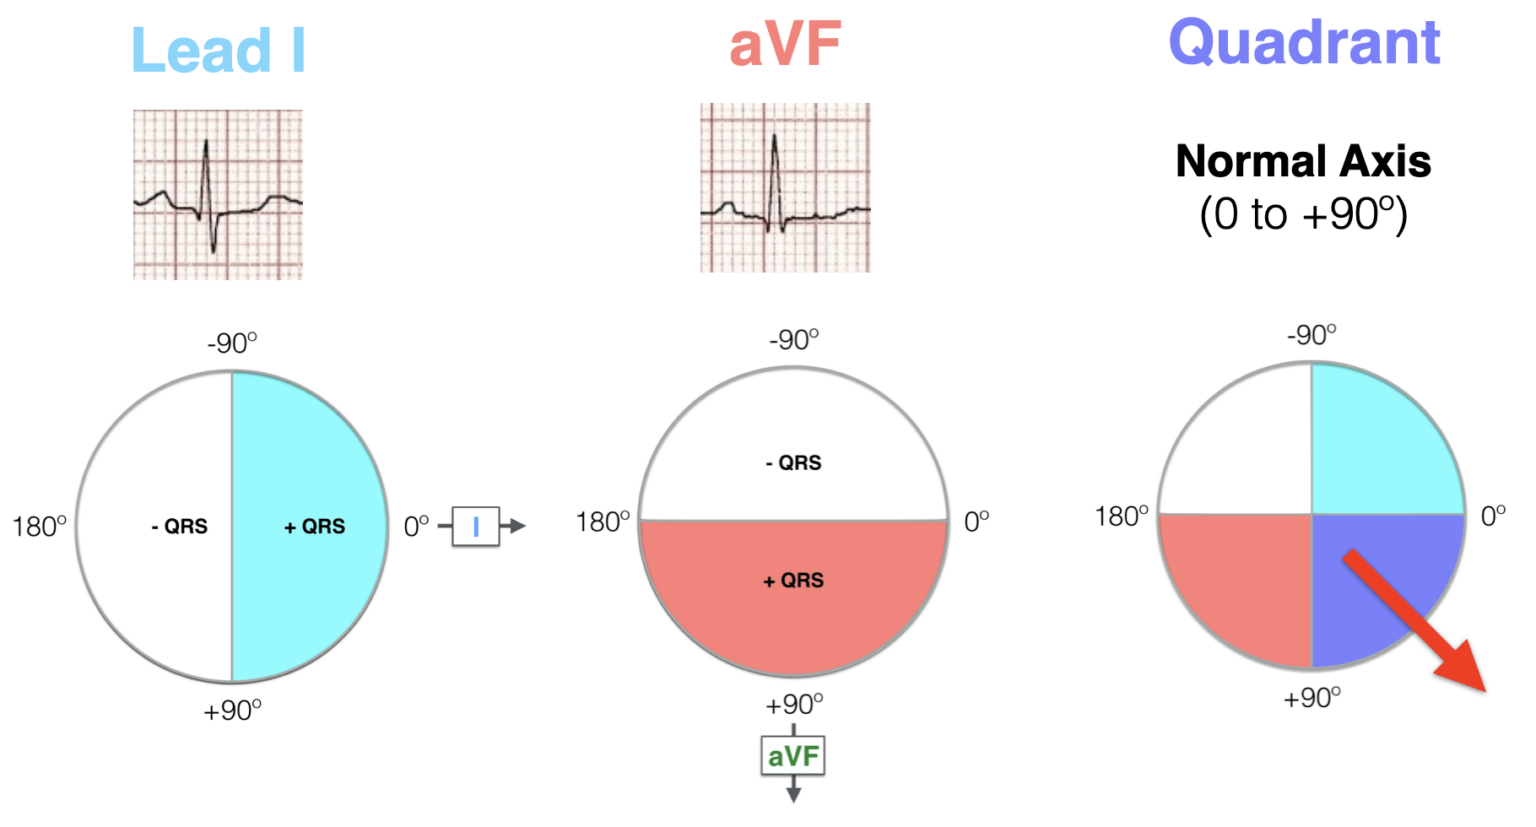
The Quick 2-Lead Axis Method (Use Lead I + aVF):
| Lead I | aVF | Axis |
|---|---|---|
| ⬆️ Positive | ⬆️ Positive | Normal axis (0° to +90°) |
| ⬆️ Positive | ⬇️ Negative | Left axis deviation (LAD) |
| ⬇️ Negative | ⬆️ Positive | Right axis deviation (RAD) |
| ⬇️ Negative | ⬇️ Negative | Extreme axis deviation (rare) |
🔴 STEP 7 - The Systematic Approach (Never Miss Anything!)
┌─────────────────────────────────────────────────┐
│  ECG READING CHECKLIST (for freshers)           │
├─────────────────────────────────────────────────┤
│  1. RATE     → Count using 300 / large box rule │
│               Normal = 60-100 bpm               │
│  2. RHYTHM   → Regular or irregular?            │
│               P wave before every QRS?          │
│  3. AXIS     → Check Lead I and aVF             │
│  4. P WAVE   → Present? Upright in II?          │
│               Duration < 0.11s? Height <2.5mm?  │
│  5. PR INT.  → 0.12-0.20 sec? (3-5 boxes)       │
│  6. QRS      → Width < 0.12s? (< 3 boxes)       │
│               Look for Q waves (pathological?)  │
│  7. ST SEG.  → Elevated? Depressed? Flat?       │
│  8. T WAVE   → Upright? Inverted? Peaked?       │
│  9. QT INT.  → < 0.44 sec? (< 11 small boxes)  │
│ 10. U WAVE   → Prominent?                       │
└─────────────────────────────────────────────────┘
🔴 STEP 8 - What Leads "See" (Which Part of the Heart)
| Lead Group | Leads | Heart Wall Viewed |
|---|---|---|
| Inferior | II, III, aVF | Inferior (bottom) wall - RCA territory |
| Lateral | I, aVL, V5, V6 | Lateral (left side) wall - LCx territory |
| Anterior | V1-V4 | Anterior wall - LAD territory |
| Septal | V1, V2 | Interventricular septum |
| Right | aVR | Right atrium, aortic outflow |
🔴 Golden rule: ST changes in 2 or more contiguous leads from the same territory = localized pathology (e.g., STEMI)
🔴 Quick Summary Card for Freshers
| What you see | What it means | Action |
|---|---|---|
| No P waves, irregular rhythm | Atrial Fibrillation | Rate control / anticoagulate |
| Wide QRS (>0.12s) | BBB or ventricular rhythm | Determine cause |
| Long PR (>0.20s) | 1st degree AV block | Monitor |
| ST elevation | STEMI / pericarditis | Urgent ECG repeat + troponin |
| ST depression | Ischemia / NSTEMI | Troponin, cardiology |
| Peaked T waves | Hyperkalemia | Check K+ urgently |
| Long QTc (>0.44s) | Risk of Torsades | Review drugs, check electrolytes |
| P waves with no QRS | 3rd degree (complete) AV block | Pacing needed |
| Rate > 150, narrow QRS | SVT | Vagal maneuvers / adenosine |
| Rate > 150, wide QRS | VT until proven otherwise | EMERGENCY |
Tip for freshers: Print this checklist and physically go through each step on every ECG you read. After ~50 ECGs it becomes automatic!