
Explain me 10 common heart diseases with ECG changes and ECG images of those diseases
Reading File
Now let me run parallel searches across multiple ECG/heart disease topics:
Finding Sources
Searching Images
ECG myocardial infarction ST elevation STEMI
Searching Images
ECG atrial fibrillation irregular rhythm
Finding Sources
Searching Images
ECG heart block complete third degree AV block
Searching Images
ECG ventricular tachycardia wide QRS tachycardia
Searching Images
ECG left ventricular hypertrophy high voltage QRS
Searching Images
ECG Wolff-Parkinson-White pre-excitation delta wave
Searching Images
ECG pericarditis diffuse ST elevation saddle shape PR depression
Searching Images
ECG hypertrophic cardiomyopathy deep Q waves ST changes
Searching Images
ECG pulmonary embolism right heart strain S1Q3T3 sinus tachycardia
Searching Images
ECG long QT syndrome prolonged QTc torsades de pointes
I now have excellent ECG images for all 10 conditions. Let me update my todos and compile the comprehensive answer.Here is a comprehensive guide to 10 common heart diseases with their ECG changes and representative ECG images:
10 Common Heart Diseases: ECG Changes & Images
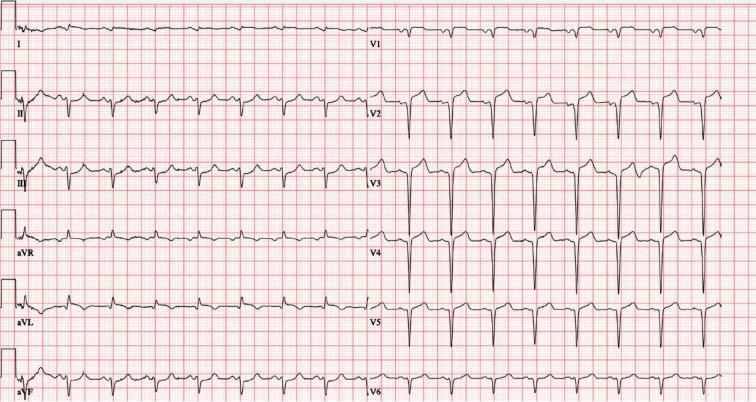
1. 🫀 ST-Elevation Myocardial Infarction (STEMI)
ECG Changes
| Phase | Changes |
|---|---|
| Hyperacute (minutes) | Tall, peaked "hyperacute" T-waves |
| Acute (hours) | ST-segment elevation ≥1 mm (convex/tombstone morphology), reciprocal ST depression in opposite leads |
| Evolving | Pathological Q-waves (>25% of R-wave height, >40 ms wide) |
| Chronic | Q-waves persist; T-wave inversion normalizes |
Lead localization:
- Anterior (LAD): V1–V4
- Inferior (RCA): II, III, aVF
- Lateral (LCx): I, aVL, V5–V6
- aVR elevation → left main / proximal LAD occlusion
2. 🫀 Atrial Fibrillation (AF)
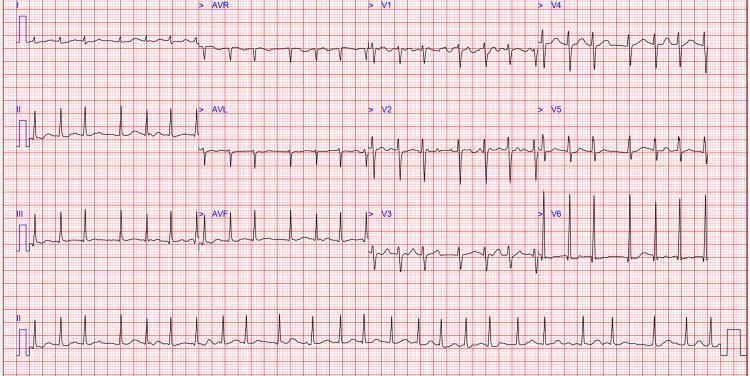
ECG Changes
- Absent P waves — replaced by fine fibrillatory (f) waves (best seen in V1)
- Irregularly irregular R-R intervals — hallmark finding
- Narrow QRS (unless aberrant conduction or pre-excitation)
- Ventricular rate variable: bradycardic, normal, or tachycardic
- No fixed PR interval
3. 🫀 Complete (Third-Degree) AV Block
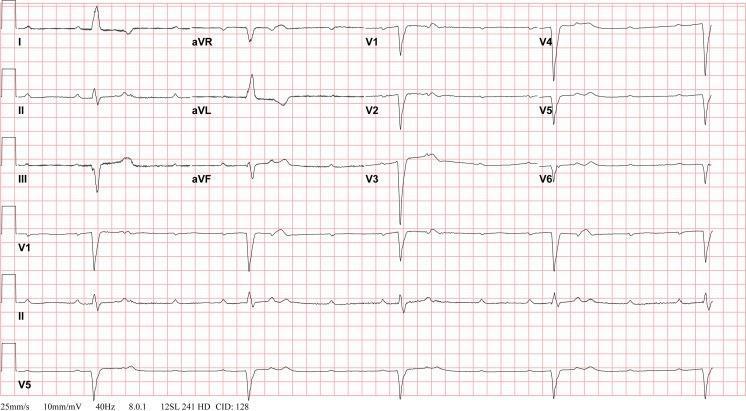
ECG Changes
- Complete AV dissociation — P-waves and QRS complexes march through each other with NO relationship
- P-P intervals regular; R-R intervals regular — but at completely different rates
- Atrial rate > Ventricular escape rate (atria ~70–90 bpm; ventricles 20–40 bpm)
- Escape QRS morphology:
- Narrow (junctional escape) if block is at AV node
- Wide/bizarre (ventricular escape) if block is infra-Hisian
- No fixed PR interval — PR interval randomly varies
4. 🫀 Ventricular Tachycardia (VT)
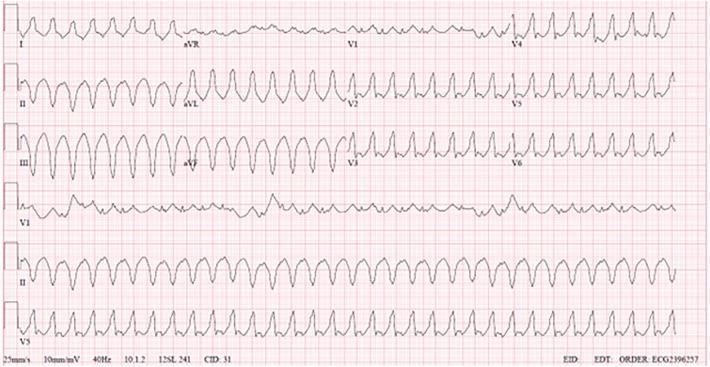
ECG Changes
- Wide QRS tachycardia (QRS ≥ 120 ms), rate 100–250 bpm
- AV dissociation (P-waves unrelated to QRS) — most specific sign for VT
- Capture beats — occasional narrow QRS (sinus captures ventricles)
- Fusion beats — hybrid narrow+wide QRS
- Concordance in precordial leads (all positive or all negative V1–V6)
- Brugada criteria and Vereckei algorithm help differentiate from SVT with aberrancy
- May degenerate into ventricular fibrillation
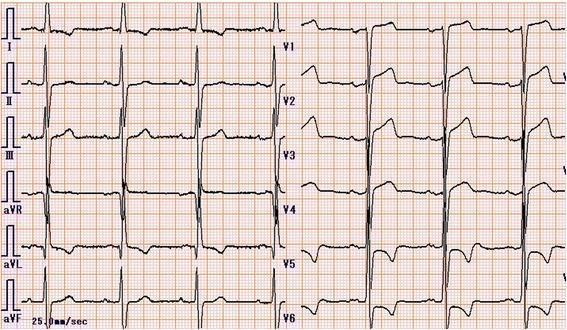
5. 🫀 Left Ventricular Hypertrophy (LVH)
ECG Changes
Voltage criteria (Sokolow-Lyon):
- S in V1 + R in V5 or V6 > 35 mm
- R in aVL > 11 mm
Repolarization ("strain pattern"):
- ST depression + T-wave inversion in I, aVL, V5–V6 (lateral leads)
- Left axis deviation
- Prolonged QRS duration (may approach 110 ms)
- Broad, notched P-wave in II suggesting left atrial enlargement
Common causes: Hypertension, aortic stenosis, hypertrophic cardiomyopathy
6. 🫀 Wolff-Parkinson-White (WPW) Syndrome
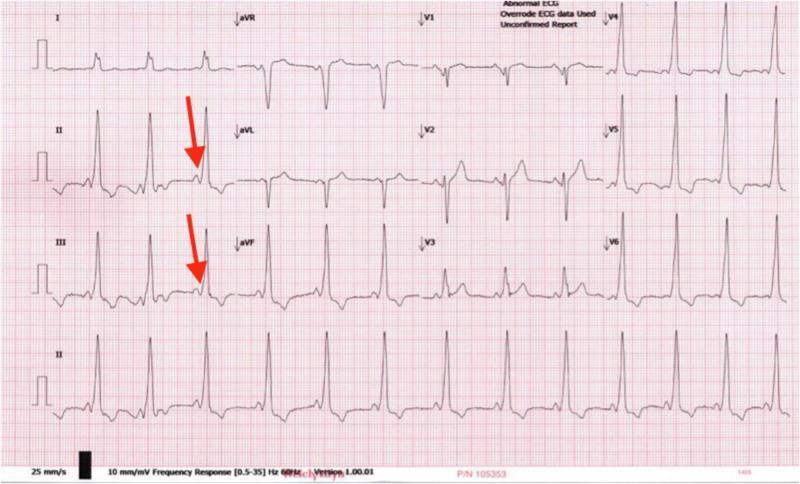
ECG Changes
Classic pre-excitation triad:
- Short PR interval < 120 ms (accessory pathway bypasses AV node delay)
- Delta wave — slurred upstroke at the beginning of QRS (slow conduction through myocardium)
- Widened QRS > 120 ms (fusion of normal + accessory conduction)
Additional features:
- Secondary ST-T changes (discordant to QRS vector)
- Pseudo-Q waves in some leads (mimicking old MI)
- Accessory pathway localization by delta wave polarity (negative in inferior leads → posteroseptal pathway)
- Risk of rapid AF with antegrade accessory conduction → ventricular fibrillation
7. 🫀 Acute Pericarditis
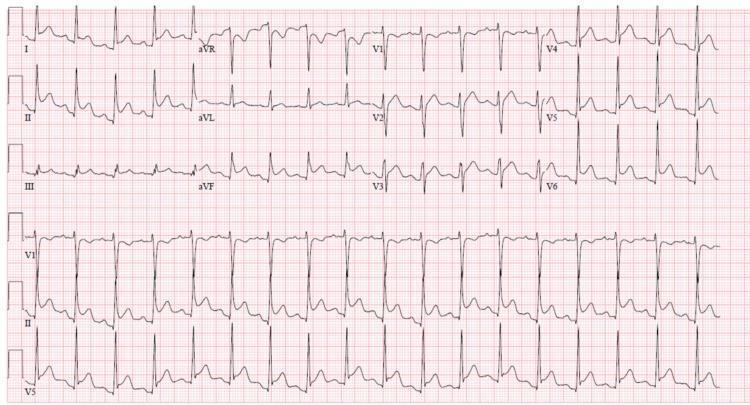
ECG Changes (evolve over 4 stages)
| Stage | ECG Finding | Timing |
|---|---|---|
| I | Diffuse concave ("saddle-shaped") ST elevation in all leads except aVR/V1 + PR depression | Days 1–2 |
| II | ST normalizes; T-waves flatten | Days 3–7 |
| III | Diffuse T-wave inversions | Weeks 1–3 |
| IV | ECG normalizes | Weeks–months |
Key differentiators from STEMI:
- ST elevation is diffuse (not limited to one coronary territory)
- Concave morphology (vs convex in STEMI)
- PR depression in II, V4–V6 (PR elevation in aVR) — very specific
- Spodick's sign: downsloping TP segment
- No reciprocal ST depression (except aVR)
- No Q-waves
8. 🫀 Hypertrophic Cardiomyopathy (HCM)
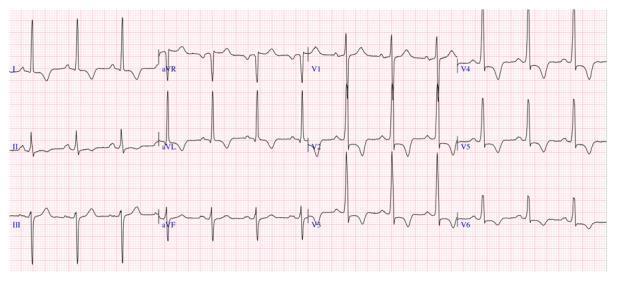
ECG Changes
- Left ventricular hypertrophy by voltage criteria
- "Giant" deep symmetric T-wave inversions in lateral/precordial leads (especially V4–V6) — hallmark of apical variant (Yamaguchi)
- Septal Q waves — deep narrow Q-waves in I, aVL, V5–V6 (due to septal hypertrophy causing abnormal septal depolarization)
- ST-segment depression in lateral leads (strain pattern)
- Left axis deviation
- Prolonged QTc (~460 ms)
- Abnormal P-waves (left atrial enlargement)
- ECG is abnormal in ~95% of symptomatic HCM patients
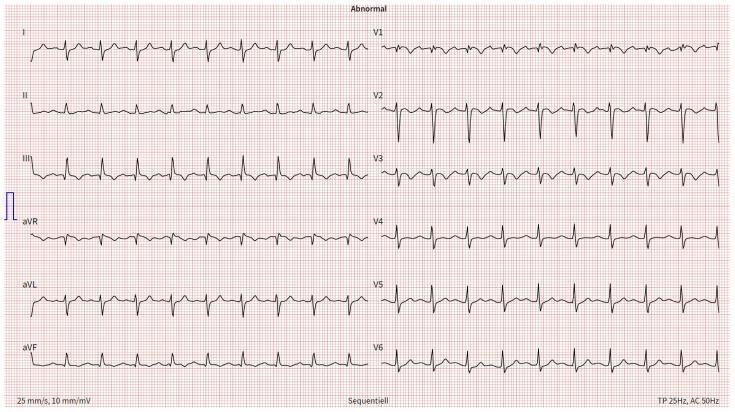
9. 🫀 Pulmonary Embolism (PE)
ECG Changes
Most common finding is sinus tachycardia (>40% of cases). Classic but non-specific signs of right heart strain:
| Sign | Description |
|---|---|
| S1Q3T3 | S-wave in I + Q-wave in III + T-wave inversion in III |
| Sinus tachycardia | Most common finding |
| Incomplete/complete RBBB | rSR' in V1, wide S in I, V5–V6 |
| T-wave inversions | V1–V4 (right ventricular strain) |
| Right axis deviation | |
| P pulmonale | Tall peaked P-waves (>2.5 mm) in II |
| AF | May precipitate new AF |
S1Q3T3 is present in only ~20% of PE cases — sinus tachycardia alone is more common
10. 🫀 Long QT Syndrome (LQTS)
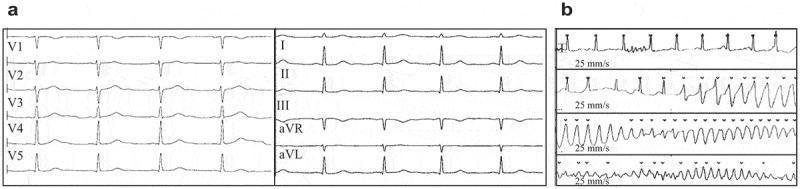
ECG Changes
- Prolonged QTc interval:
- Normal: ♂ < 440 ms; ♀ < 460 ms
- Borderline: 440–470 ms (♂), 460–480 ms (♀)
- Abnormal: > 470 ms (♂), > 480 ms (♀)
- High risk: > 500 ms
- T-wave morphology abnormalities by subtype:
- LQT1: Broad-based T-waves (absent "notch")
- LQT2: Low-amplitude, notched/bifid T-waves
- LQT3: Normal T-wave, prolonged isoelectric ST segment before T
- T-wave alternans (beat-to-beat T-wave changes in amplitude/polarity) — marker of high arrhythmic risk
- Degeneration into Torsades de Pointes (polymorphic VT with twisting QRS around isoelectric line)
Quick Reference Summary
| # | Disease | Key ECG Hallmark |
|---|---|---|
| 1 | STEMI | Convex ST elevation + Q-waves in a vascular territory |
| 2 | Atrial Fibrillation | No P-waves + irregularly irregular rhythm |
| 3 | Complete AV Block | AV dissociation (P-waves march independently) |
| 4 | Ventricular Tachycardia | Wide QRS tachycardia + AV dissociation |
| 5 | LVH | High voltage (SV1+RV5 > 35 mm) + lateral strain |
| 6 | WPW Syndrome | Short PR + delta wave + wide QRS |
| 7 | Acute Pericarditis | Diffuse concave ST elevation + PR depression |
| 8 | Hypertrophic Cardiomyopathy | Giant T-wave inversions + deep Q-waves |
| 9 | Pulmonary Embolism | Sinus tachycardia + S1Q3T3 + right strain |
| 10 | Long QT Syndrome | Prolonged QTc > 480 ms + risk of Torsades |
Clinical note: ECG interpretation must always be correlated with the patient's clinical history, symptoms, examination findings, and other investigations. No single ECG finding is pathognomonic in isolation.Here's a summary of what was covered across all 10 conditions, each with a real clinical ECG image:
- STEMI — Convex ST elevation in a vascular territory, reciprocal changes, evolving Q-waves
- Atrial Fibrillation — No P-waves, irregularly irregular rhythm, fibrillatory baseline
- Complete AV Block — Full AV dissociation with independent P-wave and escape rhythms
- Ventricular Tachycardia — Wide-complex tachycardia, AV dissociation, concordance pattern
- LVH — Voltage criteria (SV1+RV5 >35 mm), lateral strain pattern (ST depression + T inversion)
- WPW Syndrome — Short PR interval, delta wave, widened QRS, pre-excitation triad
- Acute Pericarditis — Diffuse concave ST elevation, PR depression, Spodick's sign
- Hypertrophic Cardiomyopathy — Giant T-wave inversions, deep narrow Q-waves, LVH voltage
- Pulmonary Embolism — Sinus tachycardia, S1Q3T3 pattern, right ventricular strain signs
- Long QT Syndrome — Prolonged QTc >480 ms, T-wave morphology subtypes, Torsades de Pointes
Each entry includes the specific leads affected, morphological criteria, and clinical context to help you recognize these patterns at the bedside or on exams.
This is a shared conversation. Sign in to Orris to start your own chat.