
Teach me most easiest way for EF calculation in ECHO
I'll start with a quick answer, then dive into the medical library for detailed content.
The easiest method for ejection fraction (EF) calculation in echocardiography is the Visual (Eyeball) method, followed by the Teichholz method (M-mode) for a quick numeric estimate. The gold standard is the Biplane Simpson's method of discs, which is what most guidelines recommend. Let me pull the detailed textbook content on this.
Searching sources...
Reading File
Now let me search the library and web in parallel for EF calculation methods.
Finding Sources
Finding Sources
Searching the Web
easiest method EF ejection fraction calculation echocardiography visual Simpson Teichholz comparison
Let me search with broader terms in the library and extract the POCUS101 article for details.
Finding Sources
Reading Web Page
https://www.pocus101.com/assessing-left-ventricular-ejection…
I found the echocardiography textbook. Let me read the relevant sections.
Finding Sources
Finding Sources
Let me read the key sections from the echocardiography textbook and Braunwald's on EF.
Reading File
Reading File
Reading File
Excellent! I have very rich content. Let me also fetch the relevant echo images and read a bit more from the echocardiography textbook block.
Reading File
Finding Sources
Reading File
Loading Image
I now have comprehensive content. Let me compile the complete, well-organized answer.
Ejection Fraction (EF) Calculation in Echocardiography - All Methods (Easiest to Hardest)
What is EF?
EF (%) = (EDV - ESV) / EDV × 100
Where EDV = End-Diastolic Volume, ESV = End-Systolic Volume. Normal EF is 55-69%.
Methods Ranked: Easiest → Most Accurate
1. Visual (Eyeball) Estimation - THE EASIEST
This is the fastest and most widely used bedside method, requiring no measurements or calculations.
How to do it:
- Use the Parasternal Short Axis (PSAX) or Apical 4-Chamber (A4C) view
- Simply watch the LV walls contract and observe:
| What you see | EF estimate |
|---|---|
| Walls almost touch / hyperdynamic | >70% (Hyperdynamic) |
| Walls move well with good thickening | 55-69% (Normal) |
| Walls move but slightly reduced | 45-54% (Mildly reduced) |
| Walls barely move | 30-44% (Moderately reduced) |
| Walls almost no movement | <30% (Severely reduced) |
The trick - 3 key things to observe:
- Wall thickening - walls should thicken AND move inward by at least 1/3 during systole
- Chamber size change - LV should clearly get smaller in systole vs. diastole
- Anterior mitral leaflet - in normal hearts, it nearly touches the interventricular septum with each beat. If EF is low, it opens less (increased E-point Septal Separation = EPSS)
"Qualitative estimation or 'eyeballing' the ejection fraction is done by observing wall motion and comparison of the chamber size between systole and diastole. In general, the walls should approximate by one-third or more." - Comprehensive Clinical Nephrology, 7th Edition
Accuracy: Correlates r = 0.91-0.94 with Simpson's method when done by experienced sonographers.
2. EPSS (E-Point Septal Separation) - EASIEST NUMERIC METHOD
A single M-mode measurement that gives you a quick estimate of EF without tracing volumes.
How to do it:
- Open M-mode at the level of the mitral valve tips in the Parasternal Long Axis (PLAX) view
- Measure the distance between the E-point (peak of anterior mitral leaflet in early diastole) and the interventricular septum
Interpretation:
- EPSS < 7 mm = Normal EF (≥50%)
- EPSS > 7 mm = Significant LV dysfunction (EF < 30%)
- The larger the EPSS, the lower the EF
"The distance between the peak of mitral valve tracing during early passive diastolic filling (E-point) and interventricular septum of greater than 7 mm is generally considered as a marker of significant LV systolic dysfunction (LVEF <30%). This is called E-point septal separation (EPSS)." - Comprehensive Clinical Nephrology, 7th Ed
3. Teichholz Method (M-mode) - EASY NUMERIC METHOD
A quick, machine-calculated EF using two simple linear measurements from M-mode.
How to do it:
- In PLAX view, place M-mode cursor perpendicular to the LV just below the mitral valve tips
- Measure:
- LVIDd = LV Internal Diameter in Diastole (measured at R-wave onset)
- LVIDs = LV Internal Diameter in Systole (measured at minimum LV size)
- The machine automatically calculates EF using the Teichholz formula:
Volume = [7 / (2.4 + D)] × D³
Then: EF = (EDV - ESV) / EDV × 100
You don't need to manually calculate - just enter the two measurements and the machine does it.
Normal reference ranges for LV dimensions:
| Measurement | Normal |
|---|---|
| LVIDd | 3.9-5.3 cm (women) / 4.2-5.8 cm (men) |
| LVIDs | 2.1-3.5 cm |
| FS (Fractional Shortening) | 25-43% (men), 27-45% (women) |
"Ventricular volumes (EDV and ESV) calculated from ventricular dimensions (LVIDd and LVIDs, respectively), using the formula of Teicholz: Volume = 7/(2.4+D) × D³" - Pfenninger and Fowler's Procedures for Primary Care
Limitations:
- Assumes the LV is a perfect geometric shape (prolate ellipsoid)
- Inaccurate in regional wall motion abnormalities (e.g., MI) - it only samples one dimension
- Not reliable in dilated or distorted LVs
4. Fractional Shortening (FS) - SIMPLE SURROGATE
Not technically EF, but a quick approximation from the same M-mode measurements.
FS (%) = (LVIDd - LVIDs) / LVIDd × 100
- Normal FS: 25-43% (roughly corresponds to EF of 55-70%)
- Easy to calculate mentally once you have the two diameters
5. Biplane Simpson's Method (Method of Discs) - GOLD STANDARD
This is the most accurate but requires more time and skill.
How to do it:
- Get Apical 4-Chamber (A4C) view - freeze at end-diastole (largest LV), trace the endocardium
- Freeze at end-systole (smallest LV), trace again
- Repeat in Apical 2-Chamber (A2C) view (same steps)
- Machine divides the LV into 20 equal discs and sums their volumes to calculate EDV and ESV
- EF = (EDV - ESV) / EDV × 100
EF classification (ASE/ESC guidelines):
| Category | EF |
|---|---|
| Hyperdynamic | >70% |
| Normal | 55-69% |
| Mildly reduced | 45-54% |
| Moderately reduced | 30-44% |
| Severely reduced | <30% |
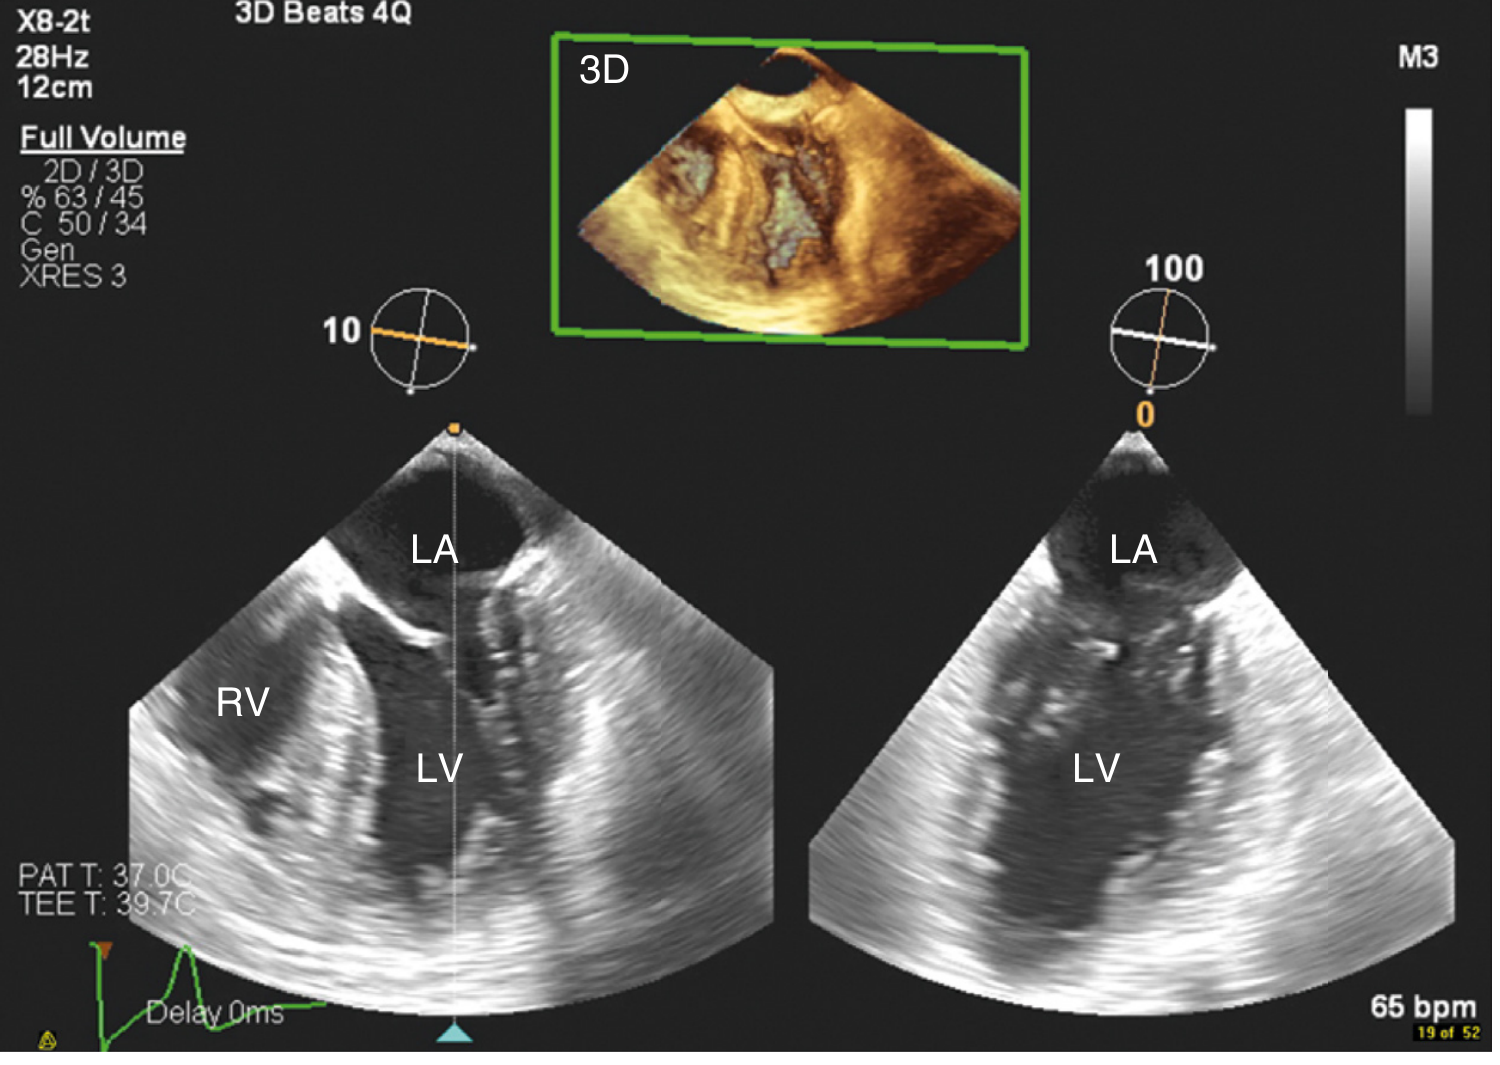
Biplane imaging of the left ventricle showing 4-chamber and 2-chamber views used for Simpson's volumetric EF calculation (Textbook of Clinical Echocardiography)
Limitations:
- Requires good apical image quality (avoid foreshortening!)
- Operator-dependent endocardial tracing - do NOT include papillary muscles in the trace
- Arrhythmias make it difficult to identify true end-systole vs end-diastole
- The most accurate when image quality is good
Quick Summary Table
| Method | Ease | Time | Equipment | Accuracy | Best used when |
|---|---|---|---|---|---|
| Visual (Eyeball) | ⭐⭐⭐⭐⭐ Easiest | Seconds | Any echo view | Good (r=0.91) | Bedside screening, rapid assessment |
| EPSS | ⭐⭐⭐⭐ Very Easy | <1 min | M-mode | Good for severe dysfunction | Quickly ruling out severe LV dysfunction |
| Teichholz | ⭐⭐⭐ Easy | 1-2 min | M-mode | Moderate | Regular LV geometry, no wall motion abnormality |
| Fractional Shortening | ⭐⭐⭐ Easy | <1 min | M-mode | Surrogate only | Quick screening |
| Biplane Simpson's | ⭐⭐ Complex | 3-5 min | Apical views | Best (Gold standard) | Formal reports, follow-up, clinical decisions |
Practical Tip for Beginners
Start with the visual method - train yourself to call EF as:
- Normal (~60%)
- Mildly reduced (~45%)
- Moderately reduced (~35%)
- Severely reduced (~20%)
Studies from the Arizona Heart Institute show that experienced sonographers can estimate EF qualitatively (normal 60%, moderate impairment 40%, severe impairment 20%) with high accuracy that rivals quantitative methods. Once comfortable, move to Simpson's for formal reporting.
Sources: Comprehensive Clinical Nephrology 7th Ed | Pfenninger and Fowler's Procedures for Primary Care | Textbook of Clinical Echocardiography | POCUS 101
This is a shared conversation. Sign in to Orris to start your own chat.