
Describe pulmonary function tests and use of spirometry in clinical medicine
I'll start by reading the medical library skill, then search for comprehensive information on pulmonary function tests and spirometry.
Reading File
Now let me search the library database for pulmonary function tests and spirometry content in parallel:
Finding Sources
Finding Sources
Finding Sources
Finding Sources
Excellent - rich sources found. Let me read the most authoritative sections in parallel - Murray & Nadel's (the premier respiratory textbook) and the Family Medicine textbook:
Reading File
Reading File
Good - rich content. Let me read the detailed forced spirometry section and the clinical interpretation section in parallel:
Reading File
Reading File
Let me now read the clinical interpretation section from block15 (the interpretation chapter) and the Goldman-Cecil section:
Reading File
Reading File
Excellent content. Let me now read more from Goldman-Cecil (block10) and the clinical interpretation chapter from Murray & Nadel (block15 around line 1497):
Reading File
Reading File
Excellent content. Now let me read the lung volumes section and DLCO section from Murray & Nadel, and also fetch key flow-volume curve images:
Finding Sources
Loading Image
Now let me fetch the lung volumes/capacities diagram and the flow-volume loop patterns image, and read the DLCO/diffusion capacity section:
Loading Image
Finding Sources
Let me now read the DLCO section and the full Goldman-Cecil PFT section in parallel:
Reading File
Reading File
Excellent - I have the PFT interpretation algorithm. Let me fetch the key algorithm image and also read the bronchodilator responsiveness and lung volumes measurement sections:
Loading Image
Reading File
I now have very comprehensive content from the textbooks. Let me read a bit more about the lung volumes measurement methods and the DLCO measurement details:
Reading File
I now have comprehensive content from multiple authoritative textbooks. Let me fetch the lung volumes diagram and then compile the full answer:
Loading Image
I now have everything I need for a comprehensive, well-illustrated answer. Let me compose it.
Pulmonary Function Tests and Spirometry in Clinical Medicine
Overview
Pulmonary function tests (PFTs) permit accurate, reproducible assessment of the functional state of the respiratory system. Importantly, PFTs do not diagnose specific diseases on their own - different diseases cause different patterns of abnormality across a battery of tests, allowing clinicians to quantify severity, detect disease early, characterize natural history, and monitor response to treatment. Accuracy of interpretation depends on a thorough knowledge of the physiologic basis of each test, properly validated equipment, and standardized protocols.
- Murray & Nadel's Textbook of Respiratory Medicine, p. 704
The Components of a Full PFT Battery
Lung Volume Partitions
Understanding PFTs begins with lung volumes:
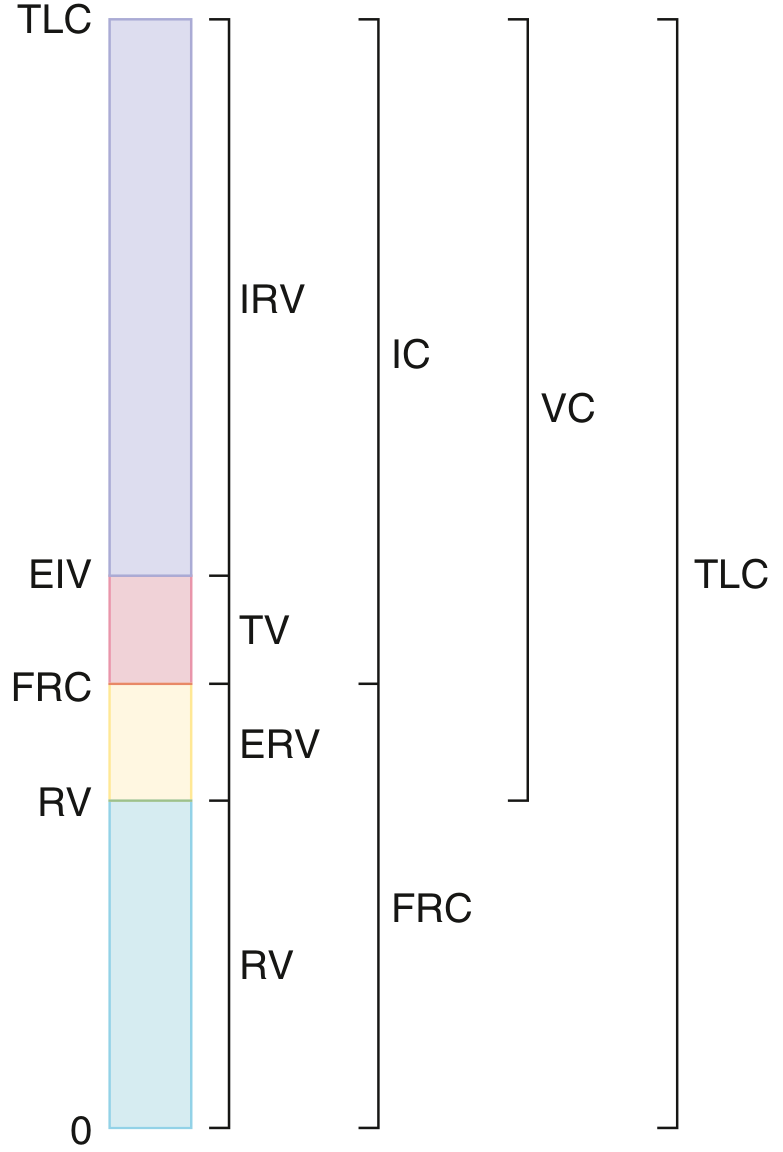
Lung volume partitions: IRV = inspiratory reserve volume; TV = tidal volume; ERV = expiratory reserve volume; RV = residual volume; IC = inspiratory capacity; FRC = functional residual capacity; VC = vital capacity; TLC = total lung capacity. - Goldman-Cecil Medicine, p. 867
| Term | Definition |
|---|---|
| TLC | Total lung capacity - volume at end of maximal inspiration |
| FRC | Functional residual capacity - resting lung volume where elastic recoil forces are balanced |
| RV | Residual volume - gas remaining after maximal exhalation |
| ERV | Expiratory reserve volume = FRC - RV |
| IC | Inspiratory capacity - volume inspired from FRC to TLC |
| VC | Vital capacity = IRV + TV + ERV |
Three volumes (TV, IRV, ERV) can be measured with a simple spirometer. Measurement of RV, FRC, or TLC requires more sophisticated methods: body plethysmography, inert gas dilution, or the nitrogen washout technique.
- Goldman-Cecil Medicine, p. 866
Spirometry
What It Measures
Spirometry is the measurement of the volume of air inhaled or exhaled. It is commonly performed with a pneumotachometer that measures airflow and integrates it to obtain volume during a series of ventilatory maneuvers. The simplest and most commonly performed PFT, spirometry measures:
-
FVC (Forced Vital Capacity): the total volume of air forcefully expelled from TLC down to RV
-
FEV₁ (Forced Expiratory Volume in 1 second): volume expelled in the first second
-
FEV₁/FVC ratio: the fraction of the total exhaled volume expelled in 1 second
-
FEF₂₅₋₇₅ (Forced Expiratory Flow at 25-75% of FVC): a mid-expiratory flow measure, more sensitive for small airway disease but with poor reproducibility
-
MVV (Maximal Voluntary Ventilation): maximal ventilation over a timed period, estimates ventilatory reserve
-
Goldman-Cecil Medicine, p. 865
The Physiology of Forced Expiration
The first 25-30% of a maximal expiratory maneuver is effort-dependent. Beyond this, flow becomes effort-independent due to dynamic airway compression at the equal pressure point (EPP) - the point along the airway where intraluminal pressure equals pleural pressure. Increasing expiratory effort beyond this point merely compresses airways further without increasing flow. This is why the FEV₁ and the descending limb of the flow-volume curve are reproducible and reliable:
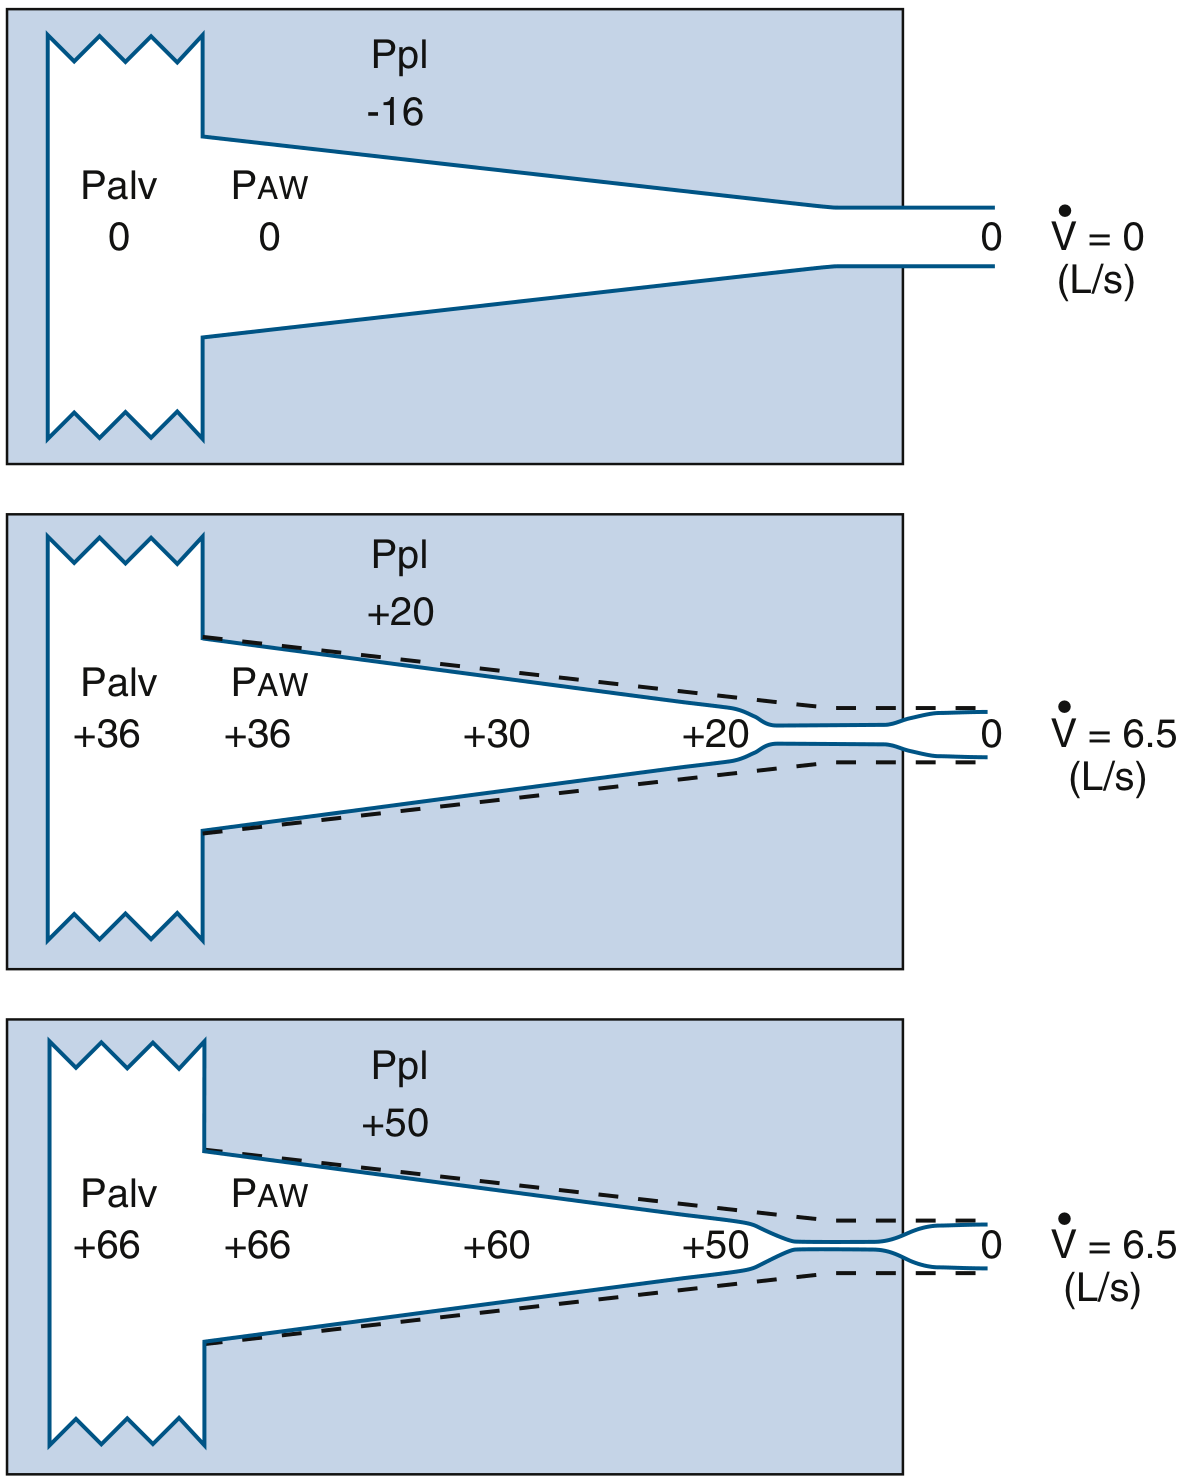
Equal pressure point model: Increased expiratory effort (bottom panel) only compresses airways more; maximum flow (6.5 L/s) remains the same as in the middle panel. - Murray & Nadel's, p. 704
The Two Graphical Displays
Results can be displayed as:
- Volume-time curve (spirogram): shows exhaled volume on the y-axis vs. time on x-axis. A prolonged expiratory time indicates obstruction.
- Flow-volume loop: plots expiratory and inspiratory flow at each lung volume. The shape of this curve is highly informative.
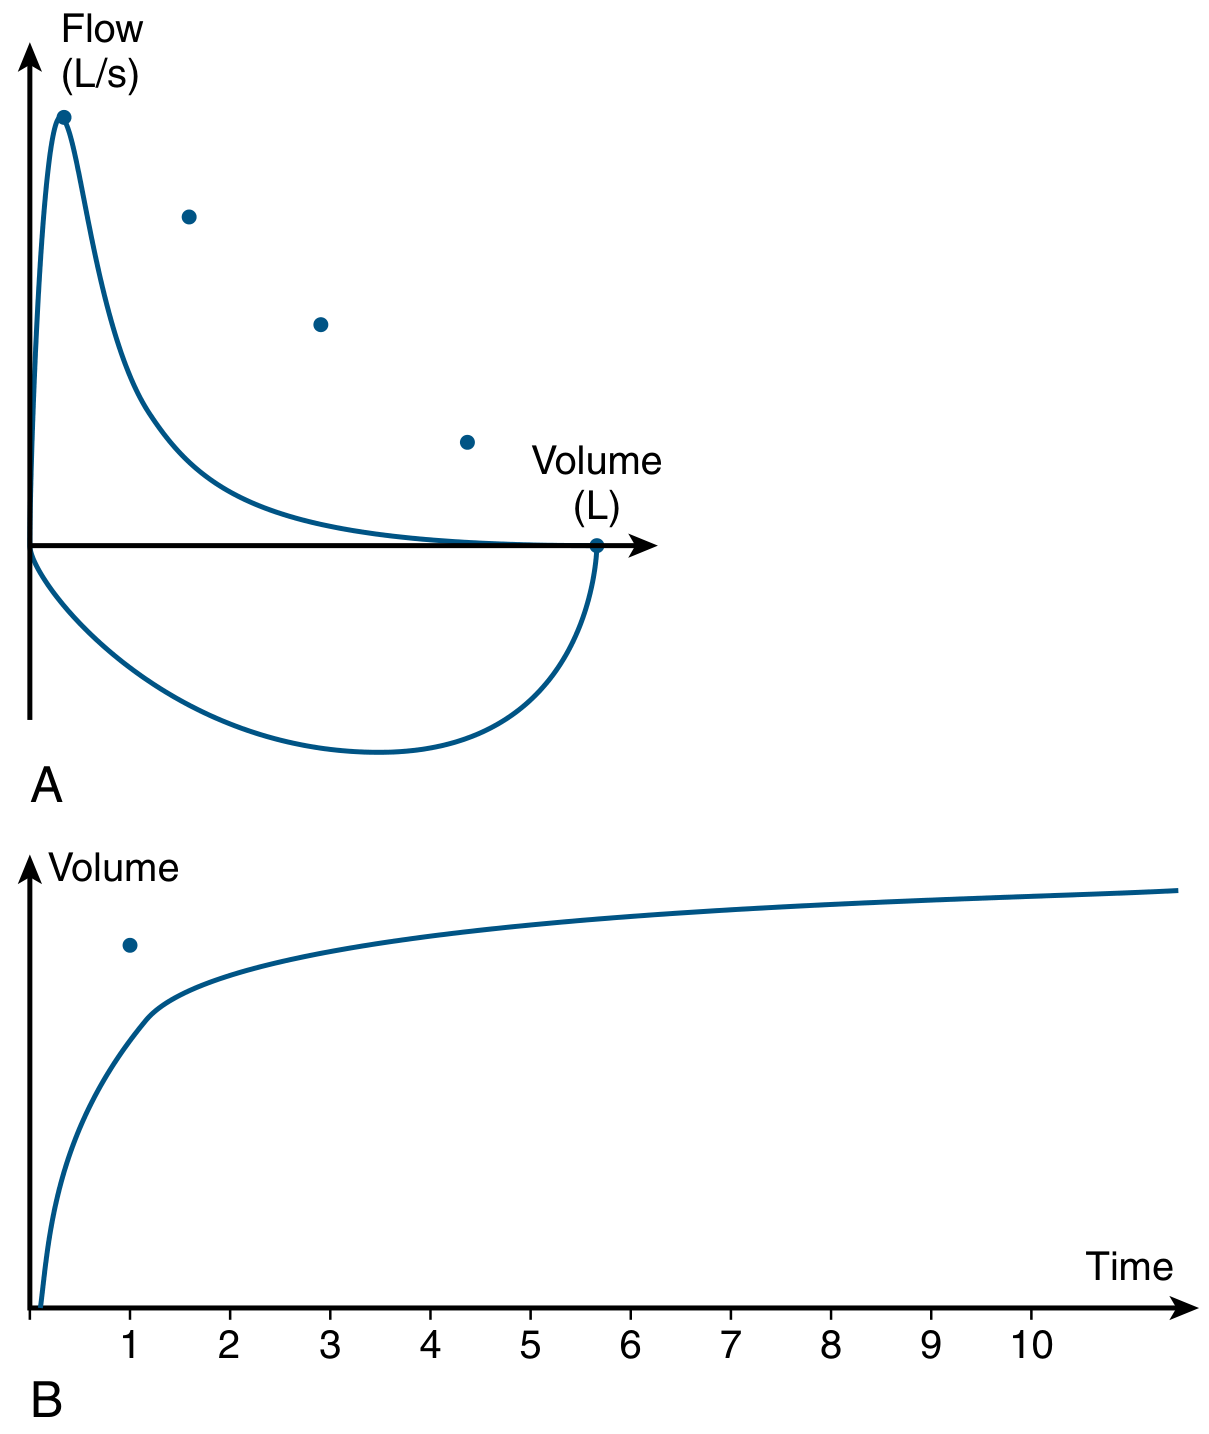
COPD flow-volume loop (A): concave expiratory limb with flow falling below predicted (dots) at all lung volumes. Volume-time curve (B): prolonged expiratory time, with predicted FEV₁ shown as a dot. - Murray & Nadel's, p. 1471
Interpreting Spirometry: Obstructive vs. Restrictive Patterns
Obstructive Pattern
- FEV₁/FVC ratio reduced (< 0.70 by GOLD criteria, or below the fifth percentile lower limit of normal by ATS/ERS)
- FEV₁ reduced out of proportion to FVC
- Flow-volume curve shows a concave (scooped-out) expiratory limb
- Diseases: COPD, asthma, bronchiectasis, cystic fibrosis
A fixed low ratio (post-bronchodilator) is consistent with COPD. In asthma, the ratio may vary between exacerbations and return to normal. The GOLD criteria (fixed ratio < 0.70) has the advantage of simplicity but can overdiagnose obstruction in older subjects because FEV₁/FVC naturally declines with age. ATS/ERS prefers the lower limit of normal approach for this reason.
Restrictive Pattern
- FEV₁/FVC ratio normal or elevated
- Both FEV₁ and FVC reduced
- TLC reduced (confirmed by body plethysmography - required to formally diagnose restriction)
- Diseases: interstitial lung disease, chest wall deformity, neuromuscular weakness, pleural disease, obesity
Note: Low FVC with normal FEV₁/FVC on spirometry alone does not confirm restriction - a normal TLC in this setting gives the "nonspecific pattern."
Mixed Pattern
-
Both a reduced FEV₁/FVC ratio AND reduced TLC
-
Goldman-Cecil Medicine, p. 865-868; Murray & Nadel's, p. 1500-1501
Bronchodilator Responsiveness
Spirometry is routinely performed before and after inhaled bronchodilator (typically albuterol/salbutamol 400 mcg, ipratropium, or both). A significant bronchodilator response is defined as:
Improvement in FEV₁ or FVC of ≥ 12% AND ≥ 200 mL above baseline
A positive response suggests reversible airflow obstruction and is consistent with (but not diagnostic of) asthma. The response is generally greater in asthma and less in COPD, but varies considerably between individuals. Notably, lack of acute bronchodilator response does not predict lack of clinical benefit from long-term bronchodilator therapy.
Before testing, patients should withhold LABAs for ≥12 hours and short-acting bronchodilators for ≥6 hours.
- Murray & Nadel's (Asthma chapter), p. 229; Goldman-Cecil Medicine, p. 866
Severity Grading of Obstruction (GOLD System)
| Stage | FEV₁ % Predicted | Severity |
|---|---|---|
| GOLD 1 | ≥ 80% | Mild |
| GOLD 2 | 50-79% | Moderate |
| GOLD 3 | 30-49% | Severe |
| GOLD 4 | < 30% | Very severe |
Modern COPD staging (updated GOLD guidelines) also incorporates symptom burden (mMRC, CAT score) and exacerbation history alongside spirometric severity.
Diffusing Capacity (DLCO)
The single-breath diffusing capacity for carbon monoxide (DLCO), also called the transfer factor or TLCO, measures the capacity of the lungs to exchange gas. It collectively reflects all factors affecting diffusion across the alveolar-capillary membrane: the surface area available, membrane thickness, capillary blood volume, and ventilation-perfusion homogeneity.
Clinical interpretation of DLCO:
| DLCO Result | Common Causes |
|---|---|
| Reduced | Emphysema, interstitial lung disease, pulmonary vascular disease (e.g., pulmonary hypertension), combined pulmonary fibrosis-emphysema |
| Normal/elevated | Asthma (elevated due to increased upper zone perfusion and large lung volumes), polycythemia, pulmonary hemorrhage |
-
In obstructive disease: low DLCO suggests emphysema or parenchymal/vascular disease; normal DLCO more likely suggests asthma or chronic bronchitis
-
In restrictive disease: low DLCO suggests parenchymal (interstitial) cause; normal DLCO suggests chest wall or neuromuscular limitation
-
An isolated low DLCO with normal spirometry and TLC should prompt consideration of pulmonary vascular disease
-
Goldman-Cecil Medicine, p. 868
Body Plethysmography and Lung Volume Measurement
Body plethysmography is the preferred (most accurate) method for measuring absolute lung volumes (especially FRC and TLC). Based on Boyle's law (P₁ × V₁ = P₂ × V₂), the patient sits in a sealed box and pants against a closed shutter. Changes in box pressure and mouth pressure allow calculation of thoracic gas volume. It is particularly valuable in patients with airway obstruction, where helium dilution tends to underestimate TLC by failing to equilibrate into poorly communicating air spaces (gas trapping).
Inert gas dilution (helium, neon) and nitrogen washout are alternative methods. These measure only communicating air spaces and will underestimate TLC when air trapping is significant.
- Goldman-Cecil Medicine, p. 867
The Flow-Volume Curve: Pattern Recognition
The shape of the flow-volume loop provides pattern recognition for many specific disorders:
| Pattern | Appearance | Examples |
|---|---|---|
| Normal | Smooth convex expiratory limb | - |
| Obstructive | Concave (scooped) expiratory limb | COPD, asthma |
| Restrictive | Normal shape but smaller overall TLC | ILD, obesity, NMD |
| Variable extrathoracic obstruction | Inspiratory limb flattened | Vocal cord dysfunction, tracheal stenosis (extrathoracic) |
| Variable intrathoracic obstruction | Expiratory limb flattened | Tracheomalacia, relapsing polychondritis |
| Fixed central obstruction | Both limbs flattened (box-shaped) | Fixed tracheal stenosis |
| Neuromuscular weakness | Reduced peak flow, normal shape | Myopathy, MND |
| Sawtooth pattern | Oscillatory irregular flow | Obstructive sleep apnea |
- Goldman-Cecil Medicine, p. 867 (Figure 73.3 caption)
The PFT Interpretation Algorithm
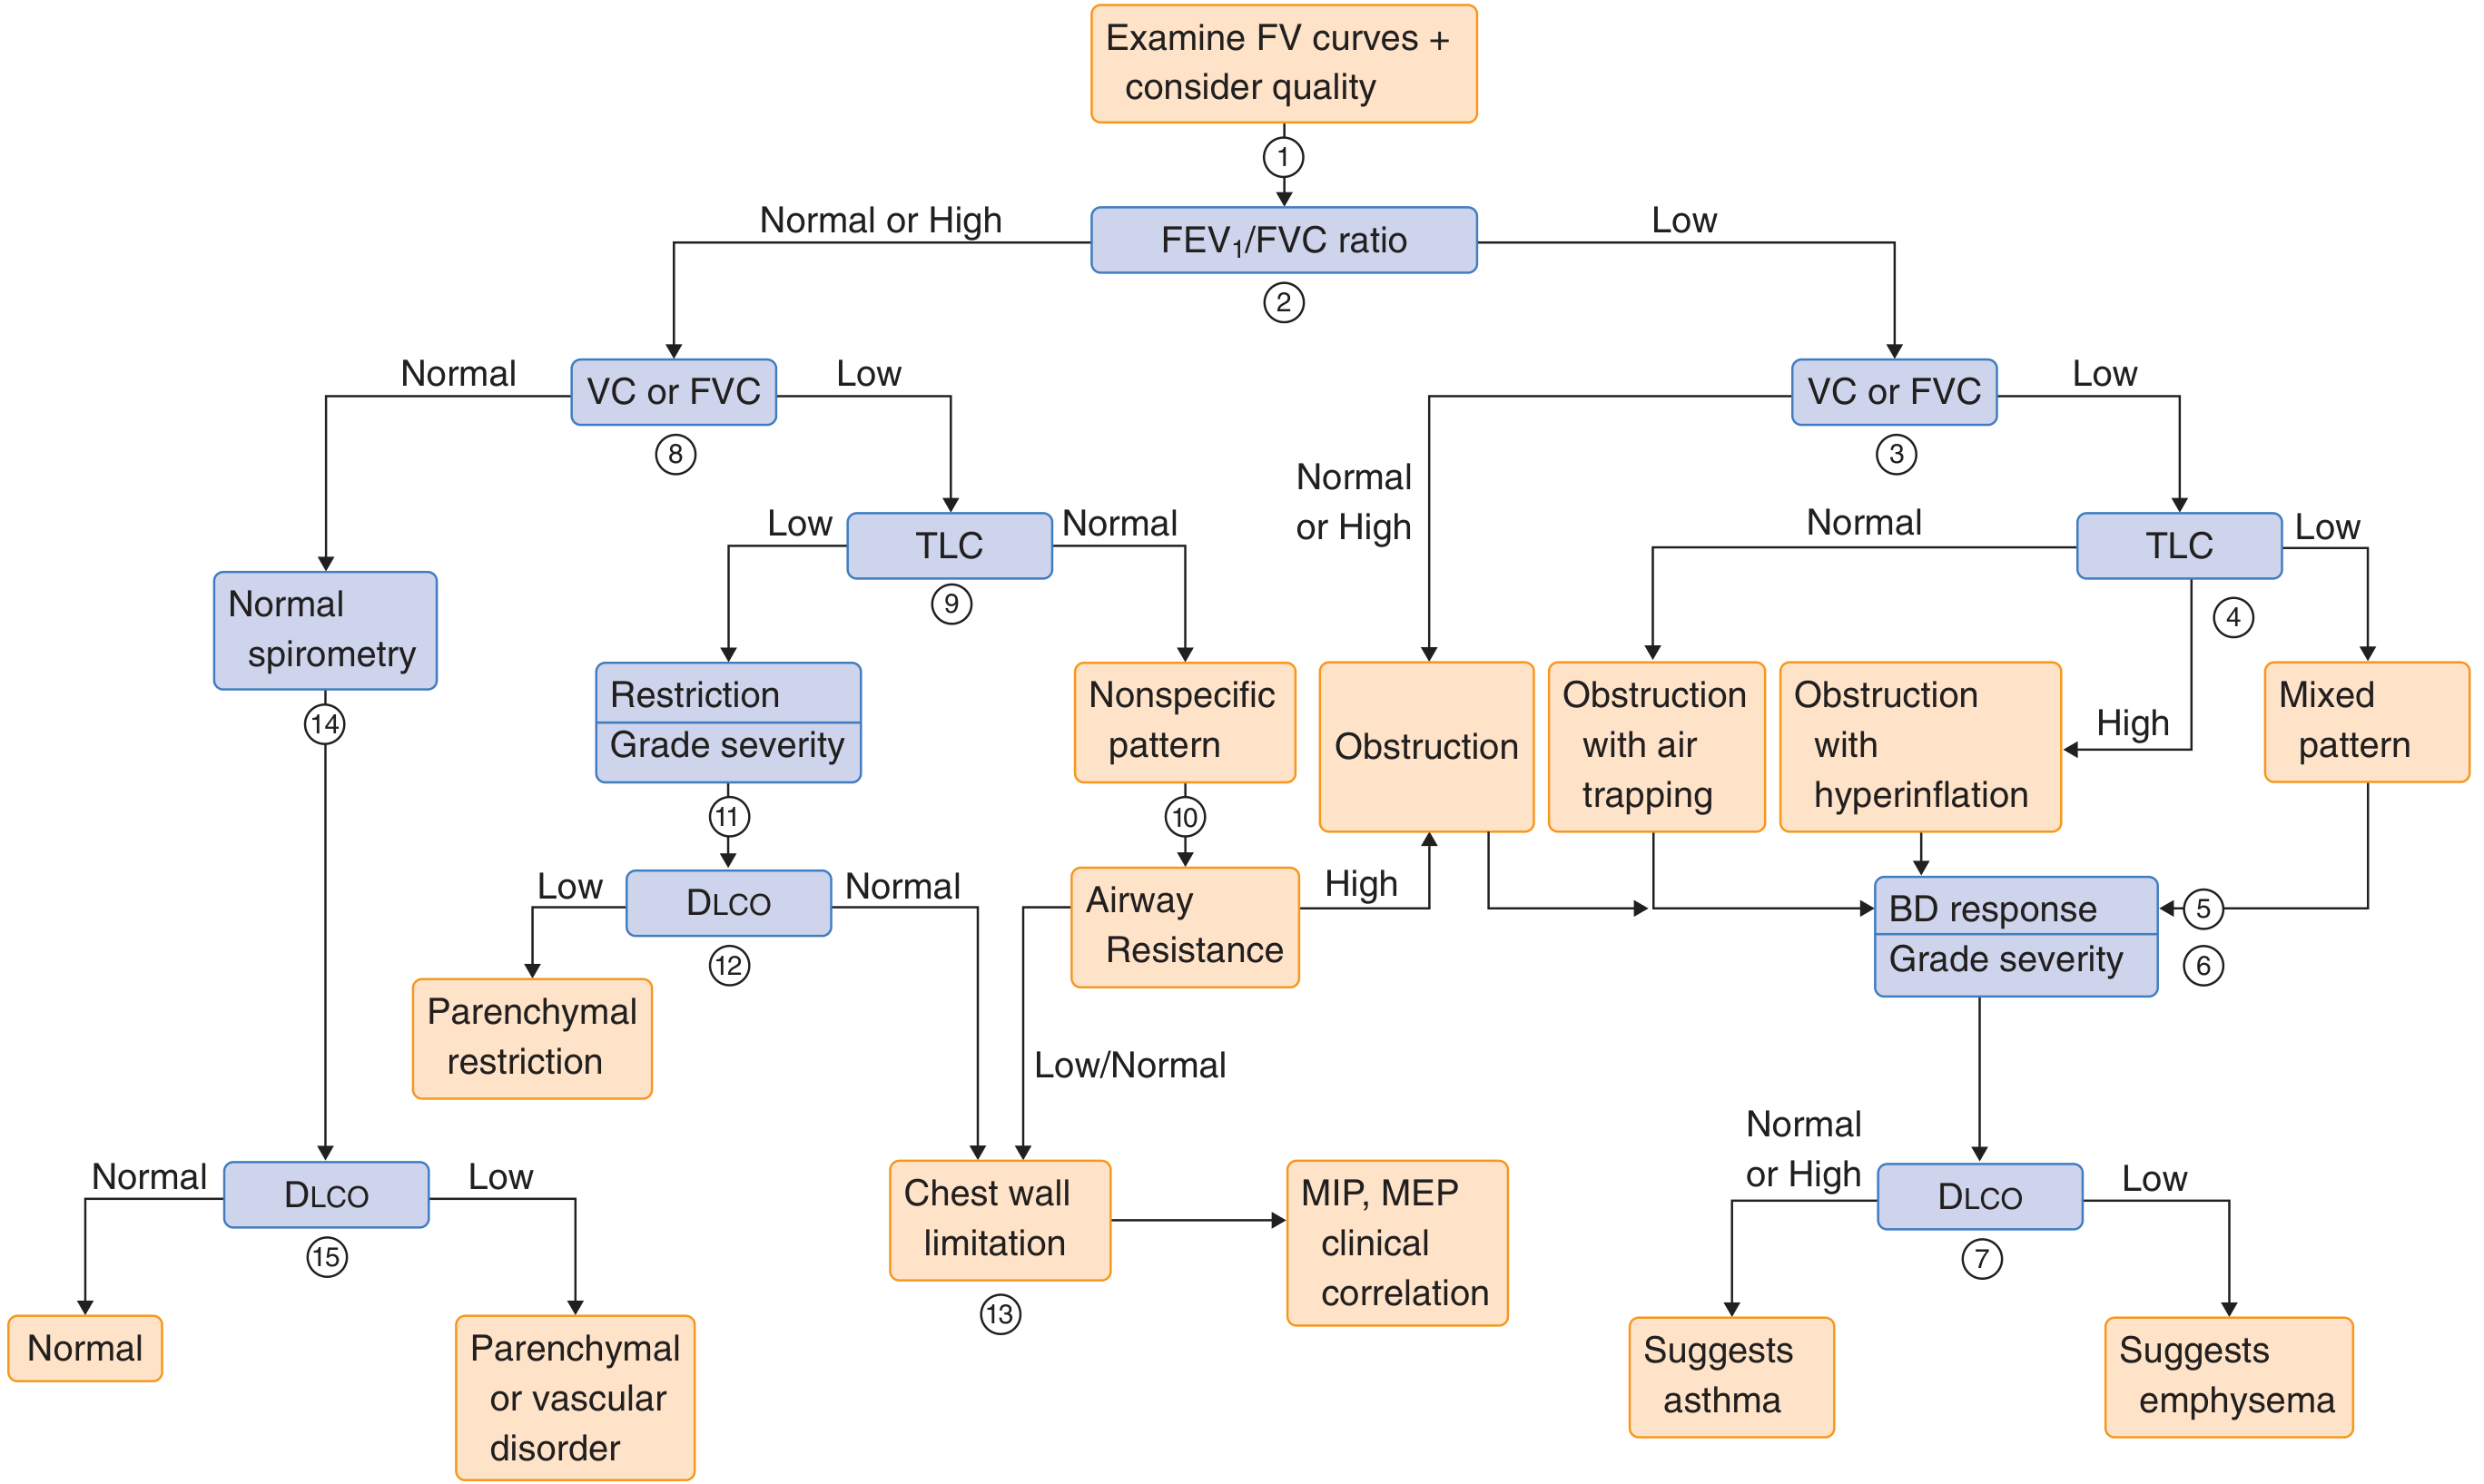
Systematic algorithm for PFT interpretation. Begin by examining the flow-volume curve and FEV₁/FVC ratio, then proceed through TLC, DLCO, bronchodilator response, and airway resistance as needed. - Goldman-Cecil Medicine, p. 868
The algorithm proceeds as follows:
- Inspect the flow-volume curve for quality and shape
- FEV₁/FVC ratio: if low → obstructive pathway; if normal/high → restrictive pathway
- Obstructive pathway: assess FVC → if low, measure TLC (distinguish simple obstruction, obstruction with air trapping/hyperinflation, or mixed pattern) → assess bronchodilator response → grade severity → use DLCO to differentiate asthma vs. emphysema
- Restrictive pathway: measure TLC → if low, restriction confirmed → assess DLCO (low = parenchymal; normal = chest wall/NMD) → measure MIP/MEP if neuromuscular disease suspected
- Nonspecific pattern: normal FEV₁/FVC + low FVC + normal TLC; possible causes include small airways disease, early restriction, or obesity
Other PFTs
Maximal Voluntary Ventilation (MVV)
Maximal ventilation achievable, expressed in L/min. Reduced in central airway obstruction, muscle weakness, and poor effort. Because effort-dependent, may be a better predictor of postoperative respiratory complications than FEV₁ alone.
Bronchial Provocation Testing (Methacholine Challenge)
Used when spirometry is normal but asthma is suspected. Nebulized methacholine is inhaled in doubling concentrations until FEV₁ falls by ≥20% (PC₂₀). Thresholds:
- PC₂₀ < 1 mg/mL: severe airway hyperresponsiveness
- PC₂₀ < 4 mg/mL: moderate AHR
- PC₂₀ < 16 mg/mL: mild AHR
Impulse Oscillometry (IOS)
A non-effort-dependent technique superimposing sound waves on tidal breathing. Measures resistance at 5 Hz (R5, peripheral airways) and 20 Hz (R20, central airways) and reactance (X5). Useful in children, elderly, or those unable to perform forced maneuvers. Can detect small airway disease before spirometric abnormalities appear.
- Murray & Nadel's (Asthma chapter), p. 241-244
Arterial Blood Gas (ABG)
Complements PFTs by directly measuring:
- PaO₂: partial pressure of oxygen
- PaCO₂: partial pressure of CO₂ (reflects ventilatory adequacy)
- pH: acid-base status
Normal arterial pH range is 7.35-7.45.
Clinical Indications for Spirometry
According to Goldman-Cecil Medicine, spirometry is recommended for:
- Diagnosis of respiratory symptoms (cough, dyspnea, wheeze)
- Monitoring response to therapeutic interventions or potentially harmful drug/occupational exposures
- Quantifying physiologic impairment objectively
- Disability evaluations
- Preemployment and lung health monitoring in at-risk occupations
- Preoperative assessment (in conjunction with MVV)
Spirometry as a screening test in asymptomatic smokers is not strongly recommended - evidence shows that an abnormal result does not improve smoking cessation rates, and a normal result may be falsely reassuring.
- Goldman-Cecil Medicine, p. 865
Quality Assurance
The FVC, FEV₁, FEV₁/FVC ratio, and flow-volume curve shape are highly reproducible with a properly trained technician and modern spirometry equipment. However:
- Poor-quality tests are biased toward lower values, giving false impressions of disease
- Poor performance often shows a delayed peak flow or cough within the first second on the flow-volume curve
- ATS criteria require at least 3 acceptable maneuvers with the two best FVC values within 150 mL of each other
The PFT laboratory should have a medical director overseeing quality. The ATS Pulmonary Function Laboratory Manual provides detailed protocols and standards.
Reference Equations and Predicted Values
Predicted values for lung function vary with height, age, sex, and socioeconomic/environmental factors affecting lung development. The Global Lung Function Initiative (GLI) has published race-neutral reference equations (replacing earlier race-specific adjustments) to avoid systematic underestimation in certain populations. Results are expressed as percentage predicted or - more rigorously - as the z-score relative to the lower limit of normal (LLN), defined as the 5th percentile of the reference population.
Summary Table
| Test | Measures | Clinical Use |
|---|---|---|
| FVC | Total forced exhaled volume | Detects restriction (if low with normal ratio) |
| FEV₁ | Volume in first second | Grades obstruction severity |
| FEV₁/FVC | Ratio | Distinguishes obstruction vs. restriction |
| FEF₂₅₋₇₅ | Mid-expiratory flow | Small airway disease marker (poor reproducibility) |
| MVV | Max ventilatory capacity | Preoperative risk, NMD |
| TLC / FRC / RV | Absolute volumes | Confirm restriction, quantify hyperinflation |
| DLCO | Gas transfer capacity | Emphysema, ILD, pulmonary vascular disease |
| Methacholine PC₂₀ | Airway hyperresponsiveness | Asthma diagnosis when spirometry normal |
| IOS (R5, X5) | Airway resistance/reactance | Small airway disease, non-effort-dependent |
| ABG | Gas exchange, ventilation | Hypoxemia, hypercapnia, acid-base disorders |
Sources:
- Murray & Nadel's Textbook of Respiratory Medicine, 7th ed., Chapters 31-32 (PFTs: Physiologic and Technical Principles; Clinical Interpretation)
- Goldman-Cecil Medicine, International Edition, Chapter 73 (Pulmonary Function Testing)
- Murray & Nadel's Textbook of Respiratory Medicine - Asthma chapter (Chapter 64), including COPD spirometric criteria and GOLD staging
This is a shared conversation. Sign in to Orris to start your own chat.