Here are your complete, exam-oriented Respiratory System Physiology Notes based on GK Pal's approach (aligned with Costanzo, Ganong, and Guyton - all standard Indian physiology exam references):
🫁 RESPIRATORY SYSTEM PHYSIOLOGY - COMPLETE EXAM NOTES
Based on GK Pal Physiology | Exam-Oriented
TOPIC 1: STRUCTURE OF THE RESPIRATORY SYSTEM
Zones of the Respiratory System
| Zone | Structures | Function |
|---|
| Conducting Zone | Nose, nasopharynx, larynx, trachea, bronchi, bronchioles, terminal bronchioles | Warm, humidify, filter air. NO gas exchange |
| Respiratory Zone | Respiratory bronchioles, alveolar ducts, alveolar sacs | Site of actual gas exchange |
Key Points on Airways
- Trachea = 0th generation; divides into 23 generations total
- Conducting airways lined with mucus-secreting + ciliated cells (mucociliary escalator)
- Airways contain smooth muscle with dual autonomic innervation:
- Sympathetic (β2 receptors) → Bronchodilation (epinephrine, albuterol)
- Parasympathetic (muscarinic M3 receptors) → Bronchoconstriction
Alveoli
- ~300 million alveoli; total surface area ~70 m² (like a tennis court)
- Two cell types:
- Type I pneumocytes - flat, gas exchange
- Type II pneumocytes - cuboidal, secrete surfactant
TOPIC 2: LUNG VOLUMES AND CAPACITIES ⭐ (Most Important for Exams)
Four Basic Lung Volumes (Cannot be subdivided)
| Volume | Abbreviation | Normal Value | Definition |
|---|
| Tidal Volume | TV (VT) | 500 mL | Air breathed in/out per normal breath |
| Inspiratory Reserve Volume | IRV | 3000 mL | Extra air inspired after normal inspiration |
| Expiratory Reserve Volume | ERV | 1100 mL | Extra air expired after normal expiration |
| Residual Volume | RV | 1200 mL | Air remaining after maximal expiration |
Key Exam Fact: RV cannot be measured by spirometry. Measured by helium dilution or body plethysmography.
Four Lung Capacities (Combination of volumes)
| Capacity | Formula | Normal Value | Significance |
|---|
| Total Lung Capacity (TLC) | TV + IRV + ERV + RV | 6000 mL | Maximum air lungs can hold |
| Vital Capacity (VC) | TV + IRV + ERV | 4800 mL | Maximum air exhaled after max inspiration |
| Inspiratory Capacity (IC) | TV + IRV | 3500 mL | Max air inhaled from FRC |
| Functional Residual Capacity (FRC) | ERV + RV | 2300 mL | Air remaining after normal expiration = equilibrium point |
FRC is the resting lung volume - where lung elastic recoil inward = chest wall elastic recoil outward. These forces balance each other.
Changes in Restrictive vs Obstructive Disease
| Parameter | Obstructive (Asthma/COPD) | Restrictive (Fibrosis/Sarcoid) |
|---|
| TLC | ↑ or normal | ↓ |
| RV | ↑ (air trapping) | ↓ |
| FRC | ↑ | ↓ |
| VC | ↓ | ↓ |
| FEV1/FVC | < 0.7 (hallmark) | Normal or ↑ |
TOPIC 3: VENTILATION ⭐
Key Equations
Minute Ventilation (VE):
VE = VT × Respiratory Rate = 500 mL × 12/min = 6000 mL/min
Alveolar Ventilation (VA) - The important one!
VA = (VT - Dead Space) × RR = (500 - 150) × 12 = 4200 mL/min
Dead Space = 150 mL (anatomical dead space = conducting zone volume)
Types of Dead Space
| Type | Definition | Value |
|---|
| Anatomical dead space | Volume of conducting airways (no gas exchange occurs) | ~150 mL |
| Physiological dead space | Anatomical + alveolar dead space (includes non-perfused alveoli) | = Anatomical in healthy person |
| Alveolar dead space | Ventilated but not perfused alveoli | ~0 in health; ↑ in PE |
In healthy people: Physiological dead space ≈ Anatomical dead space
In disease (e.g., pulmonary embolism): Physiological > Anatomical
Bohr's Equation (to measure dead space):
VD/VT = (PaCO2 - PeCO2) / PaCO2
Alveolar Gas Equation ⭐ (Exams love this!)
PAO2 = PiO2 - (PACO2 / R)
Where:
- PiO2 = (PB - 47) × 0.21 = (760 - 47) × 0.21 = 149 mm Hg at sea level
- R = respiratory quotient = 0.8 (normal)
- PACO2 ≈ PaCO2 = 40 mm Hg
So: PAO2 = 149 - (40/0.8) = 149 - 50 = ~100 mm Hg
Normal Partial Pressures
| Gas | Inspired Air | Alveolar | Arterial blood | Venous blood | Tissue |
|---|
| PO2 | 159 mmHg | 100 mmHg | 95-100 mmHg | 40 mmHg | 20-40 mmHg |
| PCO2 | 0.3 mmHg | 40 mmHg | 40 mmHg | 46 mmHg | 46+ mmHg |
TOPIC 4: MECHANICS OF BREATHING ⭐
Muscles of Breathing
| Phase | Primary Muscles | Accessory |
|---|
| Quiet Inspiration | Diaphragm (main!), External intercostals | - |
| Forced Inspiration | + Scalenes, SCM, pectoralis minor | - |
| Quiet Expiration | PASSIVE - elastic recoil of lungs | - |
| Forced Expiration | Internal intercostals, abdominal muscles (rectus, obliques) | - |
Key fact: Normal quiet expiration is entirely passive (no muscle work needed).
Compliance
Definition: Change in volume per unit change in pressure
C = ΔV / ΔP (units: mL/cmH2O)
Normal lung compliance = 200 mL/cmH2O
| Condition | Compliance | Example |
|---|
| ↑ Compliance | Lungs are too "floppy" | Emphysema (destruction of elastic tissue) |
| ↓ Compliance | Lungs are stiff | Pulmonary fibrosis, ARDS, pulmonary edema, neonatal RDS (no surfactant) |
Surface Tension and Surfactant ⭐⭐
LaPlace's Law:
P = 2T / r (for alveolus)
Where P = pressure inside, T = surface tension, r = radius
- Without surfactant: Small alveoli would have higher pressure → air would flow to larger alveoli → atelectasis (alveolar collapse)
- Surfactant (dipalmitoyl phosphatidylcholine / DPPC) reduces surface tension, especially in small alveoli
Properties of Surfactant:
- Secreted by Type II pneumocytes
- Main component: Dipalmitoylphosphatidylcholine (DPPC)
- Also contains SP-A, SP-B, SP-C, SP-D (surfactant proteins)
- Reduces surface tension → prevents alveolar collapse
- More effective in small alveoli (more concentrated)
- Appears at 24-28 weeks gestation → fully mature by 35 weeks
- Deficiency = Neonatal Respiratory Distress Syndrome (NRDS/HMD)
- Treatment: Antenatal glucocorticoids (betamethasone) to accelerate lung maturity
Airway Resistance
Formula: R = ΔP / Flow (Ohm's law analogy)
- Main site of airway resistance = medium bronchi (NOT large airways or small airways)
- Small airways contribute little to total resistance because they are numerous and in parallel
Factors affecting airway resistance:
| Factor | Effect on Resistance |
|---|
| ↑ Sympathetic (β2) | ↓ Resistance (bronchodilation) |
| ↑ Parasympathetic | ↑ Resistance (bronchoconstriction) |
| Histamine, leukotrienes | ↑ Resistance |
| ↑ Lung volume | ↓ Resistance (airways pulled open) |
| Mucus/obstruction | ↑ Resistance |
TOPIC 5: GAS EXCHANGE (DIFFUSION) ⭐
Fick's Law of Diffusion
Vx = D × A × ΔP / Δx
Where:
- D = diffusion coefficient (proportional to solubility / √MW)
- A = surface area
- ΔP = partial pressure gradient
- Δx = membrane thickness
Key comparisons:
- CO2 diffuses 20x faster than O2 (because solubility of CO2 is 20x that of O2)
- So CO2 problems are almost always ventilation problems, not diffusion problems
Lung Diffusing Capacity (DL)
- Normal DLco (for CO) = 25 mL/min/mmHg
- ↓ DLco in: emphysema, pulmonary fibrosis, pulmonary embolism, anemia
- ↑ DLco in: polycythemia, supine position, exercise, left-to-right shunts
Diffusion-Limited vs Perfusion-Limited Exchange ⭐
| Type | Mechanism | Examples |
|---|
| Perfusion-limited | Gas equilibrates quickly; exchange limited by blood flow | O2 (normal), CO2, N2O |
| Diffusion-limited | Gas never equilibrates; limited by membrane diffusion | CO, O2 (exercise, fibrosis, altitude) |
O2 is normally perfusion-limited but becomes diffusion-limited in disease or exercise.
TOPIC 6: OXYGEN TRANSPORT ⭐⭐
Two Forms of O2 in Blood
| Form | % of Total | Comments |
|---|
| Dissolved O2 | 2% | Follows Henry's law; only form that creates PO2; ~0.3 mL/100mL at PaO2 100 mmHg |
| O2 bound to Hb | 98% | ~20 mL/100mL; essential for adequate delivery |
O2 Content Formula:
CaO2 = (1.34 × Hb × SaO2) + (0.003 × PaO2)
Normal: (1.34 × 15 × 1.0) + (0.003 × 100) = 20.1 + 0.3 = ~20 mL O2/100 mL blood
O2 Delivery (DO2):
DO2 = Cardiac Output × CaO2 = 5000 × 20 mL/L = 1000 mL/min
Normal O2 consumption (VO2) at rest = 250 mL/min
Hemoglobin Structure
- 4 subunits: each with a heme (iron-porphyrin) + globin chain
- Adult Hb (HbA): α2β2
- HbF: α2γ2 - higher O2 affinity (left shift) → takes O2 from mother's blood
- 1 Hb can carry 4 O2 molecules
- O2-binding capacity = 1.34 mL O2/g Hb (Hüfner's constant)
Hemoglobin Variants
| Variant | Iron State | O2 Binding | Cause |
|---|
| Oxyhemoglobin | Fe²⁺ | YES | Normal |
| Deoxyhemoglobin | Fe²⁺ | NO (ready to bind) | Normal |
| Methemoglobin | Fe³⁺ | NO | Nitrites, sulfonamides, congenital (↓ methemoglobin reductase) |
| Carboxyhemoglobin | Fe²⁺ + CO | NO (CO binds 240x stronger than O2) | CO poisoning |
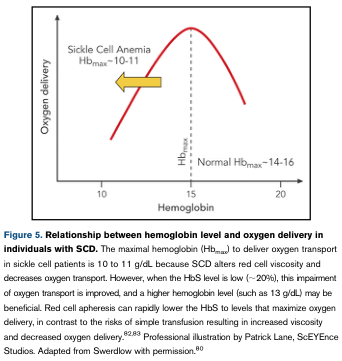
Oxygen-Hemoglobin Dissociation Curve ⭐⭐⭐
- Sigmoidal (S-shaped) due to cooperative binding
- P50 = PO2 at which Hb is 50% saturated = 26-27 mmHg (normal)
Right Shift (↓ affinity, ↑ P50) = O2 unloading to tissues:
↑ Temperature, ↑ PCO2, ↑ H⁺ (↓ pH), ↑ 2,3-DPG, ↑ altitude (chronic)
Mnemonic: CADET, face RIGHT (CO2, Acid/H⁺, DPG, Exercise, Temperature)
Left Shift (↑ affinity, ↓ P50) = O2 loading in lungs:
↓ Temperature, ↓ PCO2, ↓ H⁺ (↑ pH), ↓ 2,3-DPG, HbF, CO, Methemoglobin
Bohr Effect: ↑ CO2 and ↑ H⁺ causes right shift (tissues produce CO2/H⁺ → favors O2 unloading)
2,3-DPG:
- Produced in RBCs (glycolysis byproduct)
- Binds to β chains of deoxy-Hb → stabilizes deoxy form → right shift
- ↑ in: anemia, high altitude, chronic hypoxia
- ↓ in: stored blood (banked blood) - important in massive transfusion!
Cyanosis
- Appears when deoxy-Hb > 5 g/dL in capillary blood
- Central cyanosis = arterial desaturation
- Peripheral cyanosis = ↑ O2 extraction at periphery (vasoconstriction, heart failure)
TOPIC 7: CARBON DIOXIDE TRANSPORT ⭐
Three Forms of CO2 in Blood
| Form | % of Total | Location |
|---|
| Dissolved CO2 | 5% | Plasma; solubility = 0.07 mL/100mL/mmHg |
| Carbaminohemoglobin | 5% | CO2 + amino groups on Hb/proteins |
| Bicarbonate (HCO3-) | 90% | Inside RBCs → plasma (most important!) |
HCO3- Formation (Chloride Shift) ⭐⭐
In tissues:
CO2 + H2O → H2CO3 → H⁺ + HCO3⁻
- Catalyzed by carbonic anhydrase (CA) inside RBCs
- HCO3⁻ exits RBC in exchange for Cl⁻ entering → Hamburger shift / Chloride shift
- H⁺ is buffered by Hb
In lungs: The process reverses - HCO3⁻ + H⁺ → CO2 → exhaled
Haldane Effect: Deoxygenation of Hb increases CO2 carrying capacity
- At tissues: Hb gives up O2 → deoxy-Hb → better CO2 carrier → ↑ CO2 pickup
- At lungs: Hb binds O2 → oxy-Hb → ↓ CO2 carrying → CO2 released
TOPIC 8: VENTILATION/PERFUSION (V/Q) RATIO ⭐⭐
Normal V/Q Ratio = 0.8 (VA = 4.2 L/min; Q = 5 L/min)
Regional V/Q Differences in Upright Lung
| Region | V/Q | PO2 | PCO2 | Explanation |
|---|
| Apex | >0.8 (↑, ~3.3) | High (~130 mmHg) | Low (~28 mmHg) | Gravity: less blood flow to apex |
| Base | <0.8 (↓, ~0.6) | Low (~89 mmHg) | High (~42 mmHg) | More blood flow; relatively less ventilation |
Both ventilation AND perfusion increase from apex to base, but perfusion increases MORE steeply.
V/Q Extremes
| Condition | V/Q | Equivalent | Example |
|---|
| Dead space | ∞ (V/Q = ∞) | Ventilated, not perfused | Pulmonary embolism |
| Shunt | 0 (V/Q = 0) | Perfused, not ventilated | Pneumonia, atelectasis |
Hypoxic Pulmonary Vasoconstriction (HPV) ⭐
- Low alveolar PO2 → constricts pulmonary arterioles (opposite to systemic!)
- Redirects blood away from poorly ventilated alveoli → improves V/Q matching
- Occurs in chronic hypoxia (altitude, COPD) → chronic pulmonary hypertension
TOPIC 9: PULMONARY CIRCULATION ⭐
| Feature | Pulmonary | Systemic |
|---|
| Pressure | 25/8 mmHg (mean ~15) | 120/80 mmHg |
| Resistance | Low | High |
| Response to hypoxia | Vasoconstriction (HPV) | Vasodilation |
| Wall thickness | Thin | Thick |
| O2 effect | Low O2 → constrict | Low O2 → dilate |
West's Zones of the Lung ⭐⭐
| Zone | Location | Condition | Blood Flow |
|---|
| Zone 1 | Apex | PA > Pa > Pv | No flow (only in pathology/PPV) |
| Zone 2 | Mid | Pa > PA > Pv | Intermittent (flow ∝ Pa - PA) |
| Zone 3 | Base | Pa > Pv > PA | Continuous (flow ∝ Pa - Pv) |
(PA = alveolar pressure, Pa = arterial pressure, Pv = venous pressure)
TOPIC 10: CONTROL OF BREATHING ⭐⭐
Respiratory Centers in the Brainstem
| Center | Location | Function |
|---|
| Dorsal respiratory group (DRG) | Medulla | Inspiration neurons (basic rhythm) |
| Ventral respiratory group (VRG) | Medulla | Expiration + forced breathing |
| Pneumotaxic center | Upper pons | Limits inspiration; switches off inspiration |
| Apneustic center | Lower pons | Prolongs inspiration (held in check by pneumotaxic) |
Cutting between pons and medulla → apneusis (prolonged inspiratory gasps)
Cutting above pons (at pons-midbrain junction) → normal rhythm maintained
Central Chemoreceptors ⭐⭐
- Location: Ventral surface of medulla (not in the NTS)
- Stimulus: ↑ PCO2 → ↑ H⁺ in CSF (CO2 crosses blood-brain barrier freely; H⁺ does not)
- Most important regulator of breathing under normal conditions
- Insensitive to hypoxia directly
- In chronic hypercapnia (COPD) → central receptors adapt → these patients rely on hypoxic drive (peripheral)
Peripheral Chemoreceptors ⭐⭐
- Location: Carotid bodies (IX nerve, main) + Aortic bodies (X nerve)
- Stimuli (in order of importance):
- ↓ PaO2 (< 60 mmHg - significant threshold!)
- ↑ PaCO2
- ↓ pH
- ↓ arterial pressure
- Only receptors that respond to hypoxia (↓ PO2)
- Carotid bodies are the most important peripheral chemoreceptors
Key exam point: PaO2 must fall below 60 mmHg before peripheral chemoreceptors significantly stimulate ventilation
Other Receptors
| Receptor | Location | Stimulus | Response |
|---|
| Pulmonary stretch receptors | Airway smooth muscle | Lung inflation | Terminate inspiration (Hering-Breuer reflex) |
| Irritant receptors (Rapidly adapting) | Bronchial epithelium | Dust, smoke, chemicals | Bronchospasm, cough, hyperpnea |
| J receptors (juxtacapillary) | Alveolar walls near capillaries | Pulmonary edema, embolism | Rapid shallow breathing, dyspnea |
| Proprioceptors | Joints, muscles | Movement/exercise | Early ↑ in ventilation at start of exercise |
Hering-Breuer Reflex
- Lung inflation → activates pulmonary stretch receptors → inhibits inspiration (via vagus)
- Prevents over-inflation
- More important in newborns and during anesthesia; minimal role in awake adults
TOPIC 11: PULMONARY FUNCTION TESTS (PFTs) ⭐
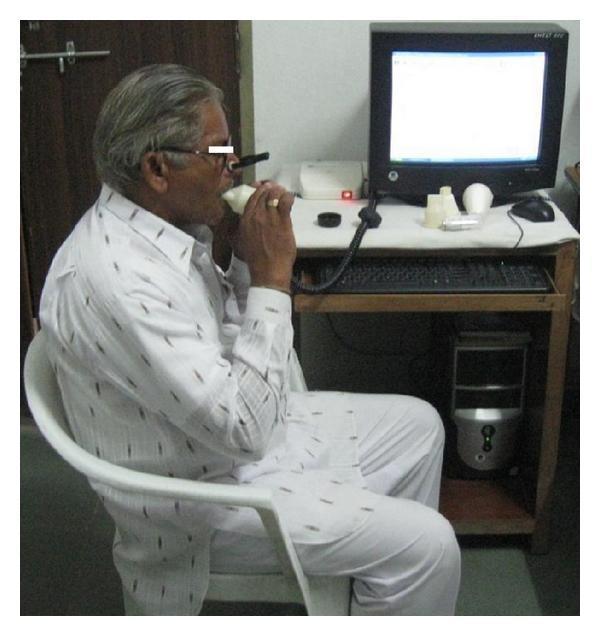
Spirometry - Key Measurements
| Parameter | Normal | Significance |
|---|
| FVC (Forced Vital Capacity) | ~4.8 L | Total air exhaled forcefully |
| FEV1 | ~3.4 L | Air exhaled in 1st second |
| FEV1/FVC | >0.75 | Key ratio for obstruction |
| PEFR | 400-600 L/min | Peak Expiratory Flow Rate |
Obstructive vs Restrictive Pattern
| Test | Obstructive | Restrictive |
|---|
| FVC | Normal or ↓ | ↓ |
| FEV1 | ↓↓ | ↓ |
| FEV1/FVC | < 0.7 | Normal or ↑ |
| TLC | ↑ | ↓ |
| RV | ↑ | ↓ |
| DLCO | ↓ (emphysema) | ↓ (fibrosis) |
TOPIC 12: SPECIAL TOPICS ⭐
Neonatal Respiratory Distress Syndrome (HMD)
- Cause: Immature lungs → ↓ surfactant → ↑ surface tension → alveolar collapse
- Seen in premature infants < 35 weeks
- Risk factors: prematurity, maternal diabetes, C-section without labor
- Treatment: Exogenous surfactant (beractant, poractant), antenatal betamethasone
CO Poisoning ⭐
- CO has 240x greater affinity for Hb than O2
- Produces carboxyhemoglobin → cannot carry O2
- Left-shifts O2-Hb dissociation curve → impairs O2 unloading at tissues
- PaO2 is NORMAL (dissolved O2 still normal) but O2 content and saturation are severely reduced
- Pulse oximetry is falsely normal in CO poisoning!
- Treatment: 100% O2 (speeds CO dissociation from Hb)
High Altitude Physiology ⭐
| Response | Acute | Chronic |
|---|
| PO2 | ↓ | ↓ |
| Ventilation | ↑ (hypoxic drive) | ↑ |
| PaCO2 | ↓ (hyperventilation) | ↓ |
| pH | ↑ (respiratory alkalosis) | Compensated |
| 2,3-DPG | - | ↑ (right shift) |
| Hb | - | ↑ (polycythemia) |
| RBCs | - | ↑ |
| EPO | - | ↑ |
| Pulmonary vasculature | HPV | Remodeling → pulmonary HTN |
Exercise Physiology - Respiratory ⭐
- VE (minute ventilation) increases proportionally with exercise intensity
- VCO2 and VO2 both ↑ with exercise
- At anaerobic threshold: VCO2 rises faster than VO2 (excess CO2 from buffering lactic acid)
- Breathing during exercise is stimulated by: proprioceptors (first!), then CO2/H⁺/K⁺
QUICK REVISION TABLE: ALL NORMAL VALUES ⭐⭐⭐
| Parameter | Normal Value |
|---|
| Tidal Volume (VT) | 500 mL |
| IRV | 3000 mL |
| ERV | 1100 mL |
| RV | 1200 mL |
| TLC | 6000 mL |
| VC | 4800 mL |
| FRC | 2300 mL |
| IC | 3500 mL |
| Anatomical dead space | 150 mL |
| Respiratory rate | 12-20/min |
| Minute ventilation | 6 L/min |
| Alveolar ventilation | 4.2 L/min |
| PiO2 (inspired) | 159 mmHg |
| PAO2 (alveolar) | 100 mmHg |
| PaO2 (arterial) | 95-100 mmHg |
| PvO2 (venous) | 40 mmHg |
| PaCO2 | 40 mmHg |
| PvCO2 | 46 mmHg |
| SaO2 | 98% |
| P50 | 26-27 mmHg |
| Normal V/Q | 0.8 |
| Lung compliance | 200 mL/cmH2O |
| DLco | 25 mL/min/mmHg |
| FEV1/FVC | >0.75 |
| Hüfner's constant | 1.34 mL O2/g Hb |
MOST FREQUENTLY ASKED EXAM POINTS 🎯
- RV and FRC cannot be measured by spirometry (need helium dilution/body plethysmography)
- Normal quiet expiration is passive (no muscle contraction)
- Surfactant secreted by Type II pneumocytes; component = DPPC
- FEV1/FVC < 0.7 = obstructive pattern
- CO2 diffuses 20x faster than O2 (higher solubility despite larger MW)
- Central chemoreceptors respond to CO2/H⁺; Peripheral (carotid bodies) respond to hypoxia
- PaO2 must fall < 60 mmHg to stimulate peripheral chemoreceptors significantly
- Hering-Breuer reflex - lung inflation → stops inspiration (via vagal stretch receptors)
- West Zone 3 (base) has the best blood flow; Zone 1 (apex) can have no flow
- CO poisoning - PaO2 is normal but SpO2 (pulse ox) is falsely high; treat with 100% O2
- Right shift of O-Hb curve: ↑ Temp, ↑ CO2, ↑ H⁺ (acidosis), ↑ 2,3-DPG → aids O2 unloading at tissues
- Chloride shift (Hamburger phenomenon) - HCO3⁻ exits RBC, Cl⁻ enters
- HPV (Hypoxic Pulmonary Vasoconstriction) - opposite to systemic vessels
- 2,3-DPG - ↓ in stored blood, ↑ at altitude/chronic anemia
- V/Q at apex ~3.3; at base ~0.6 in upright position
Sources: Costanzo Physiology 7th Edition, Ganong's Review of Medical Physiology 26th Edition, Guyton & Hall Textbook of Medical Physiology - cross-referenced and compiled for GK Pal exam syllabus