
Ecg की सभी स्थितियों को समझाएं
Reading File
अब मैं ECG के सभी sections के लिए textbook में search करता हूं।
Finding Sources
Finding Sources
Reading File
Finding Sources
Finding Sources
Finding Sources
Reading File
Finding Sources
Reading File
Finding Sources
Loading Image
Loading Image
अब मेरे पास सभी जरूरी जानकारी है। ECG की सभी स्थितियों का विस्तृत उत्तर हिंदी में प्रस्तुत करता हूं।
ECG (Electrocardiogram) - सम्पूर्ण मार्गदर्शिका
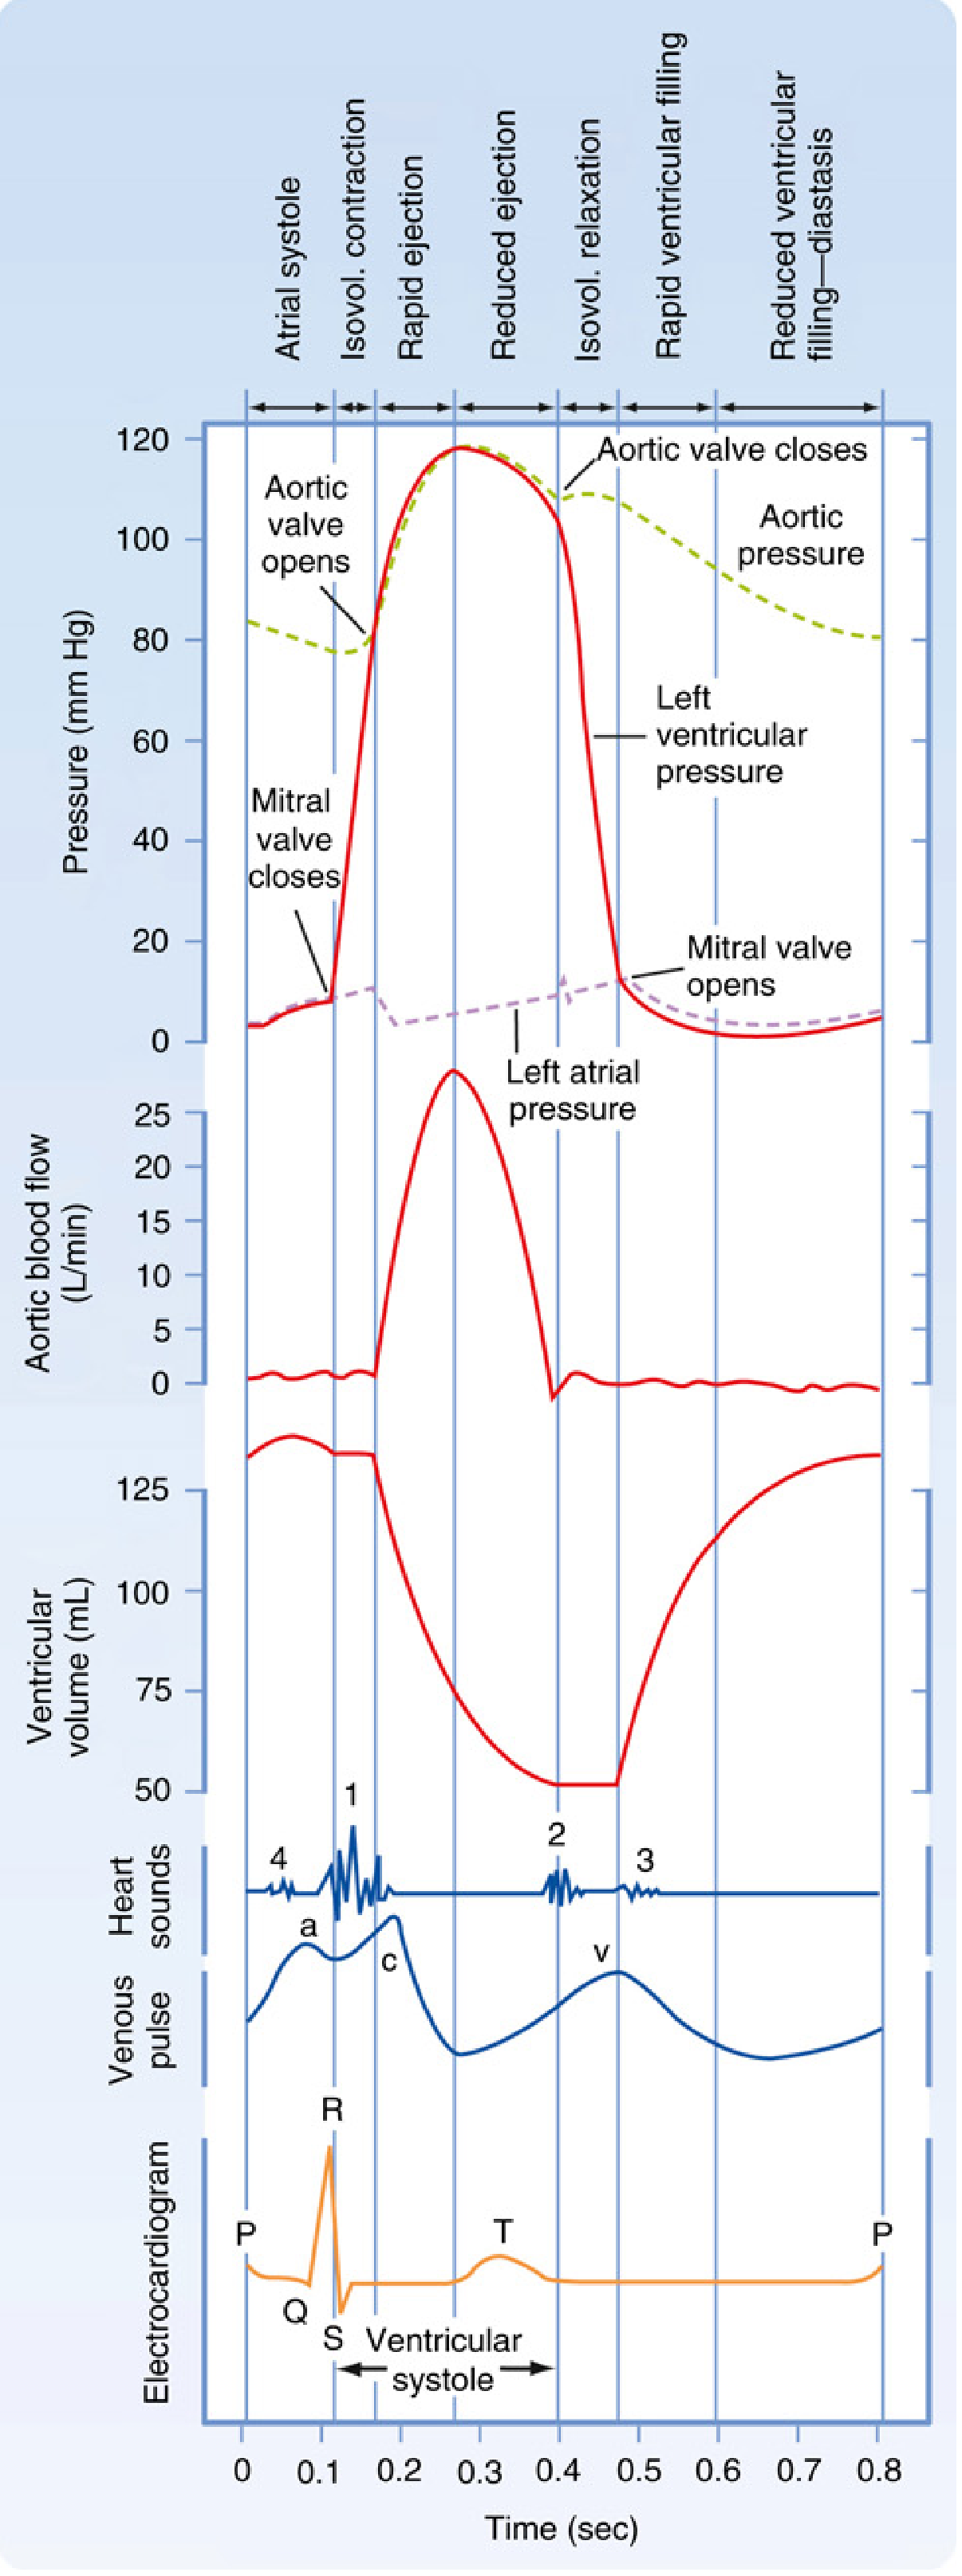
ECG हृदय की विद्युत गतिविधि का ग्राफिकल प्रतिनिधित्व है। यह शरीर की सतह पर हृदय द्वारा उत्पन्न विद्युत क्षमता (electrical potential) के अंतर को रिकॉर्ड करता है।
🔬 ECG की मूल अवधारणा - Cardiac Conduction System
हृदय में विद्युत संकेत का मार्ग:
SA Node → दोनों Atria → AV Node → His Bundle →
Left & Right Bundle Branches → Purkinje Fibers → Ventricular Myocytes
- SA Node से आवेग → दोनों Atria में फैलता है → P Wave बनती है
- AV Node पर थोड़ी देरी → PR Interval दर्शाता है
- Ventricles में depolarization → QRS Complex बनता है
- Ventricular repolarization → T Wave बनती है
📐 ECG Paper की मूल बातें
| मापदंड | मान |
|---|---|
| Paper Speed | 25 mm/sec |
| 1 छोटा Box | 1 mm = 0.04 sec |
| 1 बड़ा Box | 5 mm = 0.20 sec |
| Amplitude Standard | 10 mm = 1 mV |
| HR calculation | 300 ÷ R-R के बीच बड़े boxes |
📊 ECG के सभी Waves, Intervals और Segments
1. P Wave (अलिंद विद्युतीकरण)
- क्या दर्शाता है: दोनों Atria का depolarization (SA Node से शुरू)
- सामान्य अवधि: < 0.12 sec (3 छोटे boxes)
- सामान्य Amplitude: < 2.5 mm
- Abnormalities:
- P tall (>2.5mm) → Right Atrial Enlargement (P-pulmonale)
- P broad (>0.12s) या notched → Left Atrial Enlargement (P-mitrale)
- P absent → Atrial Fibrillation
- P inverted → Ectopic atrial rhythm / Junctional rhythm
2. PR Interval (AV Conduction समय)
- क्या दर्शाता है: P Wave की शुरुआत से QRS की शुरुआत तक - AV node की देरी
- सामान्य: 0.12-0.20 sec (3-5 बड़े boxes)
- Abnormalities:
- PR prolonged (>0.20s) → 1st Degree AV Block
- PR progressively ↑ फिर Beat drop → 2nd Degree AV Block (Mobitz Type I / Wenckebach)
- PR fixed + dropped beats → 2nd Degree AV Block (Mobitz Type II)
- No relationship P-QRS → 3rd Degree (Complete) Heart Block
- PR short (<0.12s) + Delta wave → WPW Syndrome (Pre-excitation)
3. QRS Complex (निलय विद्युतीकरण)
- क्या दर्शाता है: Ventricular depolarization
- सामान्य अवधि: 0.06-0.10 sec
- Q Wave: Septal depolarization (< 0.04s और < 25% of R height = Normal)
- Abnormalities:
- Broad QRS (>0.12s) → Bundle Branch Block / Ventricular rhythm
- Pathological Q wave → पुराना MI (Myocardial Infarction)
- Tall R (>25mm V5/V6) → LVH (Left Ventricular Hypertrophy)
- Deep S V1, tall R V5 → LVH (Sokolow-Lyon: >35mm)
4. ST Segment (Ventricular Plateau Phase)
- क्या दर्शाता है: Complete ventricular depolarization - J point से T wave तक
- सामान्य: Isoelectric line पर (baseline)
- Abnormalities:
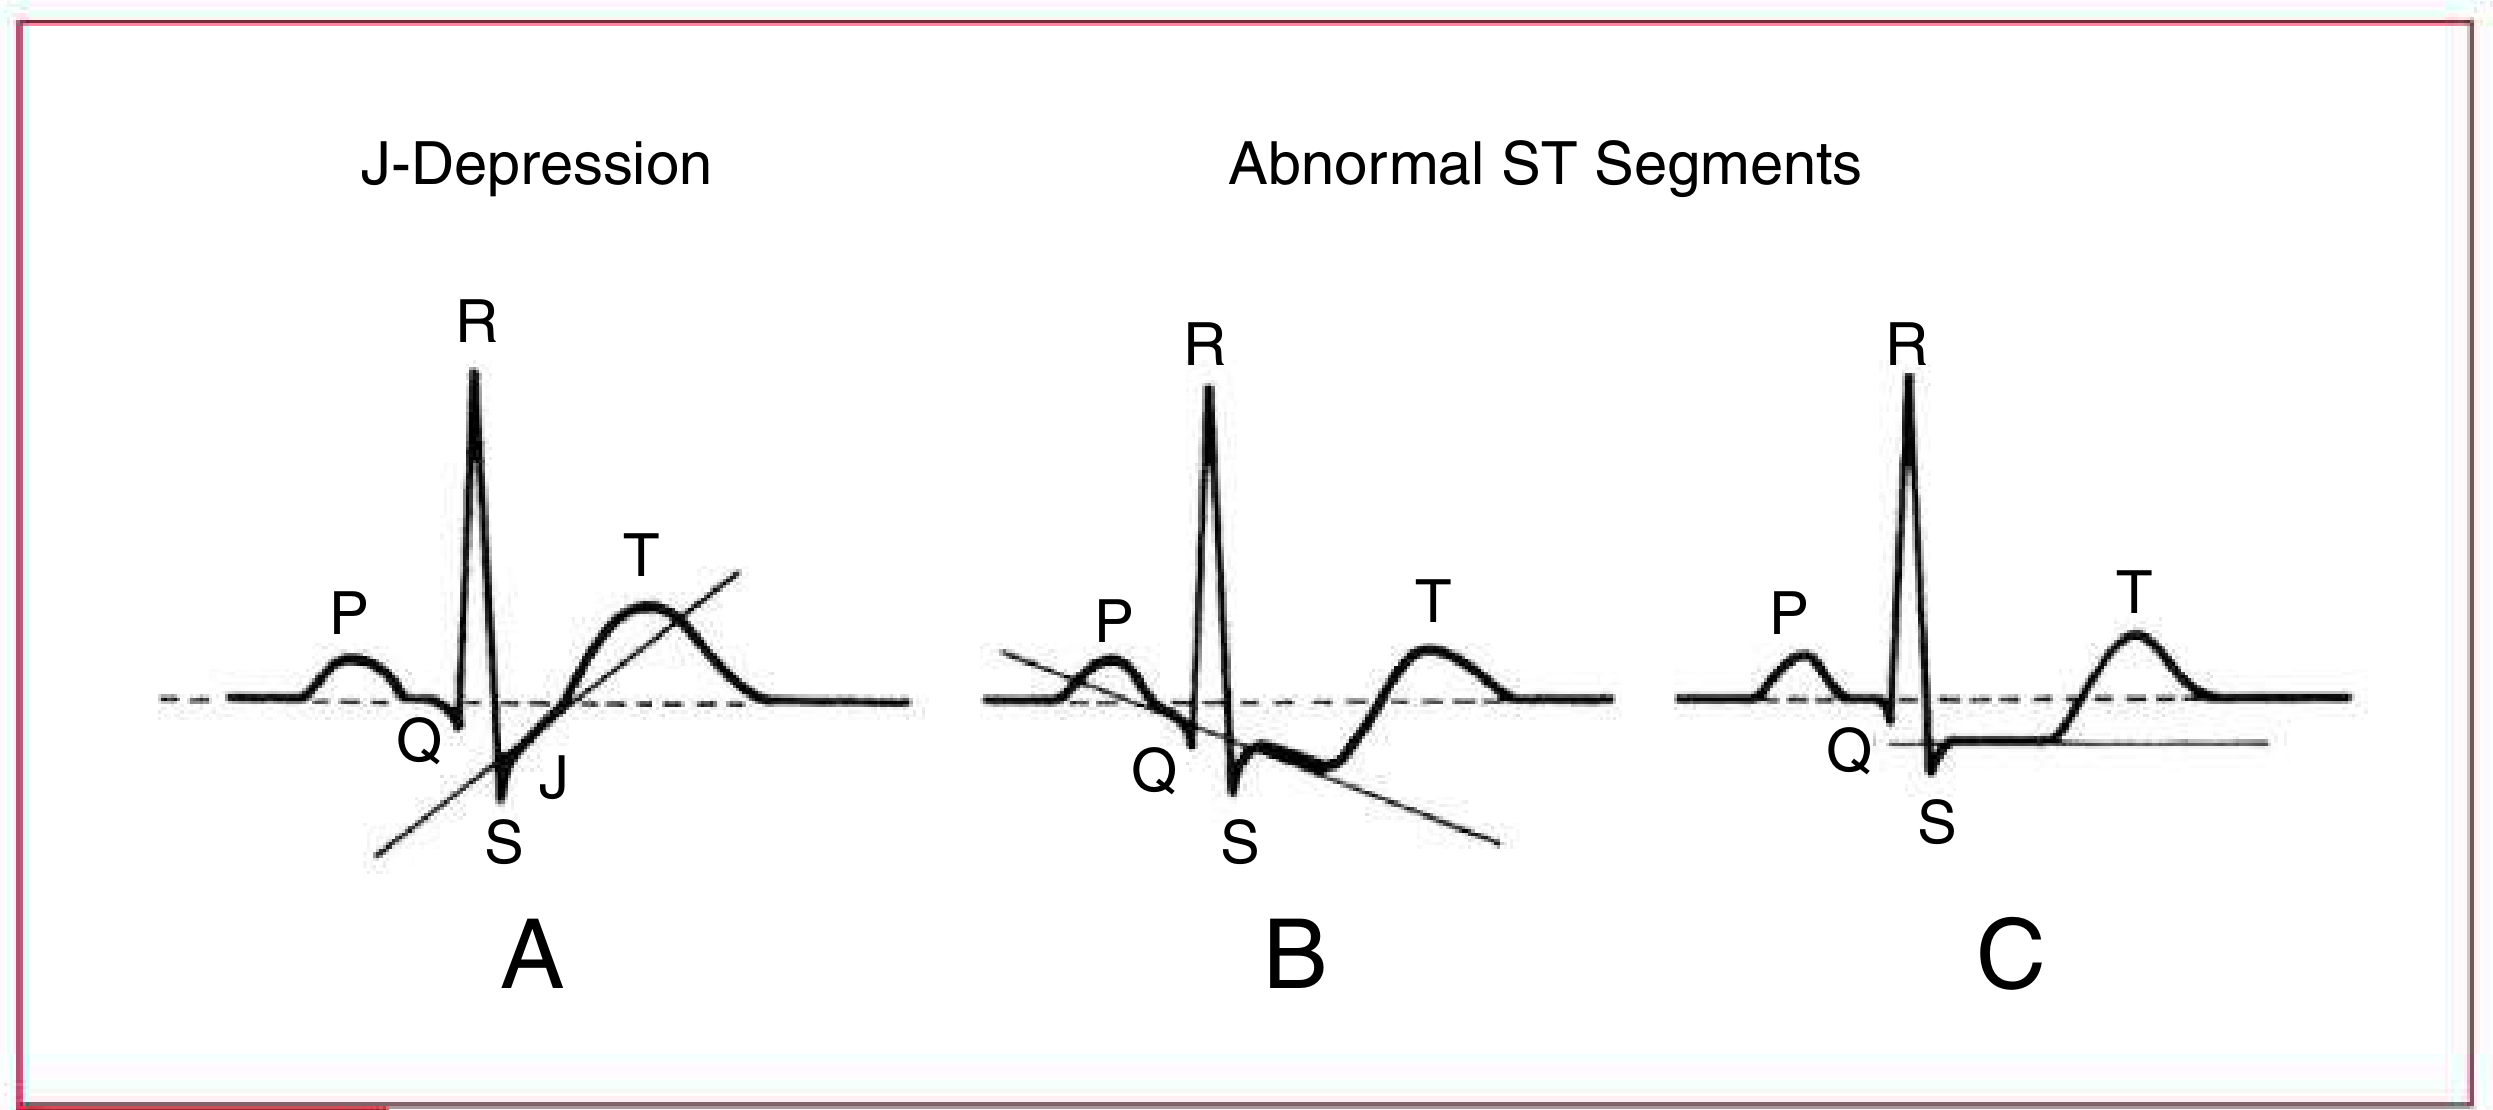
| ST Change | अर्थ |
|---|---|
| ST Elevation (>1mm) | STEMI / Pericarditis / Vasospasm |
| ST Depression | Ischemia / NSTEMI / Digitalis effect |
| J-depression (upsloping) | सामान्यतः non-ischemic |
| Downsloping ST | Pathological ischemia |
| Horizontal ST | Ischemia (अधिक specific) |
| Saddle-shaped ST elevation सभी leads में | Pericarditis |
5. T Wave (Ventricular Repolarization)
- क्या दर्शाता है: Ventricular cells का repolarize होना
- सामान्य: QRS के same direction में, asymmetric
- Abnormalities:
- Peaked T (tall, symmetric) → Hyperkalemia / Hyperacute MI
- Inverted T → Ischemia / LVH / Bundle Branch Block / PE
- Flat T → Hypokalemia / Hypothyroidism
- Biphasic T → Ischemia / Hypokalemia
- T inversion V1-V4 → Right Heart Strain / PE (S1Q3T3 pattern)
6. QT Interval
- क्या दर्शाता है: कुल Ventricular electrical activity (Depolarization + Repolarization)
- Calculation: QTc = QT(sec) / √R-R interval (Bazett formula)
- सामान्य QTc:
- पुरुष: < 0.45 sec
- महिला: < 0.46 sec
- नवजात (1 सप्ताह): < 0.47 sec
- Prolonged QT के कारण:
- Drugs: Quinidine, Sotalol, Antipsychotics, Antihistamines
- Electrolytes: Hypokalemia, Hypomagnesemia, Hypocalcemia
- Congenital Long QT Syndrome
- खतरा: Torsades de Pointes → Ventricular Fibrillation
- Short QT: Hypercalcemia, Digitalis toxicity
7. U Wave
- T wave के बाद छोटी positive deflection
- सामान्य: V2-V3 में दिखती है
- Prominent U wave → Hypokalemia की पहचान
- Inverted U → LVH / Ischemia
💓 ECG की Heart Rate स्थितियां
| स्थिति | HR | ECG Pattern |
|---|---|---|
| Normal Sinus Rhythm | 60-100 bpm | नियमित P→QRS→T |
| Sinus Bradycardia | <60 bpm | सब normal, धीमी गति |
| Sinus Tachycardia | >100 bpm | सब normal, तेज गति |
| Sinus Arrhythmia | Variable | P-P interval बदलता (श्वास के साथ) |
⚡ ECG Arrhythmias (अनियमित लय)
Atrial (अलिंद) Arrhythmias
| स्थिति | ECG पहचान |
|---|---|
| PAC (Premature Atrial Contraction) | समय से पहले P wave, shape different |
| Atrial Flutter | Sawtooth P waves (rate 250-350 bpm), 2:1 या 3:1 block |
| Atrial Fibrillation (AF) | P wave absent, irregular QRS, coarse baseline |
| SVT (Supraventricular Tachycardia) | Narrow QRS, P wave hidden in T, rate 150-250 bpm |
| WPW Syndrome | Short PR + Delta wave + broad QRS |
AF सबसे common cardiac arrhythmia है - ECG पर कोई clear P wave नहीं, irregular R-R interval - Medical Physiology
Junctional Rhythms
| स्थिति | ECG पहचान |
|---|---|
| Junctional Rhythm | P wave inverted या absent, rate 40-60 bpm |
| Junctional Tachycardia | Rate >60 bpm, P inverted |
| AVNRT | P wave in QRS या just after, narrow QRS, rate 150-250 |
Ventricular (निलय) Arrhythmias
| स्थिति | ECG पहचान |
|---|---|
| PVC (Premature Ventricular Contraction) | Wide QRS >0.12s, no preceding P, compensatory pause |
| Ventricular Tachycardia (VT) | Wide QRS >0.12s, rate >100 bpm, P-QRS dissociation |
| Torsades de Pointes | VT + twisting QRS axis, prolonged QT |
| Ventricular Fibrillation (VF) | Chaotic, irregular baseline - NO QRS - Cardiac Arrest |
| Idioventricular Rhythm | Wide QRS, rate 20-40 bpm - escape rhythm |
🔗 AV Block (Conduction Disturbances)
| Block | ECG Feature |
|---|---|
| 1st Degree | PR >0.20s, सभी P conduct होती हैं |
| 2nd Degree Type I (Wenckebach) | PR progressively बढ़ता → फिर एक beat drop |
| 2nd Degree Type II (Mobitz II) | Fixed PR + suddenly dropped QRS |
| 3rd Degree (Complete Block) | P और QRS की कोई relationship नहीं, escape rhythm |
🫀 Bundle Branch Blocks
| स्थिति | ECG Pattern |
|---|---|
| RBBB (Right Bundle Branch Block) | QRS >0.12s, RSR' ("rabbit ears") in V1, wide S in V6 |
| LBBB (Left Bundle Branch Block) | QRS >0.12s, broad R in I,V5,V6, QS in V1 |
| LAFB (Left Anterior Hemiblock) | Left Axis Deviation (-45° से -90°) |
| LPFB (Left Posterior Hemiblock) | Right Axis Deviation |
| Incomplete BBB | QRS 0.10-0.12s |
Left anterior hemiblock → abnormal left axis deviation; left posterior hemiblock → abnormal right axis deviation - Ganong's Review of Medical Physiology
📍 Axis Deviation (QRS Axis)
| Axis | Range | कारण |
|---|---|---|
| Normal | -30° to +90° | सामान्य |
| Left Axis Deviation (LAD) | -30° से -90° | LVH, LBBB, LAFB, Inferior MI |
| Right Axis Deviation (RAD) | +90° से +180° | RVH, RBBB, Lateral MI, PE |
| Extreme/Indeterminate | -90° से +180° | VT, Emphysema |
Quick Axis check: Lead I और aVF देखें
- दोनों positive → Normal
- I positive, aVF negative → LAD
- I negative, aVF positive → RAD
❤️ Hypertrophy (बड़ा दिल)
Left Ventricular Hypertrophy (LVH)
- Sokolow-Lyon Criteria: S(V1) + R(V5 या V6) > 35 mm
- LVH + repolarization changes → "LV strain pattern" (ST depression + T inversion in lateral leads)
- कारण: Hypertension, Aortic stenosis
Right Ventricular Hypertrophy (RVH)
- Tall R in V1, Deep S in V5/V6
- Right Axis Deviation
- कारण: Pulmonary hypertension, Tetralogy of Fallot
Atrial Enlargement
- LAE (Left): P wave broad >0.12s, notched ("bifid P"), negative in V1
- RAE (Right): P wave tall >2.5mm, peaked in II, III, aVF
🩺 MI (Myocardial Infarction) - ECG Changes
| MI का Stage | ECG Change |
|---|---|
| Hyperacute (मिनटों में) | Tall peaked T waves |
| Acute (घंटों में) | ST Elevation (STEMI) |
| Evolving (6-24 घंटे) | Q waves बनना, T inversion |
| Old/Established | Pathological Q waves, normalized ST |
MI Location (Territory)
| MI स्थान | Affected Leads | Artery |
|---|---|---|
| Anterior | V1-V4 | LAD |
| Lateral | I, aVL, V5-V6 | LCx |
| Inferior | II, III, aVF | RCA |
| Posterior | V1-V2 (ST depression, tall R) | RCA/LCx |
| Anteroseptal | V1-V3 | LAD |
| Anterolateral | V1-V6, I, aVL | LAD + LCx |
Inferior MI में lead III > lead II में ST elevation + lead I, aVL में reciprocal ST depression - Tintinalli's Emergency Medicine
🧪 Electrolyte Changes on ECG
| Electrolyte | ECG Effect |
|---|---|
| Hyperkalemia (↑K+) | Peaked T waves → Wide QRS → Sine wave → VF |
| Hypokalemia (↓K+) | Flat T, Prominent U wave, ST depression |
| Hypercalcemia (↑Ca2+) | Short QT |
| Hypocalcemia (↓Ca2+) | Long QT |
| Hypomagnesemia | Long QT, Torsades |
💊 Drugs और ECG Changes
| Drug | ECG Effect |
|---|---|
| Digitalis | "Digitalis effect" - ST sagging, short QT, PR prolongation |
| Quinidine/Sotalol | Long QT → Torsades |
| Beta-blockers | Bradycardia, PR prolongation |
| Tricyclic Antidepressants | Broad QRS, Right axis deviation |
| Cocaine | ST elevation, VT |
🫁 Systemic Diseases पर ECG
| Disease | ECG Pattern |
|---|---|
| Pulmonary Embolism (PE) | S1Q3T3 pattern, Right bundle branch block, Sinus tachycardia |
| Hypothermia | Osborn (J) waves, Bradycardia |
| Pericarditis | Diffuse saddle-shaped ST elevation, PR depression |
| Pericardial Effusion | Low voltage, Electrical alternans |
| HOCM | Deep Q waves (septal), LVH pattern |
| Situs Inversus | Lead I inverted, Dextrocardia pattern |
📋 ECG पढ़ने का Systematic Approach
- Rate - HR calculate करें (300/large boxes)
- Rhythm - Regular है? Sinus rhythm है?
- Axis - Normal, LAD, RAD?
- P Wave - Shape, duration, amplitude
- PR Interval - 0.12-0.20s?
- QRS Complex - Duration, morphology, voltage
- ST Segment - Elevation/Depression?
- T Wave - Shape, direction
- QT Interval - QTc normal?
- U Wave - Present?
Sources:
- Miller's Anesthesia, 10th Edition - Electrical Events and the ECG
- The Harriet Lane Handbook, 23rd Edition - Systematic ECG Evaluation
- Ganong's Review of Medical Physiology - Cardiac Arrhythmias
- Tintinalli's Emergency Medicine - Electrocardiography
- Rosen's Emergency Medicine - ECG in ACS
- Goldman-Cecil Medicine - Bundle Branch Blocks
This is a shared conversation. Sign in to Orris to start your own chat.