
Types of swi in MRIive image also and explain
Reading File
Reading File
Finding Sources
Searching Images
MRI susceptibility-weighted imaging SWI brain blooming hemorrhage venous anatomy magnitude phase images
Searching PubMed
"susceptibility weighted imaging"
Searching the Web
susceptibility weighted imaging SWI MRI phase magnitude image explanation review
Reading File
Reading File
Reading Web Page
https://pmc.ncbi.nlm.nih.gov/articles/PMC5971274
SWI in MRI
SWI = Susceptibility-Weighted Imaging.
It is a 3D gradient-echo MRI sequence that is highly sensitive to substances that alter the local magnetic field, especially:
It is a 3D gradient-echo MRI sequence that is highly sensitive to substances that alter the local magnetic field, especially:
- Deoxyhemoglobin in veins
- Blood products, especially hemosiderin
- Iron deposition
- Calcification
- Some thrombi and venous congestion
These substances usually appear dark (hypointense) because of susceptibility-related signal loss, often with blooming. SWI is particularly good for detecting tiny cerebral microbleeds that can be missed on routine MRI or CT. Rosen's Emergency Medicine notes its value for traumatic axonal injury and punctate microhemorrhages. - Rosen's Emergency Medicine: Concepts and Clinical Practice, Other Neuroimaging Modalities.
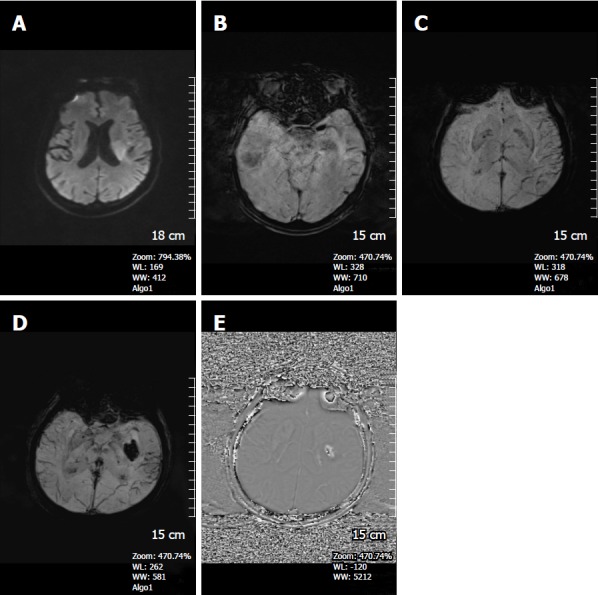
Representative SWI example: dark vessels and susceptibility signal loss are emphasized.
Main image types / outputs in an SWI sequence
| Image/output | What it shows | Main use |
|---|---|---|
| Magnitude image | Conventional T2*-like image. Blood products, iron, calcium, and veins tend to be dark. | Detecting microbleeds, hemosiderin, cavernomas, and thrombus. |
| Filtered phase image | Shows phase shifts caused by magnetic susceptibility. | Helps distinguish blood/iron from calcification. |
| Processed SWI image | Phase-mask information is multiplied with the magnitude image to make susceptibility effects much darker. | Standard diagnostic SWI image, best for tiny hemorrhages and venous structures. |
| MinIP SWI | Minimum-intensity projection over several thin slices, commonly 3-10 mm. | Displays continuous cortical and deep veins, venous congestion, and multiple microbleeds. |
| QSM | Quantitative susceptibility mapping, a related post-processing method that estimates tissue magnetic susceptibility numerically. | Research and specialist clinical assessment of iron, calcification, and hemorrhage. |
How it works
- A long-TE, high-resolution 3D gradient-echo sequence is acquired.
- The MRI scanner produces both magnitude and phase data.
- The phase image is filtered to remove background field effects.
- A phase mask is applied to the magnitude image.
- The final image increases the darkness of veins, blood products, and iron-containing lesions.
A MinIP reconstruction combines multiple slices and makes dark veins easier to follow. This process is described in this SWI technical review.
Important appearances
- Microbleed / hemosiderin: small round dark foci with blooming
- Acute or chronic hemorrhage: dark, often larger than the true lesion because of blooming
- Cerebral veins: thin dark branching/tubular structures
- Venous thrombosis: abnormal dark thrombus or prominent collateral veins
- Calcification: may also look dark on magnitude/SWI images
- Iron deposition: dark signal in basal ganglia or other affected regions
Blood versus calcification on SWI
Both can be dark on the final SWI image. The phase image can help because their susceptibility behavior is opposite:
- Blood products / iron: paramagnetic
- Calcification: diamagnetic
However, whether each appears bright or dark on a phase image depends on the scanner manufacturer and phase-display convention. Therefore, interpretation should use the local scanner convention and CT correlation when calcification is suspected.
Common clinical uses
- Head injury: diffuse axonal injury and traumatic microbleeds
- Stroke: hemorrhagic transformation, thrombus susceptibility vessel sign, prominent veins in hypoperfused brain
- Cerebral amyloid angiopathy: lobar microbleeds
- Hypertensive small-vessel disease: deep microbleeds
- Cavernous malformations
- Cerebral venous thrombosis
- Brain tumors: intratumoral hemorrhage, veins, calcification
- Neurodegenerative disorders: abnormal iron deposition
A 2024 systematic review found SWI useful for more accurate incorporation into traumatic brain injury MRI protocols (PMID 39044937).
How can identify the image with explains pls clarify
Reading File
Searching Images
comparison MRI SWI magnitude phase minimum intensity projection image cerebral microbleeds hemorrhage
Finding Sources
Searching PubMed
"susceptibility weighted imaging"
Searching the Web
SWI MRI identify image features phase magnitude minIP microbleed how to recognize
Use this image to understand the four SWI outputs:
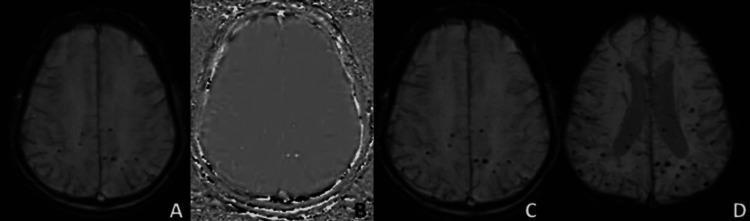
Identify each panel
| Panel | Image type | How to recognize it | What to look for |
|---|---|---|---|
| A | Magnitude image | Looks similar to a standard GRE/T2* image, with relatively normal brain anatomy. | Veins and blood products are dark, but tiny lesions may be subtle. |
| B | Filtered phase image | Has unusual black-white contrast, rather than a familiar anatomical MRI appearance. | Used to help tell blood/iron from calcium. Do not decide using bright or dark alone because scanner conventions differ. |
| C | Processed SWI | Dark structures are much more conspicuous than on magnitude images. | Small dark round lesions with a dark halo are microbleeds or hemosiderin deposits. This exaggerated darkness is called blooming. |
| D | MinIP SWI | Appears thicker, with dark vessels seen across multiple slices. | Best for viewing dark branching veins and for detecting multiple microbleeds. |
How to identify SWI on an MRI scan
Look at the sequence label first. It may be called:
- SWI
- SWAN (GE scanner)
- VEN_BOLD
- T2* GRE
- mIP SWI / MinIP
Then look for these visual clues:
-
Veins are black and branching
Normal cerebral veins appear as thin, curving, tubular dark lines. They should continue into adjacent slices. -
Microbleeds are black dots
They are round or oval, usually very small, and remain in the same place on nearby slices. They may be more obvious on processed SWI and MinIP than on magnitude images. -
Blooming effect
A true tiny blood-product deposit may look larger and darker on SWI than it really is. This is a typical susceptibility effect. -
Do not mistake a vessel cross-section for a microbleed
A vein can look like a dark dot when seen end-on. Scroll through the images:- If the dot becomes a continuous tubular line, it is a vessel.
- If it remains a separate rounded dot, it is more likely a microbleed.
-
Compare magnitude, phase, and SWI
A genuine susceptibility lesion is usually visible on more than one output. Phase data may help distinguish calcification from blood products, but the exact bright/dark phase appearance varies by scanner manufacturer.
In the displayed image
The multiple tiny dark rounded spots in the temporo-occipital and subcortical white-matter areas are microbleeds. They are most obvious in C (SWI) and D (MinIP) due to blooming. The dark linear structures are normal or prominent veins, not microbleeds.
A useful review method is: find the dark dot on SWI, check adjacent slices to exclude a vein, then review phase images and CT if calcification is possible. This approach is described in a microbleed SWI review.
This is a shared conversation. Sign in to Orris to start your own chat.