
Explain arthritis
arthritis joint inflammation comparison rheumatoid osteoarthritis
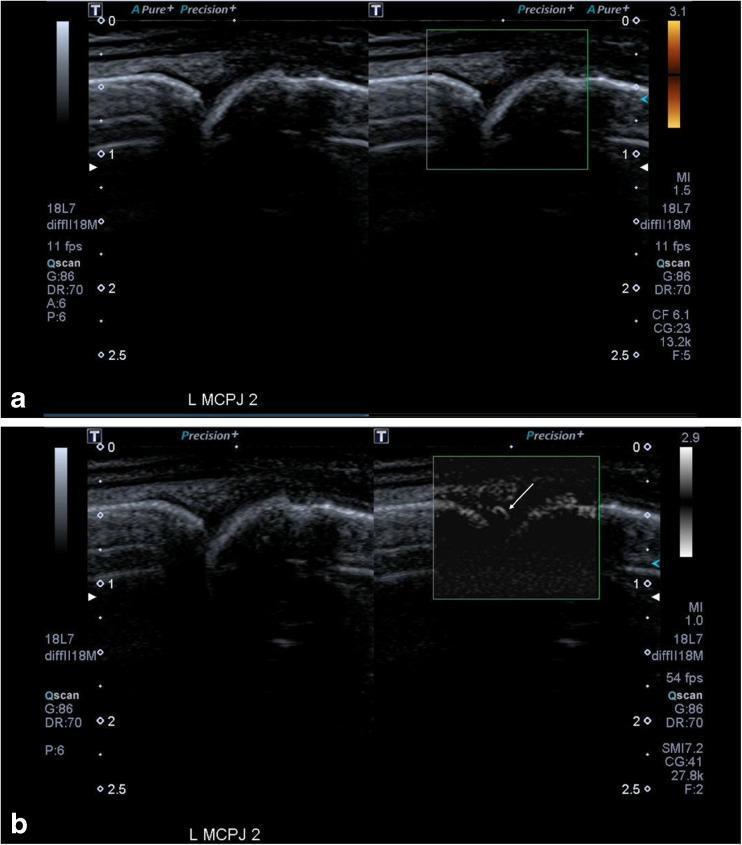
This diagnostic image set displays a side-by-side comparison of different ultrasound modalities used to assess inflammation in the second left metacarpophalangeal joint (MCPJ) of a patient with rheumatoid arthritis. Panel (a) features a dual-view ultrasound: the left side shows a grey-scale (B-mode) image of a relatively normal-appearing joint space, while the right side employs Power Doppler Ultrasound (PDUS), which fails to detect any significant vascular flow within the joint. Panel (b) provides a corresponding view using Superb Microvascular Imaging (SMI). In contrast to the PDUS, the SMI mode (indicated by the arrow) reveals clear, fine neovascularity within the joint, signifying active synovitis. Technical parameters such as mechanical index (MI), frequency (18L7), frame rate (54 fps in SMI vs 11 fps in PDUS), and gain settings are visible in the margins. This comparison highlights the superior sensitivity and spatial resolution of SMI over traditional PDUS in detecting low-velocity microvascular flow associated with early or low-grade joint inflammation in musculoskeletal imaging.
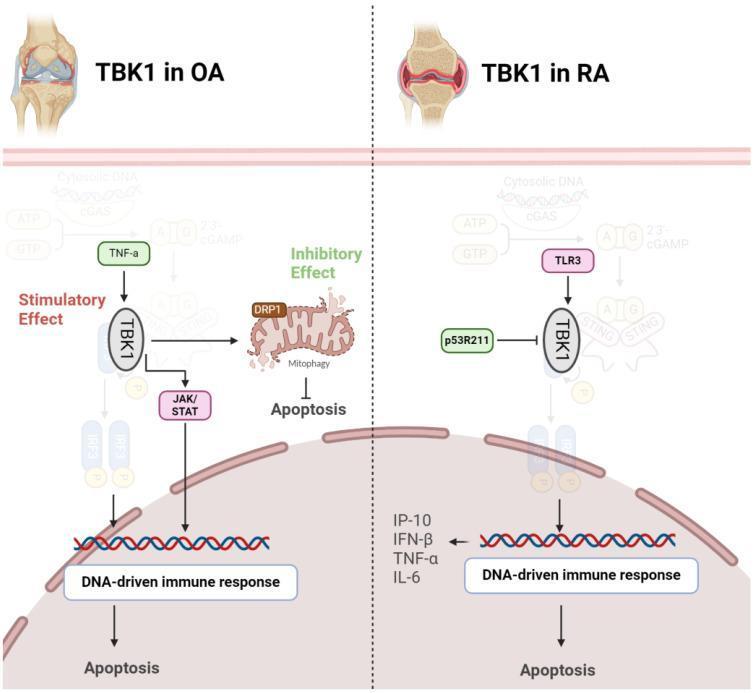
A pathophysiology diagram comparing the signaling pathways of TANK-binding kinase 1 (TBK1) in Osteoarthritis (OA) and Rheumatoid Arthritis (RA). The diagram is divided vertically by a dotted line. The left side (OA) shows a knee joint illustration and a pathway where TNF-α stimulates TBK1. Downstream, TBK1 has a dual role: an inhibitory effect through DRP1-mediated mitophagy that prevents apoptosis, and a stimulatory effect via the JAK/STAT axis that promotes a DNA-driven immune response leading to apoptosis. The right side (RA) depicts a knee joint with synovial inflammation. Here, TBK1 is stimulated by TLR3 and inhibited by p53R211. Activated TBK1 promotes a DNA-driven immune response, triggering the production of pro-inflammatory cytokines including IP-10, IFN-β, TNF-α, and IL-6, ultimately resulting in apoptosis. Faded background elements illustrate the upstream cGAS-STING pathway involving cytosolic DNA. This diagram serves as an educational resource for understanding molecular pathogenesis and potential therapeutic targets in degenerative versus autoimmune arthropathies.
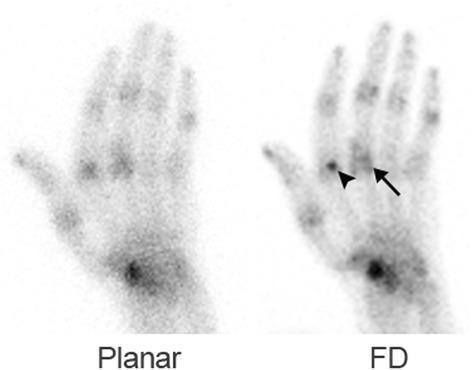
This diagnostic comparison image demonstrates 99mTc-MDP bone scintigraphy of the hand in a 71-year-old male with rheumatoid arthritis. The left panel shows a routine planar NaI(Tl) scan, while the right panel displays a full-dose (FD) cadmium zinc telluride (CZT) detector scan. Both images exhibit multiple areas of increased radiotracer uptake corresponding to active joint inflammation. The CZT scan provides significantly higher spatial resolution and contrast, allowing for better visualization of anatomic structures and focal pathologies. Specifically, the FD CZT image clearly reveals increased uptake localized to both sides of the joint space in the third metacarpophalangeal (MCP) joint (indicated by an arrow). Additionally, a discrete focal point of tracer activity at the MCP region of the index finger is identified as a sesamoid bone (indicated by an arrowhead). The image serves as an educational comparison of detector technology in nuclear medicine, illustrating how CZT-based imaging improves the detection of small articular structures and the characterization of multifocal tracer distribution in systemic inflammatory conditions like rheumatoid arthritis.
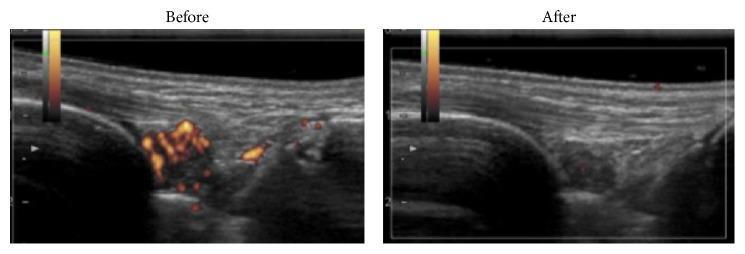
This Comparison Chart displays longitudinal musculoskeletal ultrasound (US) images of a wrist joint before and after treatment for rheumatoid arthritis. The diagnostic imaging utilizes Power Doppler (PD) to evaluate synovial inflammation. In the 'Before' image, there is a prominent, localized area of intense, heterogeneous orange and red color Doppler signals, indicating high-grade active synovitis with increased vascularity. The underlying grayscale image shows irregular, hypoechoic thickening of the synovial tissue. The 'After' image, taken following treatment with the TNF inhibitor certolizumab pegol (CZP), demonstrates a complete disappearance of the PD-positive inflammatory signals. Furthermore, the grayscale appearance shows a reduction in synovial thickening and a more homogeneous tissue texture. This side-by-side comparison illustrates the effectiveness of biologic therapy in achieving clinical and sonographic remission by resolving joint hypervascularity and inflammation.
arthritis classification management
osteoarthritis osteophytes Heberden nodes hand X-ray
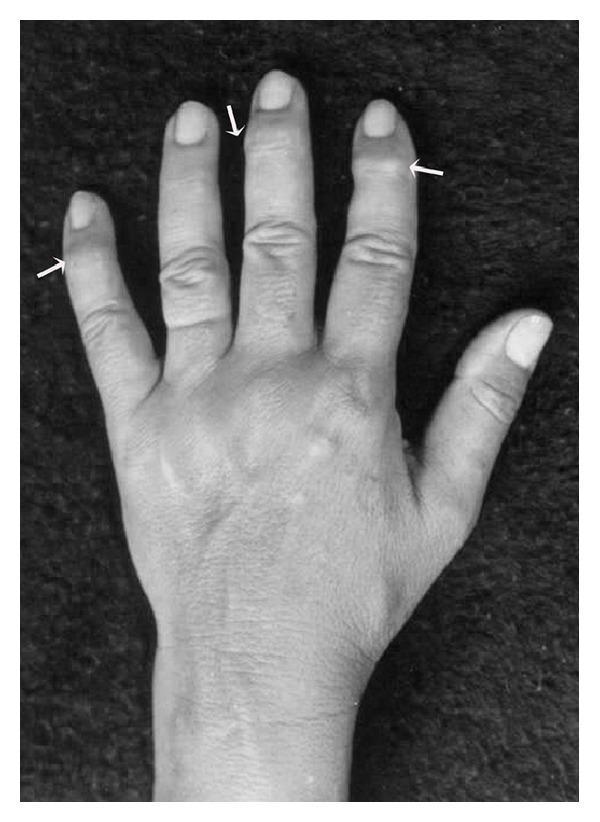
This clinical photograph displays a dorsal view of a human hand, specifically highlighting manifestations of primary osteoarthritis. The image demonstrates characteristic bony enlargements known as Heberden's nodes, located at the distal interphalangeal (DIP) joints. These nodes are indicated by white arrows and appear as firm, rounded protuberances or osteophytes on the index, middle, and little fingers. The anatomical focus is on the small joints of the hand, illustrating typical degenerative joint disease changes. The skin overlying the joints appears normal without acute inflammatory signs like erythema, though the prominence of the nodes suggests chronic remodeling of the subchondral bone. This visual is a classic educational example of osteoarthritis of the hands, distinguishing it from rheumatoid arthritis which typically affects the proximal interphalangeal and metacarpophalangeal joints. The image serves as a clinical reference for physical examination findings in rheumatology and geriatrics.
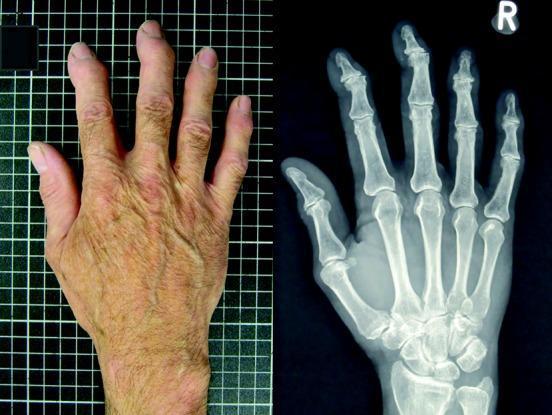
This composite image provides a side-by-side comparison of a clinical photograph and a corresponding posterior-anterior radiograph of a human right hand, demonstrating features of hand osteoarthritis (OA). The clinical photograph on the left shows an aged hand with prominent skin wrinkling, solar lentigines, and dorsal venous prominence. Notable morphological changes include bony enlargement and swelling at the distal interphalangeal (DIP) and proximal interphalangeal (PIP) joints, consistent with Heberden’s and Bouchard’s nodes. Slight radial or ulnar deviation of the digits is visible. The corresponding X-ray on the right confirms degenerative joint disease, characterized by significant joint space narrowing, subchondral sclerosis, and marginal osteophyte formation, most prominently at the DIP, PIP, and first carpometacarpal (CMC) joints. The image illustrates the construct validity between clinical photographic grading and radiographic Kellgren-Lawrence (K/L) scoring for assessing disease severity in rheumatology and geriatric medicine.
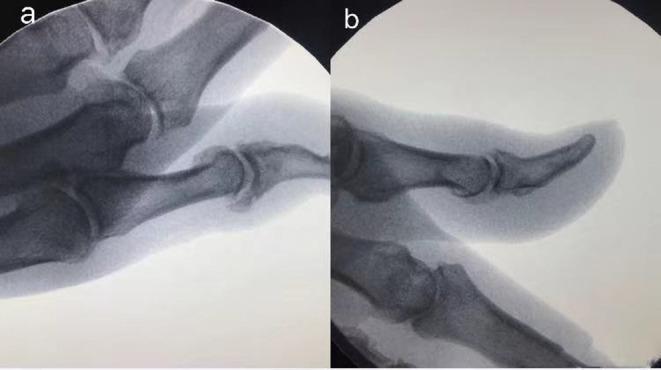
This diagnostic comparison contains two lateral X-ray views of the thumb distal interphalangeal (DIP) joint, demonstrating the surgical management of osteoarthritis. Image (a) represents the pre-operative state, showing significant dorsal osteophyte formation at the DIP joint. These osteophytes appear as radiopaque, irregular bony protrusions along the joint margin, accompanied by joint space narrowing characteristic of advanced degenerative arthritis. Image (b) shows the post-operative result three months following surgical intervention. The previously noted osteophytes have been removed, resulting in a significantly smoother and more regular cortical contour of the distal and middle phalanges at the articulation site. The clinical focus of this visual is to illustrate successful surgical debridement of hypertrophic bone in the context of symptomatic hand arthritis. The imaging facilitates education on identifying radiological signs of osteoarthritis (osteophytosis and joint space loss) and assessing post-surgical anatomical remodeling.
Arthritis: A Comprehensive Overview
1. What Is a Joint?
- Articular cartilage - smooth hyaline cartilage covering bone ends
- Synovial membrane - inner lining that produces lubricating synovial fluid
- Joint capsule - fibrous outer layer
- Subchondral bone - bone just beneath the cartilage
2. Major Types of Arthritis
A. Osteoarthritis (OA) - Degenerative Joint Disease
- Pain that increases through the day and with use (mechanical pain)
- Morning stiffness lasting < 30 minutes (unlike RA)
- Affects: distal interphalangeal (DIP) joints, proximal interphalangeal (PIP) joints, knees, hips, lumbar spine
- Bony enlargements called Heberden's nodes (DIP joints) and Bouchard's nodes (PIP joints) - Firestein & Kelley's Textbook of Rheumatology
B. Rheumatoid Arthritis (RA) - Autoimmune Inflammatory
- Rheumatoid Factor (RF) - IgM antibody against IgG Fc region (positive in ~70-80%)
- Anti-citrullinated peptide antibodies (ACPA/anti-CCP) - present in 60-80% of RA, specificity 85-99%; may appear years before clinical disease - Robbins & Kumar Basic Pathology, p. 805
- Symmetric, inflammatory arthritis of small joints - PIPs, MCPs, wrists (DIPs almost never involved)
- Morning stiffness > 1 hour that improves with activity
- Soft tissue swelling, warmth, tenderness
- Systemic features: fatigue, anemia, low-grade fever
- Extra-articular: rheumatoid nodules, serositis, pulmonary fibrosis, vasculitis, Felty's syndrome
| Feature | Rheumatoid Arthritis | Osteoarthritis |
|---|---|---|
| Age of onset | Across age spectrum, peak in 50s | Increases with age |
| Morning stiffness | > 1 hour, improves with activity | < 30 min, pain increases with use |
| Joints affected | PIP, MCP, wrists (NOT DIP) | DIP (Heberden's), PIP (Bouchard's), knees, spine |
| Physical exam | Soft tissue swelling, warmth | Bony osteophytes, minimal swelling |
| X-ray | Marginal erosions, periarticular osteopenia | Osteophytes, subchondral sclerosis |
| Labs | Elevated CRP, positive RF, positive ACPA, anemia | Normal |
C. Seronegative Spondyloarthropathies
- Ankylosing spondylitis - chronic spinal inflammation leading to fusion ("bamboo spine")
- Psoriatic arthritis - arthritis with psoriasis, can affect DIP joints (distinguishing it from RA)
- Reactive arthritis (formerly Reiter's syndrome) - triggered by prior infection
- Enteropathic arthritis - associated with IBD (Crohn's, ulcerative colitis)
D. Crystal Arthropathies
- Caused by deposition of monosodium urate (MSU) crystals in joints
- Triggered by hyperuricemia (excess uric acid from purine metabolism or impaired renal excretion)
- MSU crystals activate the NLRP3 inflammasome → IL-1β → massive neutrophil influx → intense acute inflammation - Firestein & Kelley's Textbook of Rheumatology
- Classic presentation: acute, excruciating monoarthritis of the first metatarsophalangeal joint (podagra), red, swollen, hot
- Chronic gout leads to tophi (urate deposits in soft tissue) and chronic gouty arthritis
- Caused by calcium pyrophosphate dihydrate (CPPD) crystal deposition
- Favors knees and wrists; diagnosed by finding weakly positive birefringent crystals on joint fluid microscopy
E. Septic (Infectious) Arthritis
- Caused by bacterial infection of a joint space, usually acquired hematogenously
- Most common pathogen in adults: Staphylococcus aureus; in young sexually active adults: Neisseria gonorrhoeae
- Medical emergency - requires joint aspiration, IV antibiotics, sometimes surgical washout
- Presents with acute monoarthritis, fever, leukocytosis - Robbins & Kumar Basic Pathology, p. 805
F. Arthritis in Systemic Diseases
- SLE (Lupus): Symmetric inflammatory arthritis affecting knees, wrists, small hand joints in up to 90% of patients. Deformities (Jaccoud's arthropathy) can develop from ligament laxity rather than erosion - Firestein & Kelley's Textbook of Rheumatology, p. 4032
- Lyme disease: Caused by Borrelia burgdorferi; mono- or oligoarthritis, especially the knee; possible autoimmune component in chronic stages
3. Diagnosis
| Test | Relevant for |
|---|---|
| RF (rheumatoid factor) | RA (sensitivity 70-80%) |
| Anti-CCP (ACPA) | RA (specificity 85-99%) |
| ANA, anti-dsDNA | SLE |
| HLA-B27 | Spondyloarthropathies |
| Serum uric acid | Gout |
| Synovial fluid analysis | Crystal arthropathies, septic arthritis |
| X-ray, MRI, ultrasound | Structural damage, synovitis |
| CRP/ESR | Inflammatory activity |
4. Management Principles
- Non-pharmacological: weight loss, physiotherapy, exercise, joint protection
- Pharmacological: paracetamol, topical/oral NSAIDs, intra-articular corticosteroids or hyaluronic acid
- Surgical: joint replacement for severe disease
- A 2024 systematic review (PMID 38963824) covers current evidence for knee OA evaluation and management
- Treat early and aggressively - "tight control" to prevent joint damage
- DMARDs (Disease-Modifying Anti-Rheumatic Drugs): Methotrexate is the anchor drug
- Biologics: TNF inhibitors (etanercept, adalimumab, infliximab), IL-6 inhibitors (tocilizumab), B-cell depletion (rituximab), JAK inhibitors (tofacitinib, baricitinib)
- Short-term corticosteroids for flares
- Monitoring: regular CBC, LFTs, infection surveillance
- Acute attack: NSAIDs, colchicine, or corticosteroids
- Long-term urate lowering: allopurinol (xanthine oxidase inhibitor) or febuxostat
- IV antibiotics + joint drainage (aspiration or surgery) - urgent
5. Key Takeaway