
Ct vs mri in brain tumors radiology
brain tumor CT vs MRI radiology imaging comparison
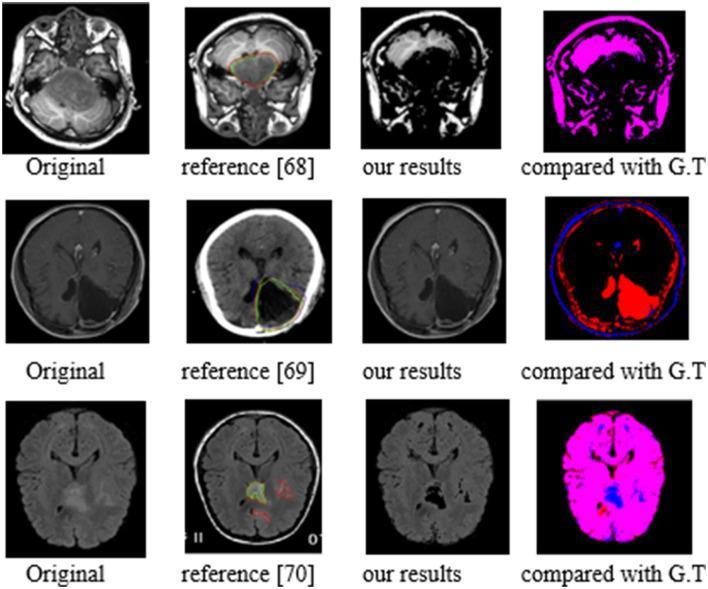
This medical comparison chart displays three rows of diagnostic brain imaging—specifically axial CT and MRI scans—demonstrating tumor segmentation performance. Each row follows a standard sequence: the 'Original' clinical image, a 'Reference' image with expert-annotated outlines (red/green), the 'Our Results' image showing the model's automated segmentation, and a 'Compared with G.T.' image visualizing spatial accuracy. Row 1 features a posterior fossa tumor; row 2 shows a large, hypodense intracranial mass with significant mass effect on CT; row 3 depicts a diffuse infiltrating glioma. The comparison column utilizes a color-coded overlap scheme where magenta indicates successful overlap between the model and the ground truth (G.T.), while distinct blue or red areas highlight regions of over-segmentation or under-segmentation. This visual material is used in neuro-oncology and radiology to evaluate the efficacy of computer-aided diagnostic algorithms in identifying and delineating brain tumors compared to established clinical reference standards.
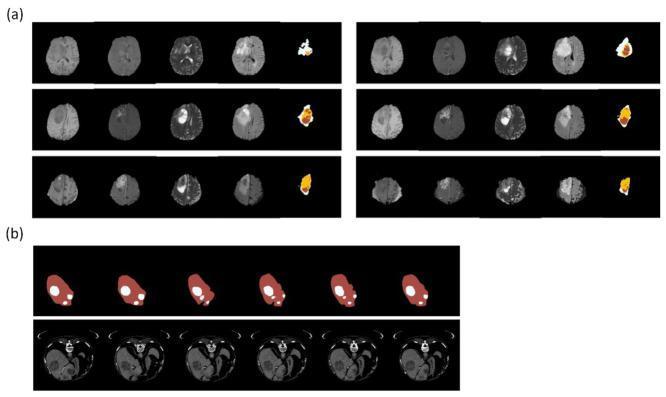
Educational comparison of medical imaging datasets for machine learning segmentation. (a) Brain Tumor Segmentation (BraTS) series demonstrating axial MRI modalities of glioblastoma multiforme. From left to right: T1-weighted (showing tumor hypointensity), T1-contrast enhanced (T1ce) (showing peripheral ring enhancement), T2-weighted (showing hyperintense tumor and edema), and FLAIR (Fluid-Attenuated Inversion Recovery) (suppressing CSF signal to highlight peritumoral edema). The rightmost column shows ground truth annotations: red for necrosis, yellow for active tumor, and white for perifocal edema. (b) Liver Tumor Segmentation (LiTS) series demonstrating axial CT scans of the upper abdomen. The bottom row shows raw CT images with visible hypodense hepatic lesions. The top row provides corresponding segmentation masks, where the liver parenchyma is outlined in red and hepatic tumors are marked in white. This clinical material is designed for training deep learning models in neuroradiology and abdominal radiology segmentation tasks.
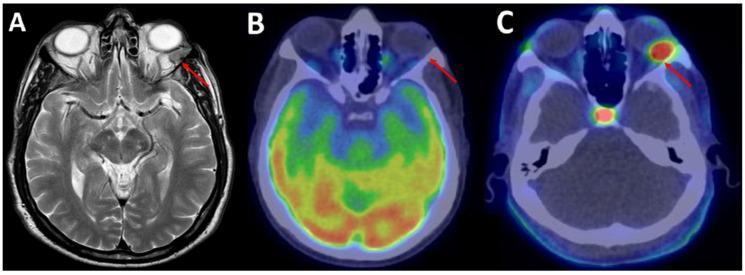
This diagnostic comparison image consists of three axial head scans (A, B, and C) illustrating a left supraorbital solitary fibrous tumor (SFT) recurrence in a 69-year-old male. Panel A is a T2-weighted contrast-enhanced MRI (T2c+) showing a small, rounded soft tissue lesion on the lateral aspect of the left orbit (red arrow). Panel B is an 18F-FDG PET/CT scan which demonstrates no significant radiopharmaceutical uptake at the lesion site (red arrow), obscured by the high physiological metabolic activity of the surrounding brain parenchyma. Panel C is an 18F-fluorocholine (18F-FCH) PET/CT scan, which reveals intense focal radiopharmaceutical uptake (SUVmax 6.8) in the same supraorbital lesion (red arrow). The series demonstrates the clinical utility of 18F-FCH PET/CT over 18F-FDG PET/CT for detecting certain mesenchymal tumors like SFTs, highlighting its superior tumor-to-background ratio due to low physiological choline uptake in normal brain tissue. This comparison is essential for understanding advanced oncological imaging in neuro-ophthalmology and radiology.
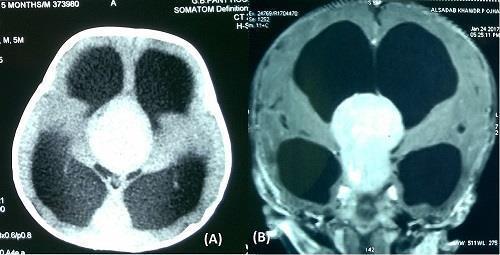
This diagnostic imaging comparison consists of two axial brain scans from a 4-month-old infant: (A) a non-contrast computed tomography (CT) scan and (B) a contrast-enhanced T1-weighted magnetic resonance image (MRI). Both modalities reveal a large, well-defined mass located in the suprachiasmatic region with superior extension into the third ventricle. In the CT scan, the tumor appears as a hyperdense mass relative to the surrounding brain parenchyma. The contrast-enhanced MRI demonstrates intense, homogenous enhancement of the lesion, suggesting a highly vascular or blood-brain barrier-disrupted tumor such as an optico-chiasmatic glioma. Significant secondary features include massive obstructive hydrocephalus, evidenced by the severe symmetrical dilatation of the lateral ventricles (appearing as large hypodense areas on CT and dark signal on T1 MRI). The imaging illustrates the utility of MRI over CT for superior soft-tissue contrast and anatomical delineation of midline pediatric brain tumors and their relationship to the ventricular system.
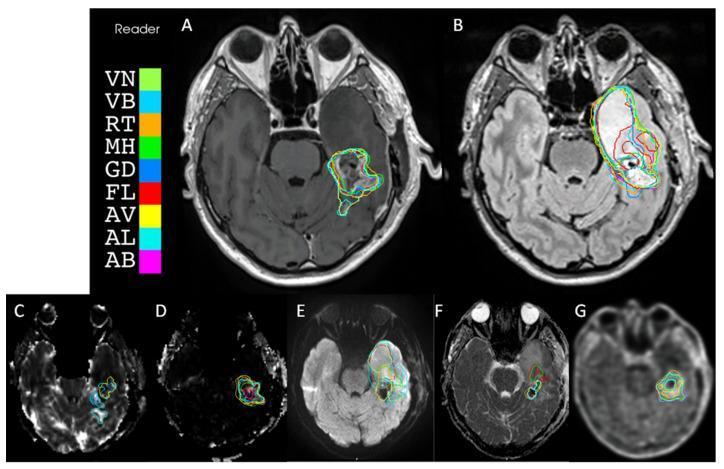
This composite diagnostic image displays axial brain imaging modalities used to evaluate a contrast-enhancing lesion in the left temporal-frontal region, likely a high-grade glioma. The panel illustrates multi-parametric MRI and PET/CT sequences including: (A) T1-weighted gadolinium-enhanced MRI showing a ring-enhancing mass with central necrosis; (B) T2-FLAIR showing hyperintense peritumoral edema; (C) Relative cerebral blood volume (rCBV) and (D) K2 permeability maps indicating tumor vascularity; (E) Diffusion-weighted imaging (DWI b1000) and (F) Apparent Diffusion Coefficient (ADC) map assessing cellularity and restricted diffusion; and (G) 18F-FET PET/CT showing metabolic activity via radiotracer uptake. Each image features superimposed color-coded contours representing volume segmentations from ten different readers (VN, VB, RT, MH, GD, FL, AV, AL, AB). The visual comparison highlights inter-observer variability in defining tumor boundaries across morphological, functional, and metabolic imaging. This material is designed for neuro-radiology and oncology education, specifically regarding target volume delineation and the integration of advanced imaging in neuro-oncology workflows.
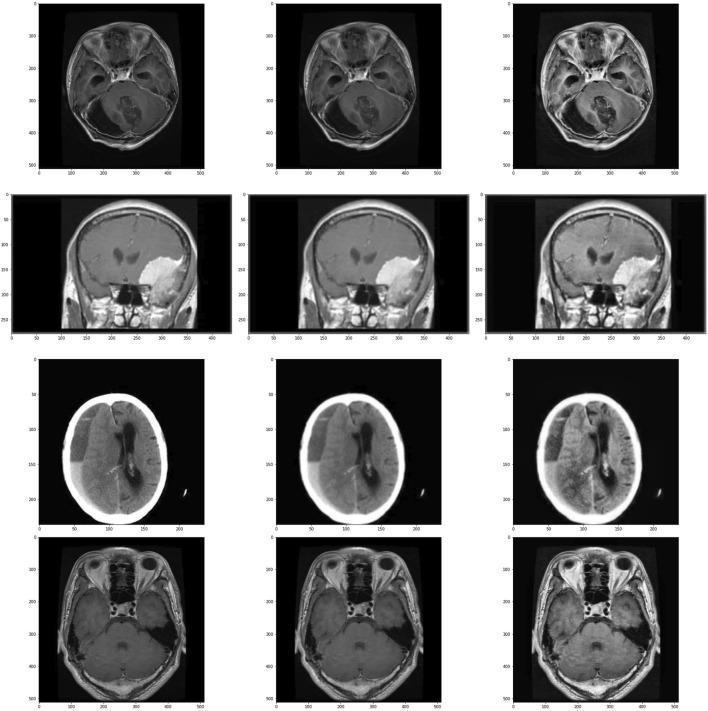
A comparison chart showcasing medical neuroimaging preprocessing stages for brain tumor classification. The grid displays four clinical cases (rows) across three imaging states (columns). Column 1 shows original axial and coronal diagnostic images, including MRI and CT modalities. Column 2 demonstrates the application of a Gaussian blur for noise reduction, resulting in softened edges. Column 3 displays the final stage using Contrast Limited Adaptive Histogram Equalization (CLAHE) to enhance local contrast and edge definition of pathological features. The rows categorize specific conditions: Row 1 illustrates a glioma with associated mass effect; Row 2 shows a large, hyperintense meningioma with distinct borders; Row 3 represents a 'no tumor' control case showing normal neuroanatomy or non-neoplastic changes; and Row 4 depicts a pituitary tumor located in the sellar region. This visual is designed for medical AI and radiology education, focusing on image enhancement techniques to improve the detection and differentiation of intracranial neoplasms.
glioma MRI sequences T1 T2 FLAIR gadolinium enhancement
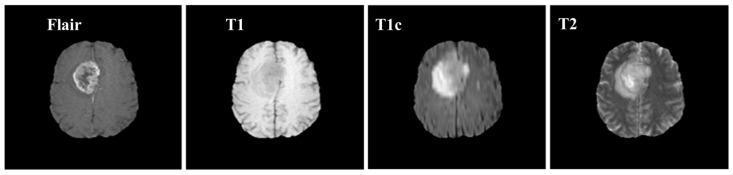
This diagnostic image set showcases axial brain Magnetic Resonance Imaging (MRI) across four distinct modalities: Fluid-Attenuated Inversion Recovery (FLAIR), T1-weighted (T1), T1-weighted contrast-enhanced (T1c), and T2-weighted (T2) sequences. The comparison illustrates a large neoplastic lesion, likely a glioma, in the right hemisphere. In the T1 sequence, the lesion appears hypointense relative to healthy white matter. The T1c (gadolinium-enhanced) image demonstrates significant contrast enhancement, indicating a breakdown of the blood-brain barrier within the tumor core. The T2-weighted image shows the lesion and surrounding vasogenic edema as hyperintense (bright) signals, reflecting high fluid content. The FLAIR sequence effectively suppresses the signal from cerebrospinal fluid (CSF) while maintaining hyperintensity in the peritumoral edema, allowing for clearer differentiation between the pathological mass and surrounding fluid-filled spaces. This multi-parametric approach is fundamental in neuroradiology for assessing tumor margins, vascularity, and associated tissue changes for clinical diagnosis and surgical planning.
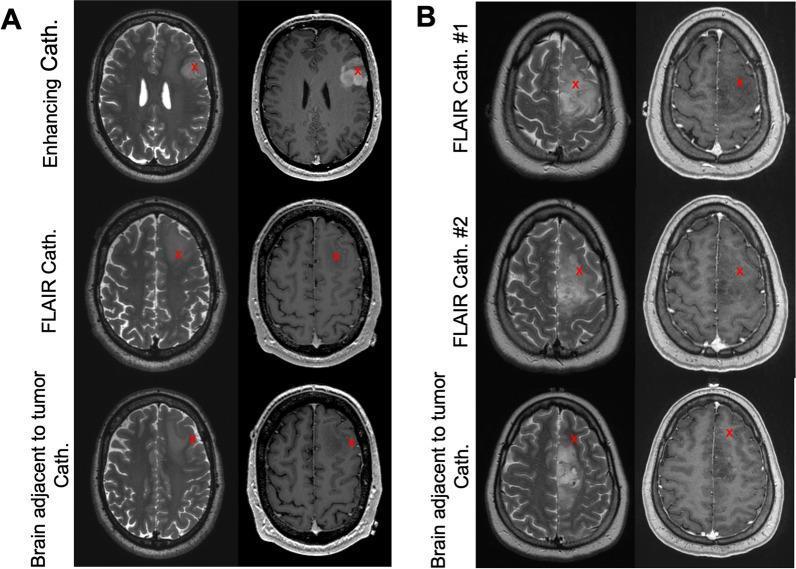
This diagnostic imaging set consists of axial brain MRI scans from two different patients (Panels A and B), displaying T2 Fluid-Attenuated Inversion Recovery (FLAIR) sequences on the left and T1-weighted post-contrast (gadolinium) sequences on the right. The images illustrate pre-operative surgical planning for stereotactic microdialysis catheter placement in gliomas. Red 'X' markers denote the targeted sampling locations. In Panel A (Enhancing Tumor), the scans demonstrate a lesion in the left hemisphere. The T2 FLAIR shows diffuse hyperintensity encompassing both the tumor core and surrounding vasogenic edema, while the T1-weighted post-contrast sequence reveals a specific focal area of vivid enhancement. Panel B (Non-Enhancing Tumor) shows a large right-sided lesion characterized by significant FLAIR hyperintensity but a lack of contrast enhancement on T1-weighted images. The targets categorized include 'Enhancing Cath' (contrast-positive tumor), 'FLAIR Cath' (hyperintense but non-enhancing tumor), and 'Brain adjacent to tumor Cath' (peritumoral tissue with normal signal intensity). These images serve to teach radiographic differentiation of glioma sub-regions based on blood-brain barrier integrity and fluid content.
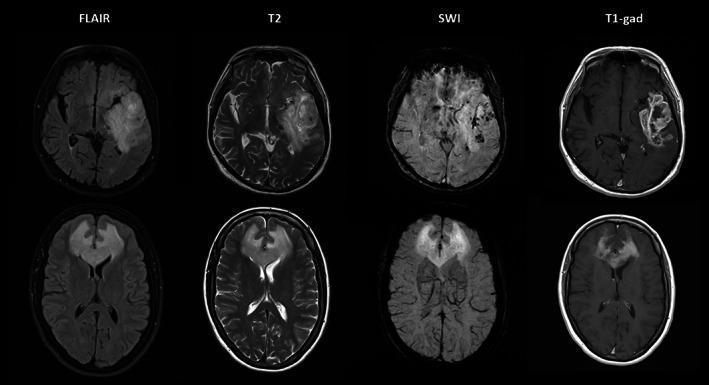
A comparative diagnostic MRI panel presenting two different cases of brain neoplasms across four imaging modalities: FLAIR, T2-weighted, Susceptibility-Weighted Imaging (SWI), and T1-gadolinium enhanced (T1-gad). The top row illustrates a high-grade glioma in the left temporal lobe. The FLAIR and T2 images show a hyperintense mass with surrounding edema. Crucially, the SWI sequence reveals prominent dark spots known as intratumoral susceptibility signals (ITSS), indicative of microhemorrhage and neovascularization, while the T1-gad sequence shows a heterogeneous, peripheral enhancement pattern typical of high-grade gliomas. The bottom row demonstrates a primary CNS lymphoma located in the frontal lobes/corpus callosum. While the FLAIR and T2 images show hyperintensity, the SWI sequence is notably clear of ITSS. The T1-gad image exhibits marked, homogeneous enhancement, a classic feature that distinguishes lymphoma from the more heterogeneous appearance of a glioma. This panel serves as an educational tool for neuroradiology, highlighting how SWI sequences can differentiate tumor types based on the presence or absence of internal vascular complexity and blood products.
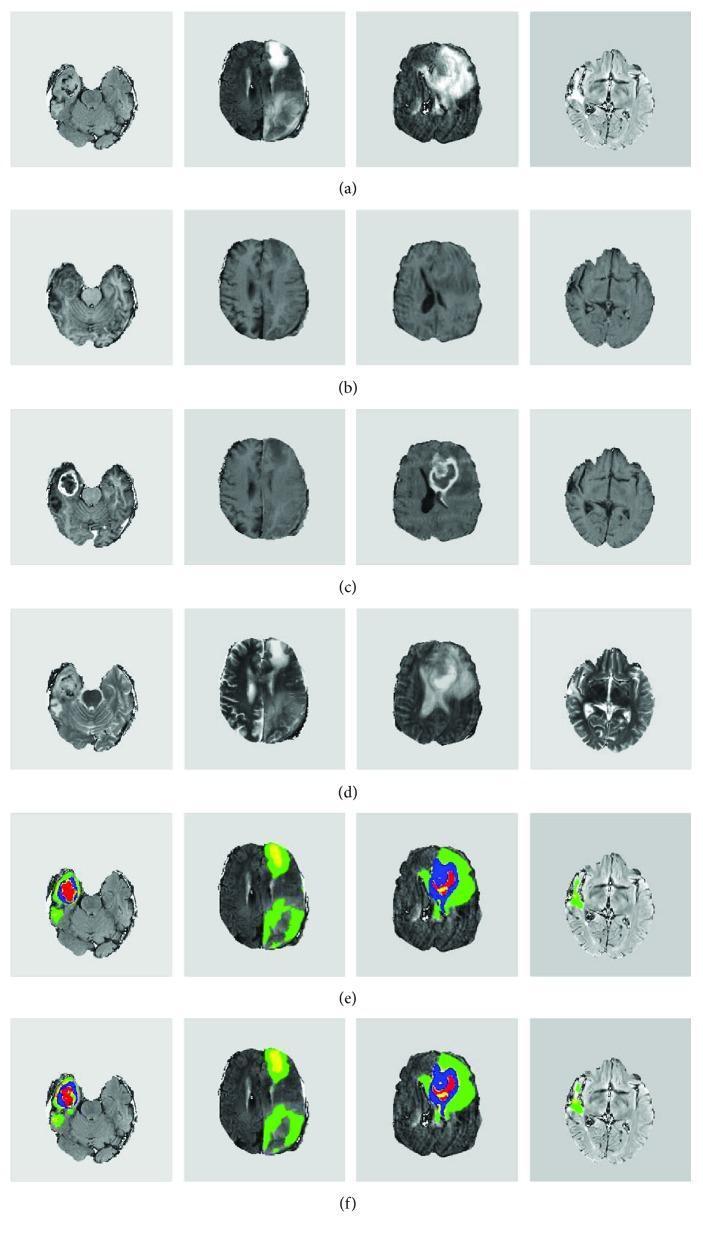
This diagnostic image displays a multi-row comparison of brain MRI sequences and automated tumor segmentation results for four clinical cases of glioma. Rows (a) through (d) illustrate axial slices in different imaging modalities: FLAIR (Fluid-Attenuated Inversion Recovery), T1-weighted, T1-weighted contrast-enhanced (T1c), and T2-weighted sequences. The FLAIR and T2 images highlight hyperintense areas corresponding to vasogenic edema and tumor bulk, while the T1c images reveal regions of blood-brain barrier disruption via gadolinium enhancement. Rows (e) and (f) present a comparison between the ground truth (expert manual segmentation) and computer-generated segmentation results, both overlaid on the FLAIR sequence. The segmentation utilizes a color-coded classification system to identify distinct intratumoral pathologies: red denotes necrosis (central core), green identifies peritumoral edema, yellow represents non-enhancing tumor tissue, and blue indicates the enhancing tumor components. The visualization demonstrates the clinical application of deep learning (FCN and CNN) in characterizing heterogeneous brain tumor subregions for neuro-oncological assessment and treatment planning.
brain CT scan tumor hemorrhage calcification hyperdense
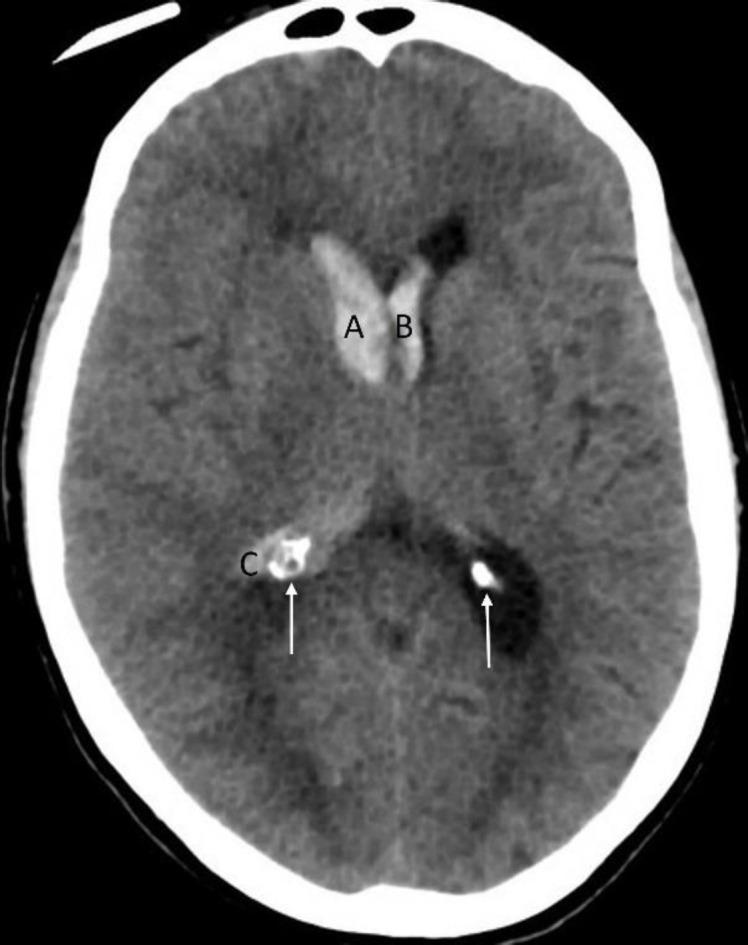
This diagnostic image is a non-contrast axial Computed Tomography (CT) scan of the brain, demonstrating the differentiation between acute intracranial hemorrhage and physiological calcification. The scan shows hyperdense areas within the lateral ventricles, labeled A and B, which represent intraventricular extension of an acute bleed. These areas exhibit high attenuation relative to the surrounding brain parenchyma and cerebrospinal fluid. In contrast, the regions marked with arrows, including area C, represent physiologic calcification of the choroid plexus. A key educational feature of this image is the density comparison: while the acute hemorrhage (A and B) is hyperdense, the choroid plexus calcification (C) is significantly more radiodense, with an attenuation profile paralleling that of the calvarium (skull bone). This comparison is critical for neuroradiological assessment of elderly patients presenting with potential stroke or traumatic brain injury. The image serves as an educational tool for identifying intraventricular hemorrhage and distinguishing it from common benign intracranial calcifications.
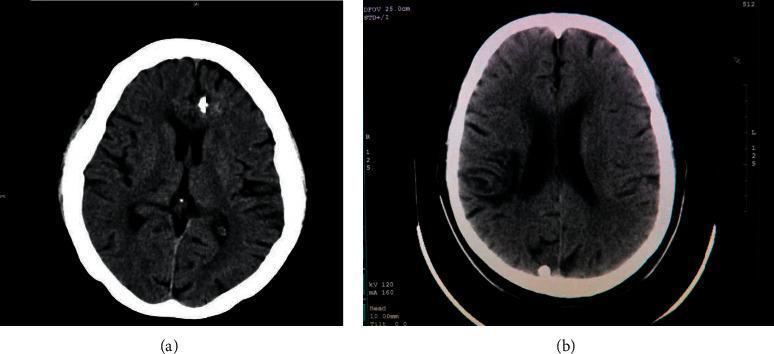
This diagnostic image shows a side-by-side comparison of axial non-contrast Computed Tomography (CT) scans of the brain. Image (a) depicts a patient diagnosed with a Primitive Neuroectodermal Tumor (PNET), demonstrating a focal, hyperdense (bright white) lesion in the right frontal lobe near the midline. This hyperdensity may represent calcification or acute hemorrhage within the tumor mass, common features in PNET pathology. Image (b) shows a healthy control with normal intracranial density and symmetrical structures. In both scans, the bony calvarium appears intact and the ventricular system is visible. The PNET scan (a) shows slightly less distinct cortical sulci in the region surrounding the hyperdense lesion, potentially suggesting mild localized vasogenic edema or mass effect. This comparison serves as an educational tool for neuroradiology to identify abnormal intracranial densities and recognize the radiographic presentation of pediatric or adult neuroectodermal malignancies.
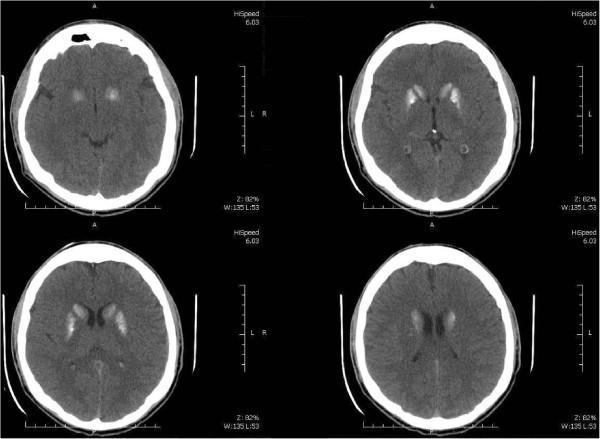
This diagnostic image is a non-contrast computed tomography (CT) scan of the brain, presented in four axial sections. The imaging reveals prominent, bilateral, and highly symmetrical hyperdense areas within the basal ganglia, specifically involving the putamen and the caudate nuclei. These hyperdensities are consistent with intracranial calcifications. There is no evidence of mass effect, midline shift, or acute intracranial hemorrhage visible in these slices. The distribution of these calcifications is a key clinical finding often associated with metabolic disorders, such as primary hypoparathyroidism or Fahr's syndrome. This content is suitable for neurological and radiological education regarding the identification of ectopic intracranial calcification and its anatomical localization within the deep gray matter structures.
MRI brain perfusion spectroscopy DWI advanced tumor grading
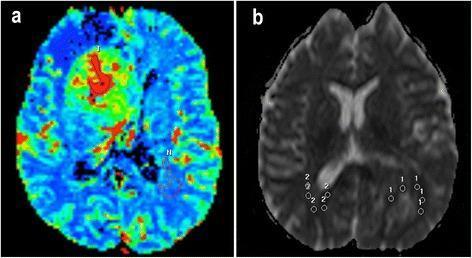
This diagnostic imaging composite illustrates the radiological assessment of a high-grade glioblastoma using advanced MRI sequences. Panel (a) presents a Perfusion-Weighted Imaging (PWI) parametric map for calculating the relative Cerebral Blood Volume (rCBV) ratio. The pseudocolor map shows a hyperperfused mass in the right frontal region, with a red/orange core (ROI labeled 'T') indicating high cerebral blood volume, compared to the contralateral healthy white matter (ROI labeled 'N') shown in blue. Panel (b) displays a Diffusion-Weighted Imaging (DWI) Apparent Diffusion Coefficient (ADC) map for calculating the relative ADC (rADC) ratio. Multiple circular regions of interest (ROIs) are placed within the solid tumor area (labeled '1') and the contralateral healthy cerebral parenchyma (labeled '2'). The visual comparison highlights tumor-related changes in perfusion and diffusion, which are critical for grading primary brain tumors, identifying neovascularization, and differentiating solid tumor from necrosis or edema.
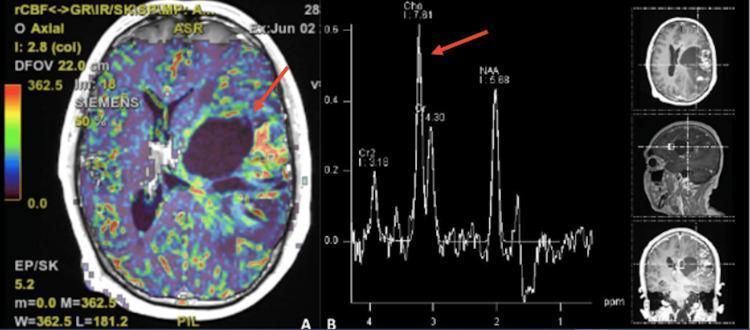
This composite diagnostic image illustrates advanced neuroimaging of an intra-axial brain tumor. Panel A displays a cranial perfusion MRI in the axial plane, specifically a regional cerebral blood flow (rCBF) map. An arrow points to the tumor's periphery, which exhibits hypervasculature characterized by high-intensity red and yellow hues on the color-coded scale, indicating significantly increased perfusion compared to the surrounding blue-toned parenchyma. Panel B presents a Magnetic Resonance Spectroscopy (MRS) plot representing the central tumor area. The spectrum shows a pathognomonic 'inversion' of the metabolite curve, where the Choline (Cho) peak is significantly elevated relative to the N-acetylaspartate (NAA) and Creatine (Cr) peaks. This Cho/NAA ratio elevation is a hallmark of high cellular turnover and malignancy. Accompanying the spectroscopy plot are three anatomical reference scouts (axial, sagittal, and coronal) demonstrating the tumor's localization in the mesial temporal and insular regions. These findings are characteristic of high-grade gliomas or hypervascular intracranial lesions.
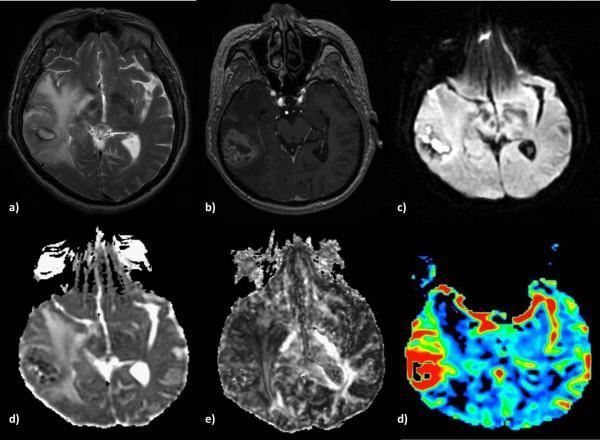
Multi-parametric MRI sequence of a 71-year-old male brain demonstrating an Anaplastic Astrocytoma. (a) Axial T2-weighted image shows a large, hyperintense lesion in the right hemisphere with significant peritumoral vasogenic edema. (b) Post-contrast 3D-SPGR image reveals a mass with heterogeneous, non-uniform contrast enhancement, suggesting variable blood-brain barrier disruption. (c) Diffusion-weighted imaging (DWI) shows high signal intensity in the solid tumor portion, which corresponds to hypointensity on the Apparent Diffusion Coefficient (ADC) map (d), indicating restricted diffusion and high cellularity. (e) Fractional Anisotropy (FA) map displays low values within the lesion, reflecting loss of white matter structural integrity. (f) Relative Cerebral Blood Volume (rCBV) perfusion map shows increased regional blood flow (red areas) indicating tumor neoangiogenesis. This series illustrates the diagnostic imaging features of a Grade III high-grade glioma, emphasizing the use of advanced physiological MRI for tumor grading.
CT vs MRI in Brain Tumor Radiology
Overview
The Core Textbook Figure: CT vs MRI Side by Side
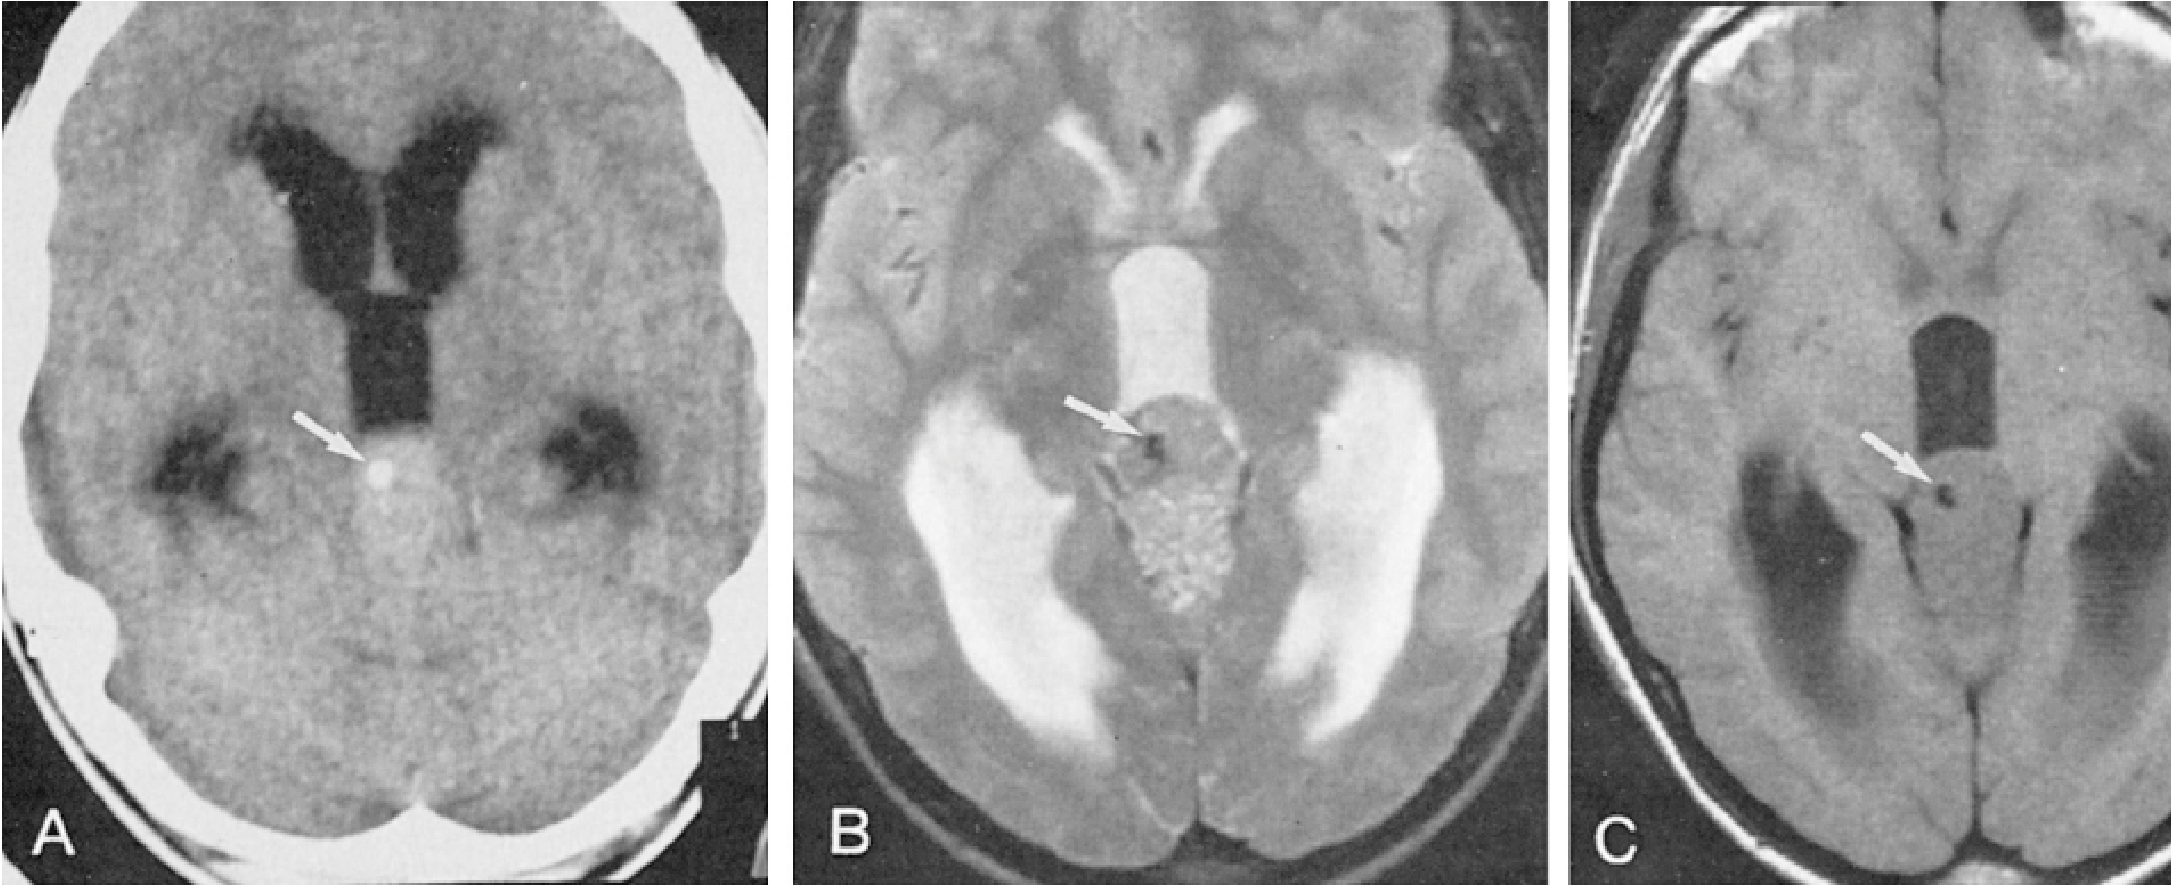
Figure (Kaplan & Sadock's Synopsis of Psychiatry): A - CT scan: CSF appears black, brain gray, skull white. Poor gray/white matter discrimination. The arrow shows a calcified pineal tumor (CT is superior for calcification). B - T2 MRI: CSF appears white, gray matter distinguished clearly from white matter. Much more structural detail than CT. C - T1 MRI: CSF dark, brain uniformly gray; most similar to CT but without its limitations.
1. CT in Brain Tumors
How it works
Strengths
| Feature | Why CT Excels |
|---|---|
| Calcification | CT is superior to MRI - calcification appears hyperdense and is often invisible on MRI |
| Acute hemorrhage | Fresh blood is hyperdense - essential in emergency presentation |
| Bone involvement | Skull base erosion, hyperostosis (meningioma), bony metastases |
| Speed & availability | Available 24/7 in every ER; fast acquisition |
| Patients with pacemakers/implants | No contraindication to magnetic fields |
| Obese or claustrophobic patients | Easier to perform |
| Hydrocephalus detection | Ventricular dilatation is quickly assessed |
CT with IV contrast (iodinated agents)
2. MRI in Brain Tumors
How it works
Routine MRI Sequences and Their Roles
| Sequence | Appearance | Main Use in Brain Tumors |
|---|---|---|
| T1 | CSF dark, fat bright | Baseline anatomy; best for gadolinium contrast enhancement |
| T1 + Gad (Gd-DTPA) | Enhancing tumor appears white | Shows BBB breakdown, active tumor, leptomeningeal spread |
| T2 | CSF bright, brain dark, abnormal tissue bright | Detects edema, infiltration, cysts - best for seeing tumor extent |
| FLAIR | CSF suppressed, lesions remain bright | Detects perilesional edema, cortical infiltration, differentiates edema from CSF |
| DWI / ADC | Restricted diffusion bright on DWI | Detects hypercellular tumors (lymphoma), necrosis vs viable tumor |
| SWI | Hemorrhage / calcification dark | Intratumoral hemorrhage, neovascularization (ITSS in high-grade glioma) |
| Perfusion (DSC/DCE) | rCBV maps | Tumor grading (↑ rCBV = high-grade), recurrence vs radiation necrosis |
| MR Spectroscopy (MRS) | Metabolite peaks | Cho/NAA ratio ↑ in tumor; differentiates tumor from abscess/demyelination |
3. Advanced MRI for Grading and Characterization
High-Grade Glioma (GBM, Grade 4)
- T1 Gad: Thick, irregular ring enhancement with central necrosis
- T2/FLAIR: Extensive surrounding edema
- DWI/ADC: Restricted diffusion in solid tumor portions
- Perfusion (rCBV): Markedly elevated (neoangiogenesis)
- MRS: High Cho/NAA ratio, lipid/lactate peaks indicating necrosis
CNS Lymphoma vs Glioma (distinguished by MRI)
- Lymphoma: Homogeneous enhancement, no SWI signal loss (no ITSS), diffusion restriction
- High-grade glioma: Heterogeneous enhancement, prominent ITSS on SWI (microhemorrhage, neovascularization)
Enhancing vs Non-Enhancing Glioma
- Lower grade gliomas may show FLAIR hyperintensity without enhancement on T1+Gad - this indicates intact BBB but infiltrative tumor
- High-grade tumors show both FLAIR signal and contrast enhancement
4. Head-to-Head Comparison Table
| Feature | CT | MRI |
|---|---|---|
| Soft tissue contrast | Poor | Excellent |
| Gray-white differentiation | Limited | Clearly visible |
| Calcification | Superior | Poor (dark on all sequences) |
| Acute hemorrhage | Excellent (hyperdense) | Good (SWI best) |
| Bone/skull base | Superior | Limited (bone appears black) |
| Tumor extent / edema | Limited | Excellent (T2/FLAIR) |
| BBB disruption | Iodinated contrast (some risk) | Gadolinium (safer) |
| Posterior fossa / brainstem | Limited (beam hardening) | Superior |
| Tumor grading | Cannot grade | Perfusion, DWI, MRS allow functional grading |
| Leptomeningeal spread | Cannot detect reliably | T1 Gad excellent |
| Recurrence vs radiation necrosis | Cannot differentiate | Perfusion/spectroscopy can differentiate |
| Speed | Minutes | 30-60 minutes |
| Cost | Lower | Higher |
| Availability | Universal | Less available (rural/emergency settings) |
| Contraindications | Iodine allergy, radiation dose | Pacemakers, cochlear implants, ferromagnetic implants |
| Claustrophobia | Minimal | Significant |
5. When to Use Which
Use CT first when:
- Emergency presentation (acute headache, neurological deficit, trauma)
- Suspected acute hemorrhage within a tumor
- Assessing bony destruction or hyperostosis
- Screening when MRI is contraindicated
- Detecting calcification (oligodendroglioma calcifies in ~90% of cases - an important diagnostic clue)
Use MRI for:
- Full characterization and extent of any brain tumor
- Surgical planning (eloquent cortex mapping with fMRI)
- Tumor grading (perfusion, DWI, MRS)
- Detecting small lesions and metastases (contrast-enhanced MRI far surpasses CT)
- Posterior fossa and brainstem tumors
- Follow-up after treatment
- Differentiating tumor recurrence from radiation necrosis
6. Specific Tumor Types and Preferred Modality
| Tumor | CT Findings | MRI Advantage |
|---|---|---|
| Glioblastoma (GBM) | Hypodense mass, ring enhancement | Shows full extent, satellite lesions, eloquent involvement |
| Oligodendroglioma | Calcification (90%) - CT picks this up | Grades infiltration extent |
| Meningioma | Hyperostosis, calcification, homogeneous enhancement | Dural tail sign, sinus invasion, en plaque assessment |
| Medulloblastoma | Hyperdense in posterior fossa | Better posterior fossa visualization, CSF seeding |
| Brain metastases | Misses small lesions | Triple-dose gadolinium MRI detects even small metastases |
| CNS Lymphoma | Hyperdense periventricular mass | DWI, SWI, MRS differentiate from glioma |
| Pituitary tumors | Limited | MRI is modality of choice (dynamic contrast for microadenomas) |
| Pediatric tumors | CT useful for hydrocephalus/emergencies | MRI preferred (no radiation, better characterization) |
Enumerate and discuss imaging of intraventricularvtumors in adults
intraventricular tumor adult MRI CT lateral ventricle third ventricle
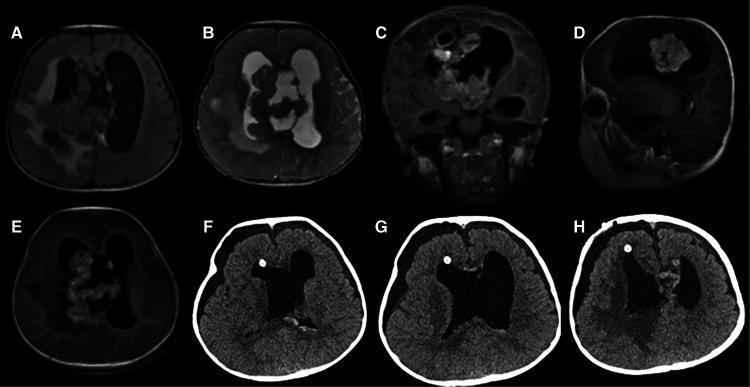
This composite figure displays preoperative MRI and postoperative CT scans of a pediatric brain tumor, specifically an Atypical Teratoid/Rhabdoid Tumor (AT/RT). Preoperative MRI sequences (A-E) show a large, irregular mass centered in the right lateral ventricle with intraventricular extension and secondary hydrocephalus. The tumor appears isointense on axial T1 (A) and T2-weighted (B) images. Following gadolinium administration, coronal (C), sagittal (D), and axial (E) T1-weighted images demonstrate heterogeneous hyperintense contrast enhancement and cystic or necrotic components. The mass occupies a significant portion of the lateral ventricles and extends toward the third ventricle. Postoperative axial CT scans (F-H) illustrate the results following gross total resection. Key findings include bilateral ventricular enlargement and several nodular, high-density foci along the ventricular walls, representing postoperative changes, surgical material, or potential residual calcified abnormalities. A hyperdense shunt or drain tip is visible in the right frontal horn. These images serve as an educational example of intraventricular embryonic tumors and the importance of multi-planar imaging in surgical planning and postoperative evaluation.
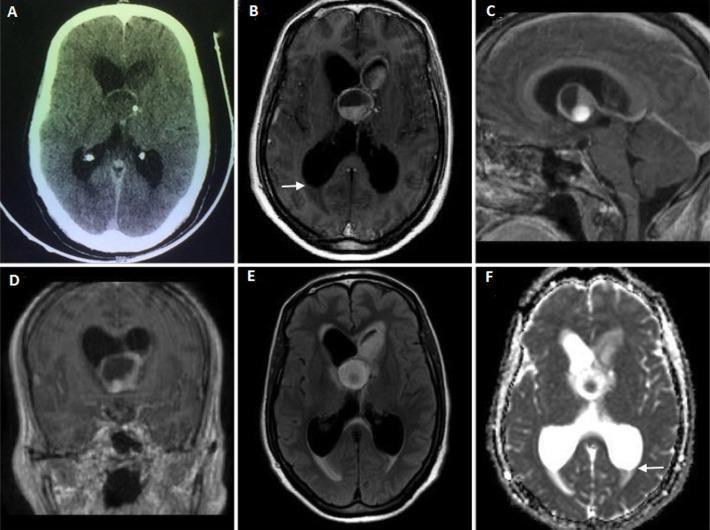
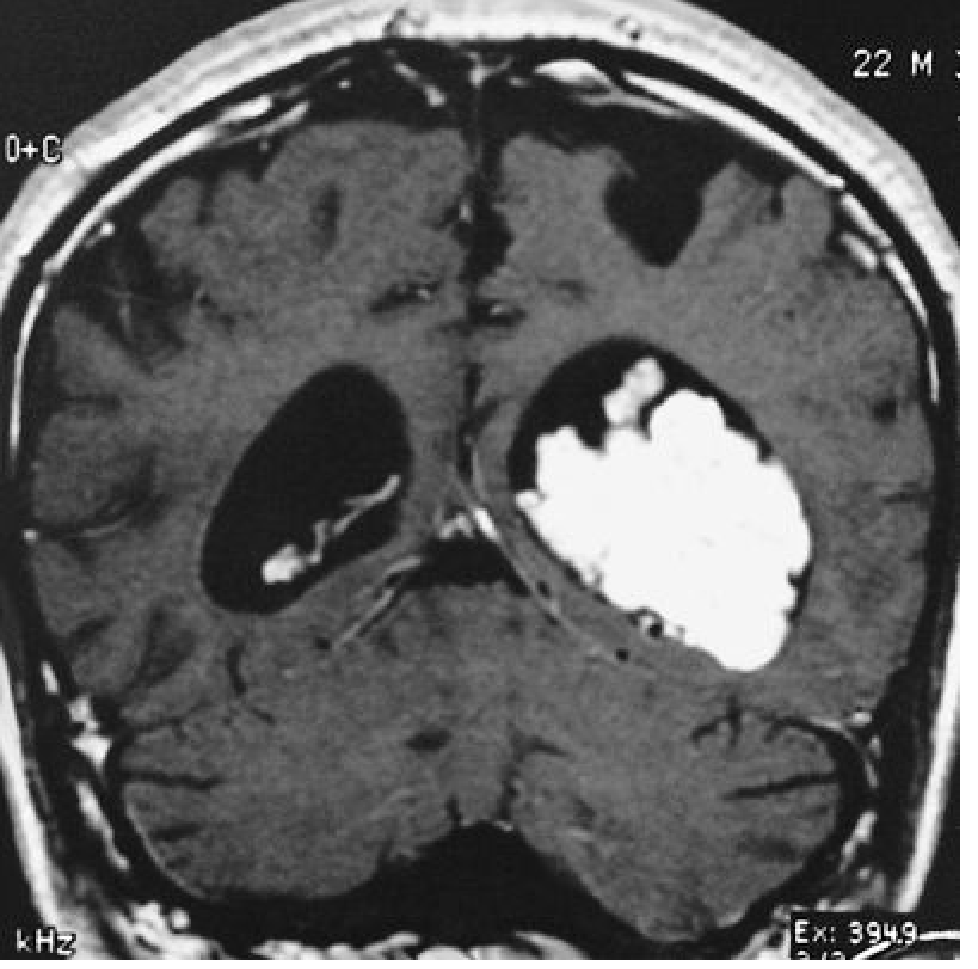
A multi-modal neuroimaging compilation (CT and MRI) illustrating a complex intraventricular lesion. Image A (axial contrast-enhanced CT) shows an isodense mass in the third ventricle with focal calcification and peripheral rim enhancement, causing obstructive hydrocephalus of the lateral ventricles. Images B, C, and D provide axial, sagittal, and coronal T1-weighted post-contrast MR sequences, revealing a bilobate cystic lesion involving the third ventricle and extending into the left frontal horn. This lesion demonstrates a distinctive fluid-fluid level and mild peripheral rim enhancement. Image E (FLAIR) highlights heterogeneous internal signal intensity with both hyperintense and hypointense components. Image F (ADC map) demonstrates restricted diffusion in the inferior portion of the lesion and shows dependent debris forming fluid-fluid levels within the occipital horns (white arrows), suggesting intraventricular rupture of an abscess or complex cyst. These findings are clinically relevant for differentiating between intraventricular cystic neoplasms, such as colloid cysts or craniopharyngiomas, and infectious processes like tuberculous brain abscesses.
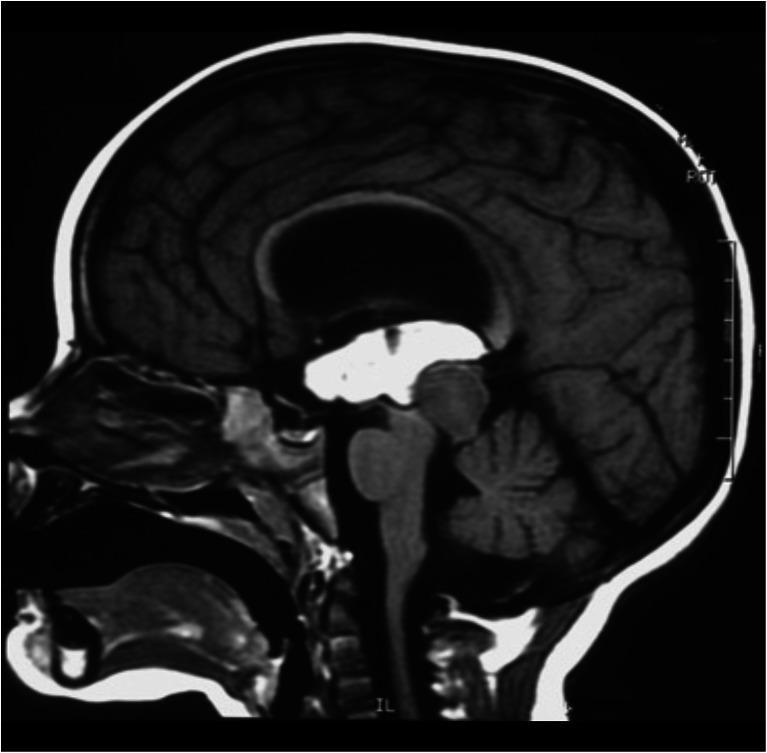
This diagnostic image is a sagittal T1-weighted MRI (or non-contrast CT) of the head, focusing on the midline brain structures. The most prominent finding is a large, irregularly shaped hyperintense region filling the third ventricle and extending into the lateral ventricles, consistent with acute intraventricular hemorrhage (IVH). A mass lesion is visible in the region of the quadrigeminal plate (tectal plate), representing a known pilocytic astrocytoma. The hemorrhage is a post-procedural complication following an endoscopic biopsy of this lesion. Significant ventriculomegaly is present, indicating obstructive hydrocephalus likely secondary to the combined mass effect of the tumor and the subsequent hemorrhage on the cerebral aqueduct. Anatomical landmarks clearly visible include the corpus callosum, midbrain, pons, medulla, and cerebellum. The hyperintense blood material creates a sharp contrast against the hypointense cerebrospinal fluid and isointense brain parenchyma. This image serves as a clinical illustration of acute complications in neuro-oncology and the resulting alterations in ventricular morphology.
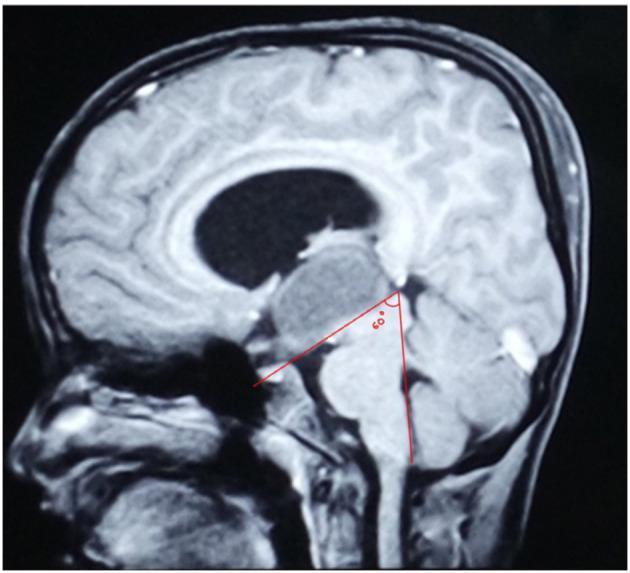
Midsagittal MRI of an 8-year-old boy demonstrating a purely intraventricular craniopharyngioma. The image reveals a large, well-circumscribed, mixed-signal mass within the third ventricle, causing inferior bulging of the ventricular floor and significant mass effect on the hypothalamus and suprasellar region. The overlying lateral ventricles show signs of hydrocephalus. Superimposed red lines illustrate the measurement of the Mamillary Body Angle (MBA), recorded here at 60 degrees. This angle is formed by the intersection of a plane tangential to the base of the mamillary body and a plane tangential to the fourth ventricular floor. Key anatomical landmarks visible include the corpus callosum, brainstem, cerebellum, and the patent suprasellar cistern, which remains distinct from the inferior boundary of the tumor. The optic chiasm is displaced downward, a hallmark of strictly intraventricular lesions. This radiological presentation is used to differentiate purely intraventricular tumors from those with primary suprasellar origins.
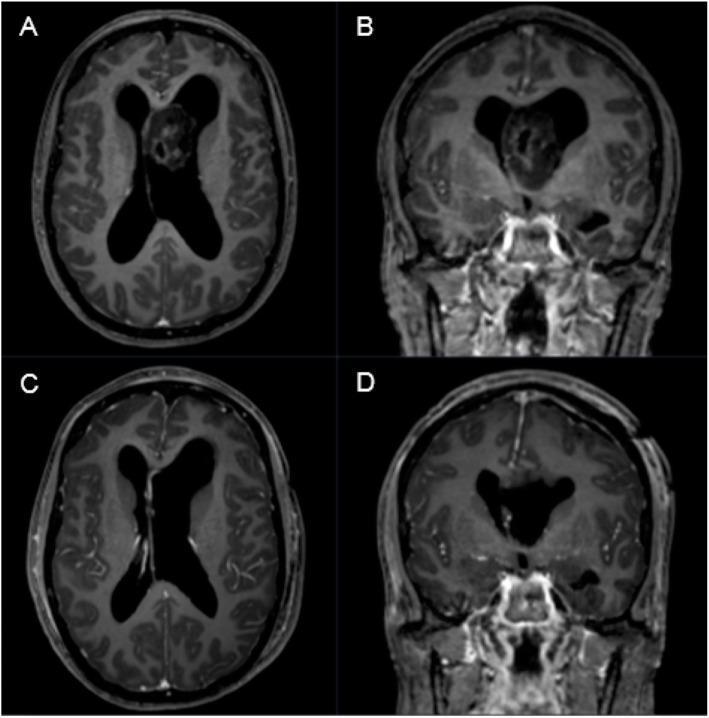
This diagnostic imaging panel consists of four T1-weighted gadolinium-enhanced MRI scans (axial and coronal views) demonstrating a case of a third ventricle tumor and its postoperative outcome. Figures A (axial) and B (coronal) show a preoperative heterogeneously enhancing, low-to-intermediate signal intensity mass within the third ventricle. This intraventricular lesion causes significant obstructive hydrocephalus, evidenced by the marked enlargement of the lateral ventricles. Figures C (axial) and D (coronal) display postoperative results following a left frontal transventricular keyhole resection. These images confirm gross total removal of the tumor, resolution of the third ventricle occupancy, and a subsequent reduction in the size of the ventricular system, indicating improved cerebrospinal fluid flow. The case is pathologically identified as a WHO grade I subependymoma. This educational sequence illustrates the radiological presentation of a rare benign neuroepithelial tumor and the effectiveness of surgical intervention in managing secondary hydrocephalus.
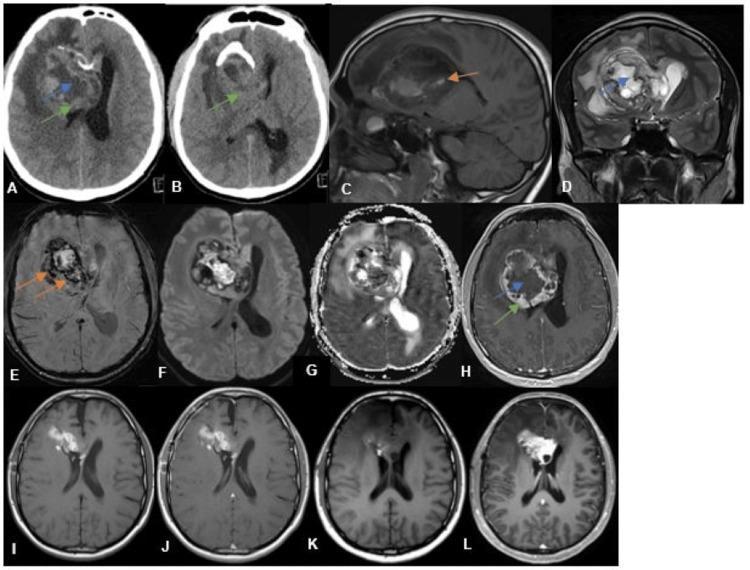
A comprehensive longitudinal radiological panel consisting of CT and MRI sequences (A-L) documenting the progression of a right intraventricular tumor. Pre-operative imaging (A-H) reveals a large, heterogeneous mass occupying the frontal horn and body of the right lateral ventricle. The lesion exhibits internal calcifications on axial CT (A, B), T1-hypointensity (C), and T2-hyperintensity (D) with evident cystic/necrotic areas (blue arrows), hemorrhagic foci on SWI (E, orange arrows), and a solid peripheral component (green arrows) showing restricted diffusion on DWI/ADC (F, G) and prominent post-contrast enhancement on T1 (H). Associated findings include perilesional edema and obstructive hydrocephalus with sulcal effacement. Post-operative axial T1 images (I, J) demonstrate gross total resection with residual subacute blood products in the resection cavity. Delayed follow-up images (K, L) seven months post-surgery show a new, enhancing intraventricular mass at the original site, indicative of local tumor recurrence. This imaging series illustrates the diagnostic features, surgical outcome, and natural history of a high-grade intraventricular neoplasm.
central neurocytoma septum pellucidum lateral ventricle MRI
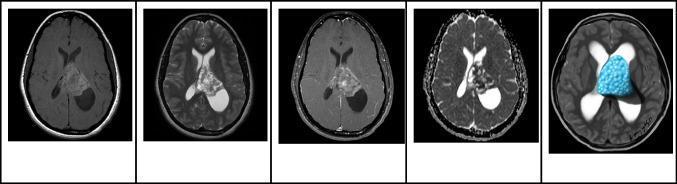
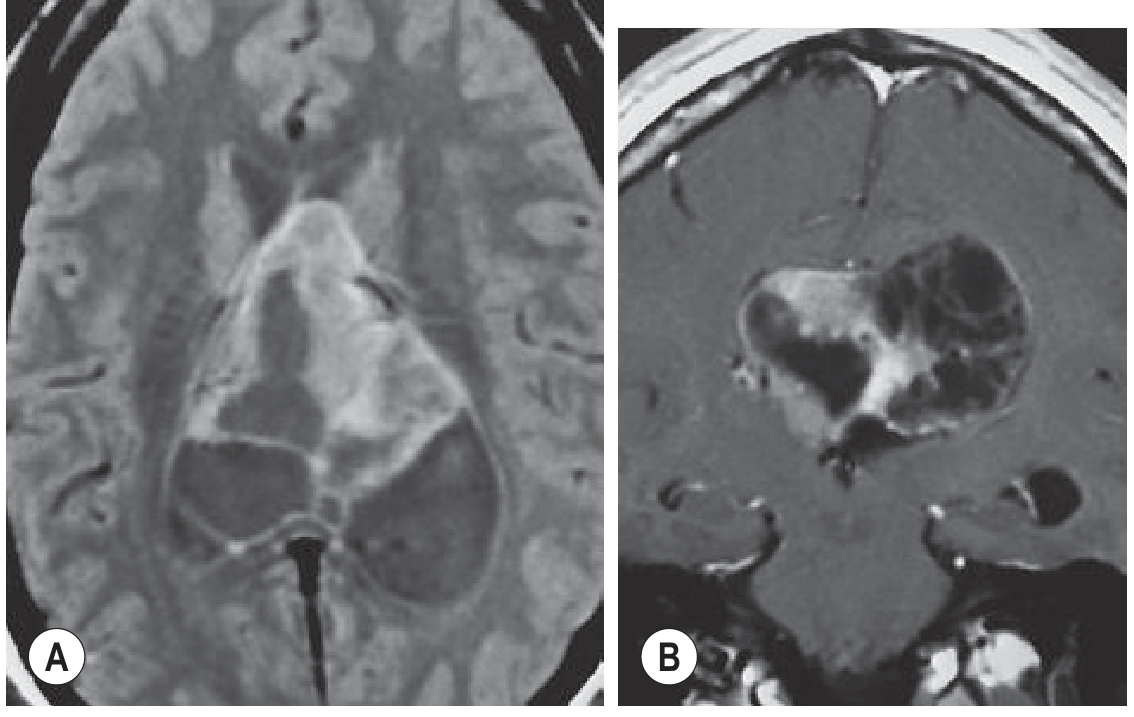
This composite of diagnostic images and a clinical illustration demonstrates a central neurocytoma in a 17-year-old patient. The series includes four axial MRI sequences and a corresponding schematic. A: Axial T1-weighted image shows a mass in the left lateral ventricle, adjacent to the septum pellucidum, exhibiting hyperintense signal. B: Axial T2-weighted image reveals the lesion is heterogeneously hyperintense with well-defined borders and no evidence of parenchymal invasion. Associated obstructive hydrocephalus is present, more prominent on the left. C: Contrast-enhanced axial T1-weighted image demonstrates heterogeneous enhancement of the mass. D: Apparent Diffusion Coefficient (ADC) map shows focal areas of restricted diffusion within the solid components. E: A medical illustration highlights the characteristic 'bubbly' appearance of a central neurocytoma within the ventricular system. The imaging features—location at the septum pellucidum and heterogeneous signaling—are classic for this WHO Grade 2 neuronal tumor.
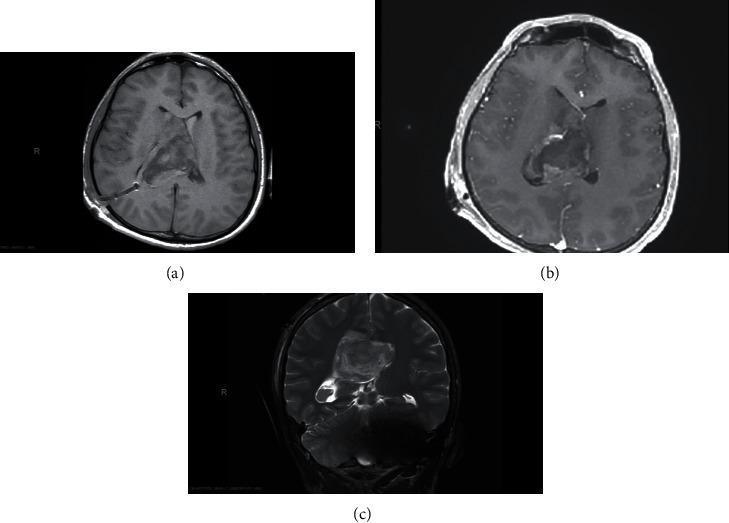
This diagnostic imaging panel displays MRI scans of the brain in axial (a, b) and coronal (c) planes. The images reveal a large, well-defined, and heterogeneous intraventricular mass centered in the right lateral ventricle, extending through the frontal horn and body. The mass exhibits significant mass effect, displacing the septum pellucidum across the midline toward the left and causing compression of the contralateral lateral ventricle. There is evidence of obstructive hydrocephalus, marked by the enlargement of the ventricular system. High-intensity signals in the dependent portions of the occipital horns and within the third and fourth ventricles on the T2-weighted coronal view (c) are consistent with intraventricular hemorrhage (IVH). The lesion demonstrates heterogeneous signal intensity with no gross contrast enhancement, which, in a young patient, is highly suggestive of a central neurocytoma. An external ventricular drain (EVD) or shunt component is partially visible in the right hemisphere in the axial views.
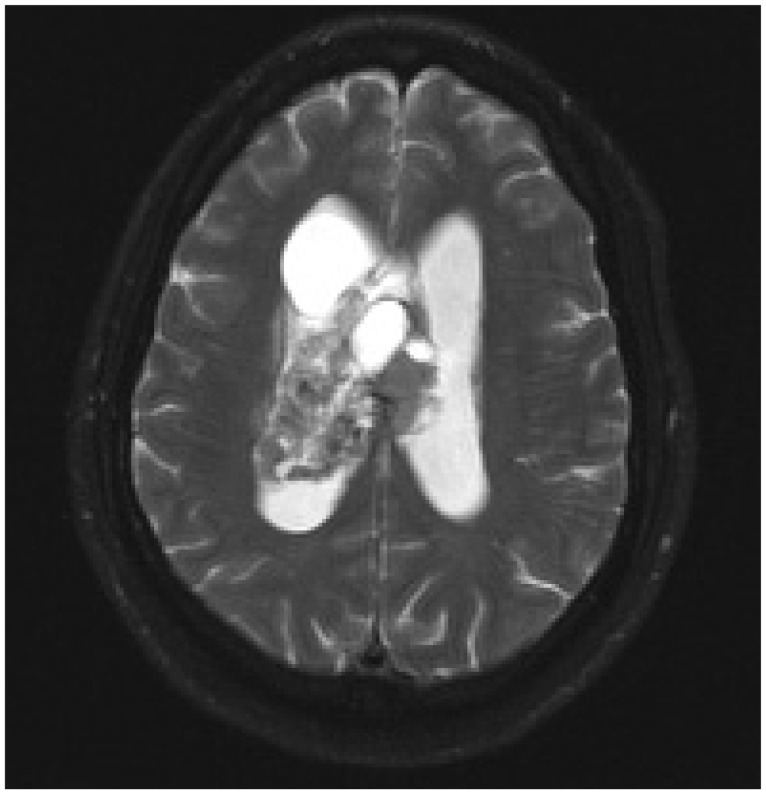
**Imaging Modality:** Axial T2-weighted Magnetic Resonance Imaging (MRI). **Anatomical Region:** Intracranial, specifically the ventricular system at the level of the lateral ventricles and the septum pellucidum. **Observed Pathology:** A large, well-circumscribed, heterogeneous intraventricular mass consistent with a central neurocytoma. The lesion is primarily located within the body of the right lateral ventricle, attached to the septum pellucidum, and extends across the midline. **Characteristic Visual Features:** The mass exhibits a "bubbly" appearance, characterized by heterogeneous T2 hyperintensity with multiple internal cystic components or flow voids. The lesion causes significant mass effect, resulting in obstructive hydrocephalus as evidenced by the bilateral dilatation of the frontal and occipital horns of the lateral ventricles. **Key Diagnostic Features:** The intraventricular location, broad-based attachment to the septum pellucidum, and the heterogeneous multicystic internal architecture are classic radiologic indicators of central neurocytoma, distinguishing it from other intraventricular neoplasms such as subependymoma or intraventricular meningioma.
ependymoma fourth ventricle CT MRI calcification extension
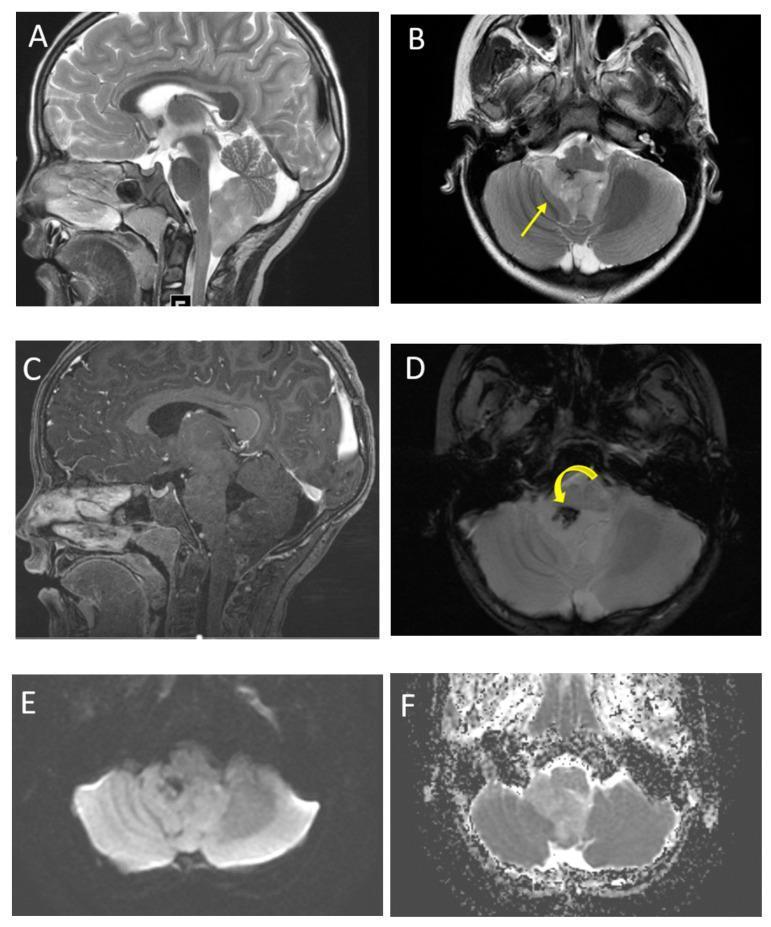
This multi-panel figure presents diagnostic magnetic resonance imaging (MRI) findings of a posterior fossa ependymoma in a 6-year-old male. (A) Sagittal and (B) axial T2-weighted images reveal a heterogeneous, predominantly hyperintense mass arising within the fourth ventricle. A characteristic visual feature is the 'plastic' extension of the tumor through the right foramen of Luschka (yellow arrow), a classic sign of ependymoma. (C) Sagittal post-contrast T1-weighted imaging demonstrates moderate, heterogeneous enhancement of the solid tumor components. (D) Axial Susceptibility-Weighted Imaging (SWI) shows a focal area of low signal intensity (curved arrow) indicating internal calcification or mineralization. (E) Axial Diffusion-Weighted Imaging (DWI) and (F) Apparent Diffusion Coefficient (ADC) map show relatively high ADC values compared to the adjacent brain parenchyma, indicating that while malignant, the tumor lacks the extreme hypercellularity seen in medulloblastoma. These images are educationally significant for identifying common pediatric brain tumor morphology, particularly the tendency for ependymomas to egress from the fourth ventricle through lateral apertures and their heterogeneous composition including cysts and calcifications.
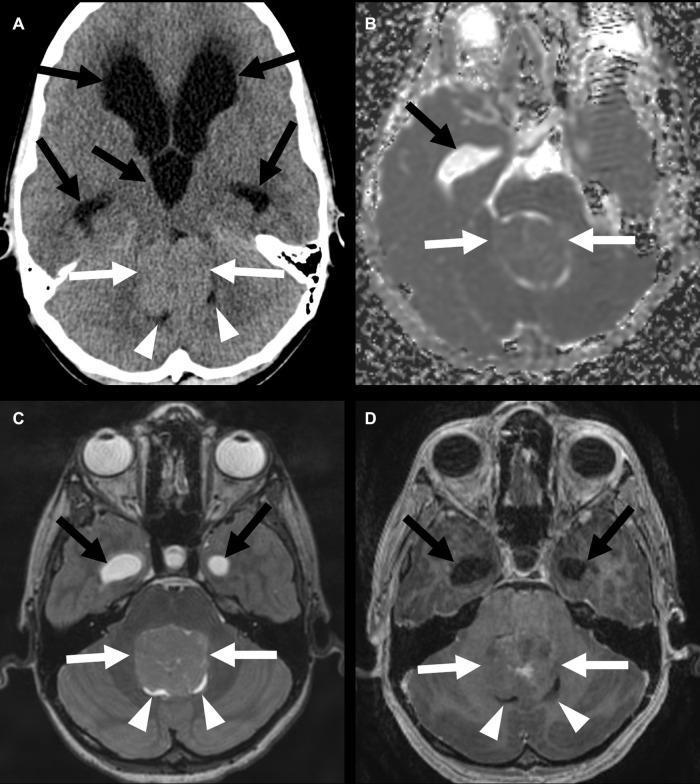
This composite diagnostic image features axial views of the brain of a 12-year-old male with a posterior fossa group B ependymoma. Image (A) is a non-contrast head CT demonstrating a midline posterior fossa mass (white arrows) without internal calcification. There is significant mass effect causing almost complete effacement of the fourth ventricle (arrowheads) and obstructive supratentorial hydrocephalus with dilation of the lateral ventricles (black arrows). Image (B) is an Apparent Diffusion Coefficient (ADC) map showing no signs of restricted diffusion. Image (C) is a T2-weighted MRI where the mass appears isointense to the adjacent cerebral cortex. Image (D) is a contrast-enhanced MRI showing the tumor's heterogeneous enhancement pattern. In all MRI sequences (B-D), the effacement of the fourth ventricle and the secondary hydrocephalus (dilated temporal horns of the lateral ventricles, black arrows) are clearly visible. These findings illustrate the typical radiographic presentation of a posterior fossa ependymoma and its common complications, specifically cerebrospinal fluid flow obstruction.
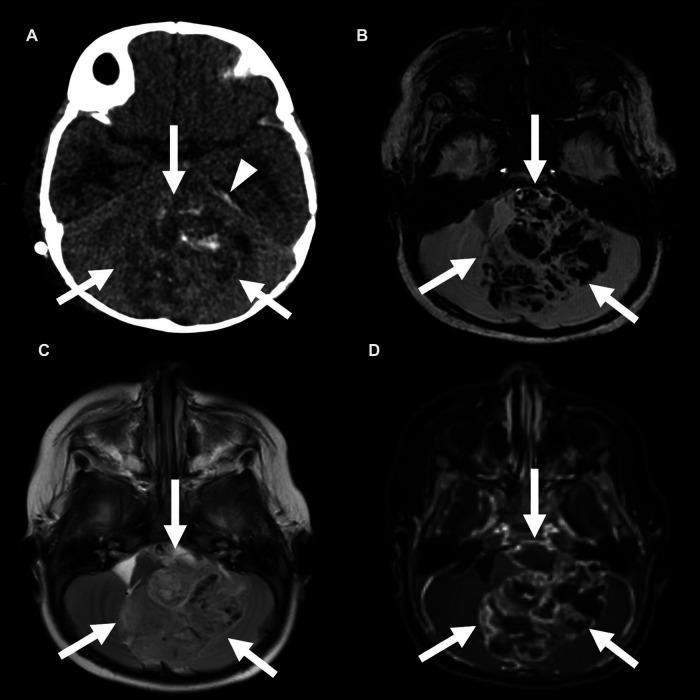
This composite of four axial neuroimaging views (CT and MRI) demonstrates a large, complex posterior fossa mass in a pediatric patient, characteristic of a Group A ependymoma. Image (A), a non-contrast CT, shows a predominantly isodense to hyperdense mass causing significant effacement of the fourth ventricle. Image (B), an axial Susceptibility Weighted Imaging (SWI) MRI, reveals extensive dark blooming artifacts within the lesion, indicating internal hemorrhage or calcification. Image (C), a T2-weighted MRI, shows the mass is largely isointense to the adjacent brain parenchyma with some heterogeneous internal architecture. Image (D), a contrast-enhanced MRI, demonstrates prominent heterogeneous enhancement of the solid tumor components. An arrowhead in the CT scan identifies hyperdense subdural blood products along the left tentorium. The mass occupies a significant portion of the posterior fossa, exerting mass effect on the surrounding cerebellum and brainstem. These imaging features—location in the posterior fossa, hemorrhage on SWI, and heterogeneous enhancement—are key diagnostic indicators for differentiating pediatric intracranial tumors.
colloid cyst foramen Monro third ventricle CT hyperdense MRI
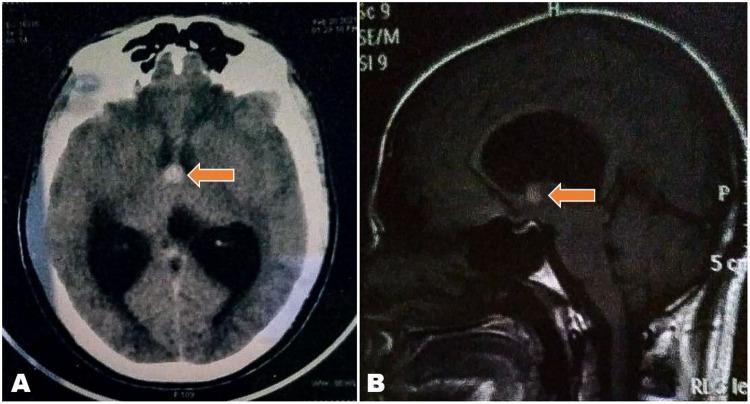
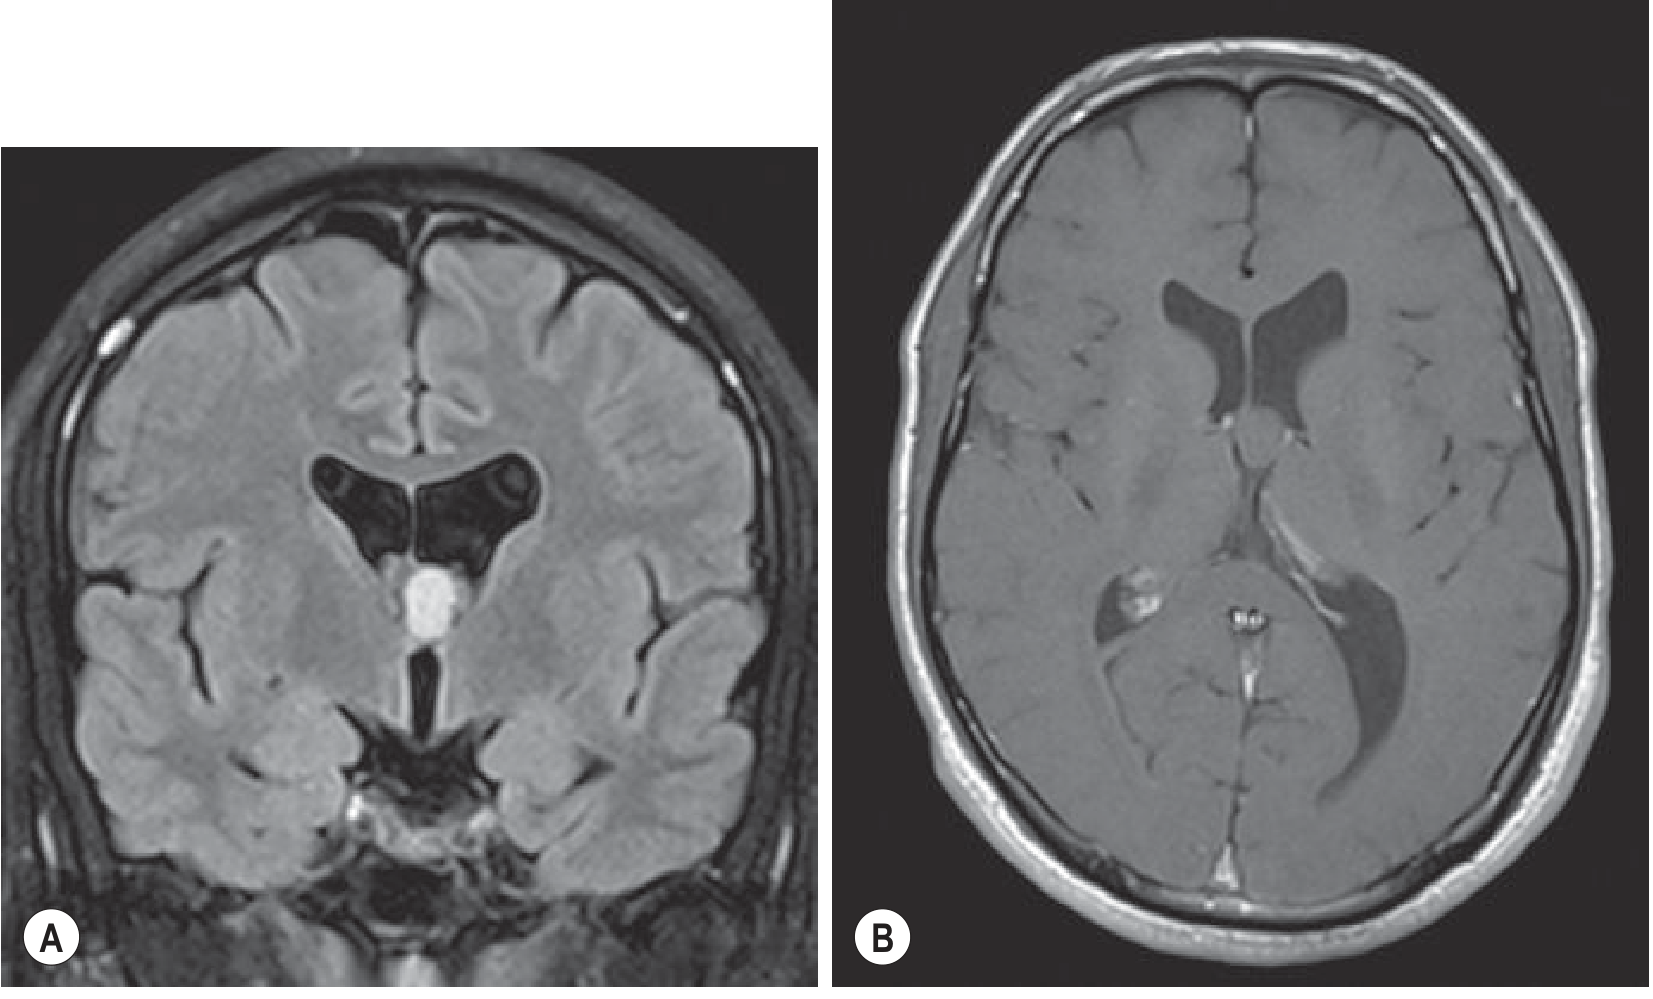
This composite diagnostic image features neuroimaging of a colloid cyst within the ventricular system. Image A is an axial non-contrast CT scan showing a well-circumscribed, hyperdense, rounded cystic lesion (indicated by an orange arrow) approximately 1 cm in diameter, located at the foramen of Monro. There is associated bilateral dilation of the lateral ventricles, consistent with obstructive hydrocephalus, without visible periventricular interstitial edema (CSF ooze). Image B is a sagittal T1-weighted MRI demonstrating a hyperintense lesion at the anterior roof of the third ventricle. The cyst causes significant effacement of the third ventricle and mechanical obstruction of the cerebrospinal fluid pathway. The combined imaging findings are characteristic of a colloid cyst of the third ventricle. This case serves as a pedagogical example of neuroanatomical landmarks, the pathophysiology of obstructive hydrocephalus, and the radiological presentation of benign intracranial masses in neurology and neurosurgery.
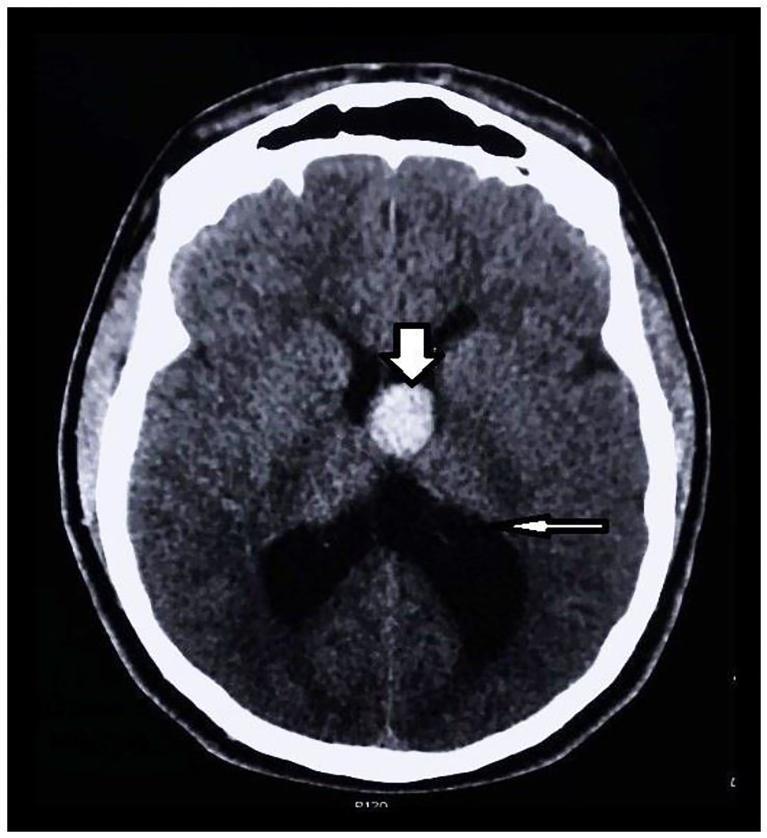
This diagnostic image is an axial non-contrast head CT scan demonstrating a classic presentation of a third ventricle colloid cyst with secondary obstructive hydrocephalus. Centrally located in the region of the foramen of Monro is a well-defined, hyperdense, rounded lesion (indicated by a thick white arrow), characteristic of a proteinaceous colloid cyst. The mass occupies the anterior third ventricle, leading to a significant obstruction of cerebrospinal fluid (CSF) flow. Evidence of resultant obstructive hydrocephalus is seen through the marked enlargement and bowing of the lateral ventricles (indicated by a thin white arrow). The surrounding brain parenchyma shows compression effects due to ventricular dilation. This clinical case illustrates a critical neurosurgical entity where a small, benign-appearing mass can cause life-threatening increases in intracranial pressure due to its strategic anatomical location within the ventricular system.
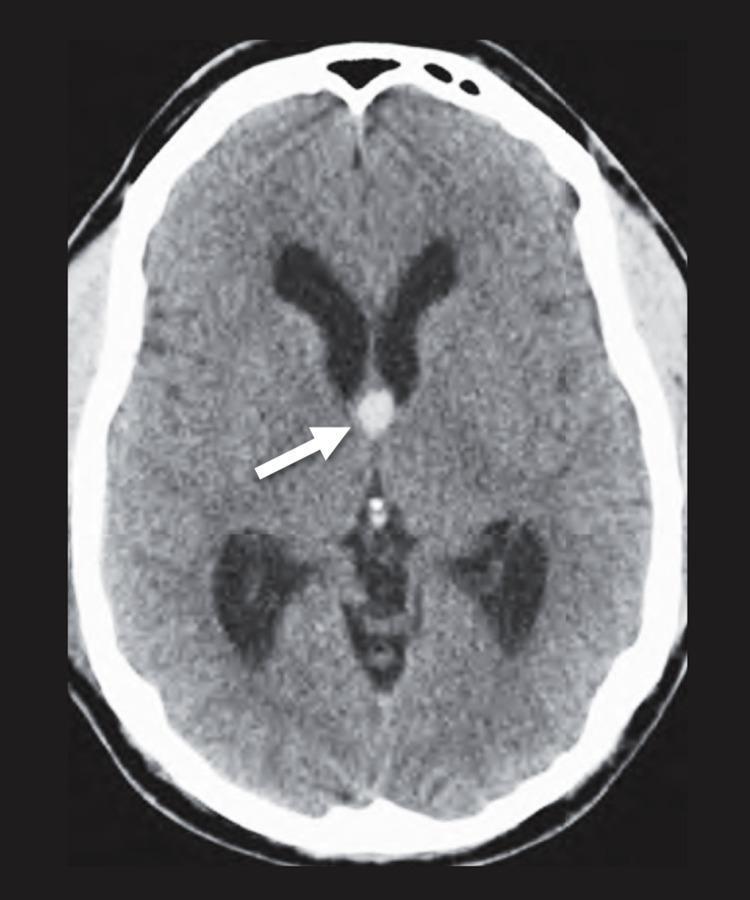
An axial non-contrast cranial CT scan showing a classic presentation of a colloid cyst. A well-circumscribed, homogenously hyperdense, round lesion is centrally located at the level of the foramen of Monro (indicated by a white arrow). The lesion is positioned at the anterosuperior aspect of the third ventricle, causing early-stage obstructive hydrocephalus, as evidenced by the prominent enlargement of both lateral ventricles. The brain parenchyma appears otherwise normal, without significant edema or midline shift beyond the ventricular dilatation. This diagnostic image demonstrates the typical radiological appearance of a third ventricle space-occupying lesion that can lead to acute intracranial pressure elevation due to cerebrospinal fluid (CSF) flow obstruction. The image serves as an educational tool for identifying midline intracranial masses and their associated secondary ventricular effects.
Intraventricular Tumors in Adults: Imaging
Orientation: Location-Based Differential
| Ventricle | Most Common Adult Tumor(s) |
|---|---|
| Lateral ventricle (body/trigone) | Meningioma, central neurocytoma, subependymoma, metastasis |
| Lateral ventricle (foramen of Monro) | Central neurocytoma, colloid cyst, subependymal giant cell astrocytoma (SEGA) |
| Third ventricle (anterior/foramen of Monro) | Colloid cyst |
| Third ventricle (posterior/pineal region) | Germinoma, pineocytoma, pineoblastoma, glioma |
| Fourth ventricle | Ependymoma, subependymoma, metastasis |
1. Central Neurocytoma
CT
- Iso- to mildly hyperdense mass
- Calcification present in ~50%
- Variable, often moderate contrast enhancement
- Obstructive hydrocephalus common
MRI
- T1: Isointense to gray matter, heterogeneous
- T2: Iso- to hyperintense; characteristic "bubbly" multicystic appearance due to multiple small cysts
- T1+Gad: Moderate to marked heterogeneous enhancement
- DWI: Focal areas of restricted diffusion in solid components
- MRS: Elevated glycine and alanine peaks (helps differentiate from oligodendroglioma)
2. Intraventricular Meningioma
CT
- Hyperdense relative to brain (dense cellularity)
- May contain calcification
- Homogeneous, intense contrast enhancement
MRI
- T1: Iso- to slightly hypointense to gray matter
- T2: Iso- to hypointense (fibroblastic/transitional types are hypointense; meningothelial type may be isointense)
- T1+Gad: Intense, homogeneous enhancement (identical to extraventricular meningiomas)
- Well-defined globular lesion
- No surrounding edema in most cases (unlike parenchymal meningiomas)
- Dural tail sign is absent (no dural attachment in intraventricular location)
3. Choroid Plexus Papilloma (CPP)
CT
- Lobulated, hyperdense mass (highly vascular)
- Often shows calcification within the fronds
- Intense contrast enhancement
MRI
- T1: Isointense to gray matter
- T2: Heterogeneous, lobulated "cauliflower-like" morphology
- T1+Gad: Intense, lobulated enhancement - often described as "frond-like"
- Bilateral ventricular dilatation out of proportion (CSF overproduction)
- DWI: Typically no restriction (distinguishes from choroid plexus carcinoma)
4. Colloid Cyst
CT
- Smooth, spherical lesion at the foramen of Monro
- Characteristically hyperdense on non-contrast CT (proteinaceous/mucinous content - calcium, cholesterol, haemosiderin)
- Does not enhance with contrast
MRI
- Signal is variable depending on cyst content:
- Most: Hyperintense on T1 and FLAIR (high protein/cholesterol)
- Some: May be isointense or hypointense on T2 (high protein paradoxically reduces T2 signal)
- No enhancement on T1+Gad
- Obstructive hydrocephalus of the lateral ventricles (not the third ventricle itself)
5. Ependymoma (Intracranial, Adult)
CT
- Iso- to hyperdense mass filling or arising from the fourth ventricle
- Calcification in up to 50% (helpful distinguishing feature)
- Variable contrast enhancement
- Obstructive hydrocephalus
MRI
- T1: Iso- to hypointense
- T2: Heterogeneous, iso- to hyperintense; cystic components are hyperintense
- T1+Gad: Variable, heterogeneous enhancement
- SWI: Blooming artifact from calcification or intratumoral hemorrhage
- DWI/ADC: Higher ADC values than medulloblastoma (lower cellularity) - important differential
- Pathognomonic sign: "Plastic" extension through the foramina of Luschka (laterally) and Magendie (inferiorly) into the subarachnoid space - tumor molds to the available space
6. Subependymoma
CT
- Iso- to hypodense
- Small, round, well-delineated, homogeneous
- Larger tumors: cysts, calcifications, or hemorrhage
MRI
- T1: Hypo- to isointense
- T2: Hyperintense (water-containing, benign)
- FLAIR: Hyperintense
- T1+Gad: Absent or minimal enhancement - the most distinguishing feature from central neurocytoma
- Lateral ventricle subependymomas may attach to the septum pellucidum (mimicking central neurocytoma, but with far less enhancement)
- Fourth ventricular subependymomas may extrude through the foramen of Magendie (mimicking ependymoma)
7. Intraventricular Metastases
- Direct hematogenous seeding of choroid plexus
- CSF spread from parenchymal metastases
CT
- Variable density; may be hyperdense (melanoma, hemorrhagic)
- Often show ring or nodular enhancement with contrast
MRI
- T1: Variable; hyperintense if hemorrhagic (melanoma, choriocarcinoma)
- T2/FLAIR: Heterogeneous signal; surrounding edema present
- T1+Gad: Enhancement pattern varies (nodular, ring)
- DWI: Restriction may be present
- Key feature: Edema often disproportionately large relative to tumor size
- Multiple lesions at the gray-white junction elsewhere support metastatic diagnosis
8. SEGA (Subependymal Giant Cell Astrocytoma)
CT
- Heterogeneous mass at the foramen of Monro
- Calcification common (subependymal nodules calcify with age)
- Moderate to marked enhancement
MRI
- T2: Heterogeneous, iso- to hyperintense
- T1+Gad: Avid enhancement (distinguishes growing SEGA from stable subependymal nodules, which enhance less)
- Look for: cortical tubers, subependymal nodules, white matter abnormalities (background TSC stigmata)
9. Germinoma / Pineal Region Tumors
CT
- Germinoma: Isodense to slightly hyperdense; "engulfs" the calcified pineal gland
- Enhancement present
MRI
- T1: Isointense to gray matter
- T2: Iso- to hyperintense
- T1+Gad: Moderate to marked homogeneous enhancement
- DWI: Restriction common (hypercellular)
- May have CSF drop metastases (image entire spine)
- Pineocytoma: Round, well-defined; peripheral calcification; intense nodular enhancement
- Pineoblastoma: Large (>3 cm), heterogeneous; iso- to hypointense on T2 (hypercellular); restricted diffusion; CSF spread
Summary Comparison Table
| Tumor | Location | CT density | Calcification | Enhancement | Key MRI feature |
|---|---|---|---|---|---|
| Central neurocytoma | Lateral V, septum pellucidum | Iso/hyper | ~50% | Moderate, heterogeneous | "Bubbly" multicystic; T2 heterogeneous |
| Intraventricular meningioma | Lateral V trigone | Hyperdense | Occasional | Intense, homogeneous | Iso-hypointense T2 |
| Choroid plexus papilloma | 4th V (adults) | Hyperdense | May have | Intense, lobulated/frond-like | Cauliflower morphology; disproportionate hydrocephalus |
| Colloid cyst | Foramen of Monro / anterior 3rd V | Hyperdense | No | None | FLAIR/T1 hyperintense; no enhancement |
| Ependymoma | 4th V | Iso/hyper | ~50% | Variable, heterogeneous | "Plastic" extension through foramina |
| Subependymoma | 4th V > lateral V | Iso/hypo | Larger tumors | Absent/minimal | T2 bright; no/minimal enhancement |
| SEGA | Foramen of Monro | Hetero, calcified | Yes | Avid | Background TSC findings |
| Metastasis | Any | Variable | No | Ring/nodular | Disproportionate edema; gray-white junction |
| Germinoma | Pineal/posterior 3rd V | Iso/hyper | "Exploded" pineal | Moderate-marked | Restriction on DWI; CSF spread |
Practical Imaging Approach
- Absent/minimal = Subependymoma, colloid cyst
- Lobulated/intense = Choroid plexus papilloma
- Homogeneous/intense = Meningioma
- Heterogeneous/moderate = Neurocytoma, ependymoma
- Bubbly cysts at septum pellucidum → central neurocytoma
- Hyperdense non-enhancing foramen of Monro lesion → colloid cyst
- Tumor squeezing through foramina → ependymoma
- Background TSC + foramen of Monro → SEGA
- Disproportionate hydrocephalus + lobulated enhancement → choroid plexus papilloma
- Frond-like enhancing mass + CSF spread risk → germinoma/PNET
Posterior cranial fossa lesions in children
Imaging of posterior cranial fossa lesions in children
posterior fossa tumor children MRI CT medulloblastoma pilocytic astrocytoma ependymoma
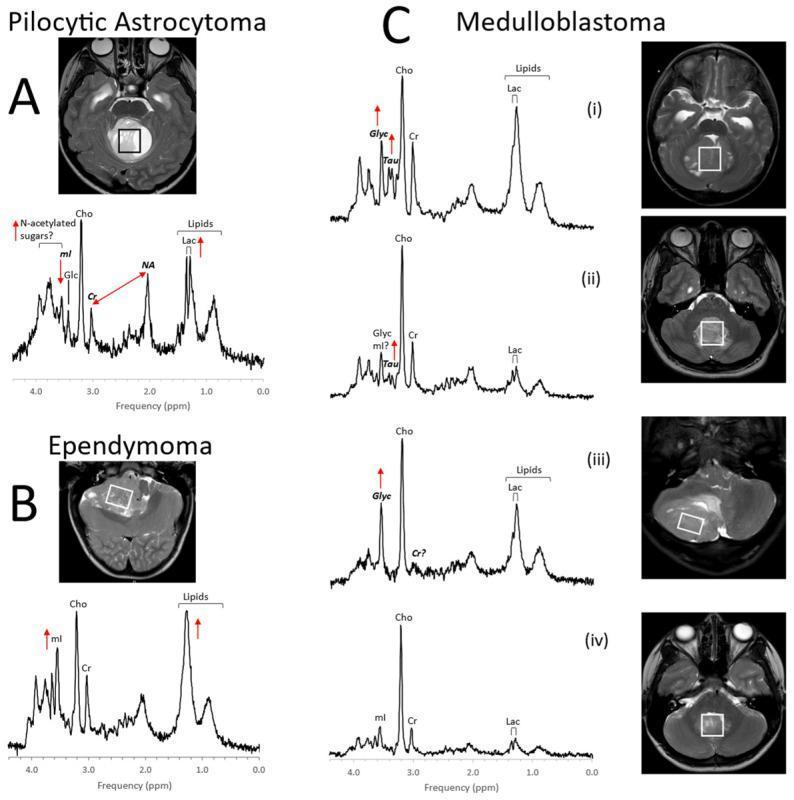
This educational image displays Proton MR Spectroscopy (1H-MRS) profiles and corresponding T2-weighted axial MRIs for common pediatric posterior fossa tumors. Panel A illustrates Pilocytic Astrocytoma, characterized by elevated lactate (Lac), lipids, and N-acetylated sugars (~3.8 ppm), with low creatine (Cr) and myo-inositol (mI). Panel B shows Ependymoma, featuring variable lipid levels and myo-inositol peaks. Section C provides a comparison of four Medulloblastoma molecular subgroups: (i) Group 3, (ii) Group 4, (iii) Sonic Hedgehog (SHH), and (iv) WNT. The medulloblastoma spectra generally demonstrate high Choline (Cho) peaks and varying presence of Taurine (Tau) and Glycine (Glyc) at ~3.4-3.5 ppm. The accompanying axial MRI scans show the voxel placement (white boxes) within the cerebellum and fourth ventricle for each tumor type. These metabolic fingerprints assist in differentiating highly cellular medulloblastomas from other cerebellar lesions and investigating subgroup-specific biomarkers. All spectra were acquired at 3T using SV-PRESS (TE=35ms, TR=2s).
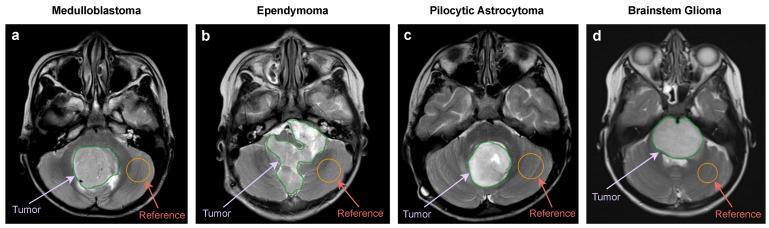
This diagnostic image set consists of four axial T2-weighted (T2W) MRI scans illustrating different types of pediatric posterior fossa tumors. Each panel includes a manually delineated tumor region of interest (ROI) in green and a normal-appearing parenchyma reference ROI in orange. Panel (a) shows a Medulloblastoma in an 8-year-old boy, characterized by a well-defined circular ROI with predominantly intermediate signal intensity. Panel (b) depicts an Ependymoma in a 3-year-old boy, showing a more irregular, heterogeneous ROI with mixed high and intermediate signal intensities. Panel (c) displays a Pilocytic Astrocytoma in a 7-year-old girl, featuring a well-defined round ROI with high signal intensity (hyperintensity). Panel (d) illustrates a Brainstem Glioma in a 6-year-old girl, presenting a homogeneous high signal intensity within the delineated brainstem region. The comparison highlights differences in tumor morphology, signal intensity, and anatomical location (cerebellar midline vs. brainstem vs. fourth ventricle) used for radiological classification and machine learning training.
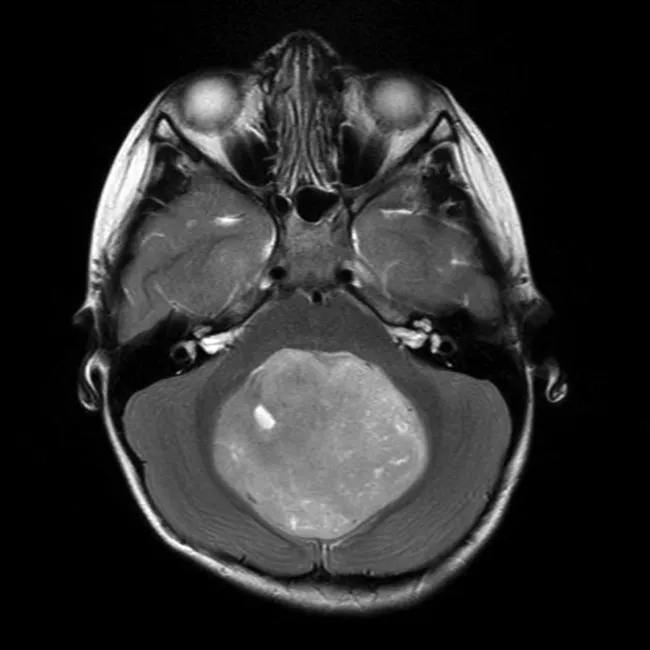
Magnetic Resonance Imaging (MRI) of the brain in axial orientation demonstrates a large midline posterior fossa mass arising from the cerebellar vermis in a 6-year-old. The lesion is hyperintense on T2-weighted imaging and exhibits only patchy enhancement after gadolinium administration, indicating a predominantly solid tumor with heterogeneous vascularity. The mass completely effaces the fourth ventricle and obscures the normal vermis, causing crowding of surrounding cerebellar tissue and potential obstructive hydrocephalus. Radiographic features are highly suggestive of a medulloblastoma in a pediatric patient, with typical midline vermian origin and posterior fossa dominance. The diagnosis was confirmed histologically by biopsy. Differential considerations include pilocytic astrocytoma, ependymoma, atypical teratoid/rhabdoid tumor (ATRT), and other cerebellar neoplasms, but patient age and vermian involvement favor medulloblastoma. Clinically, this lesion warrants neurosurgical resection followed by adjuvant therapy (radiation and chemotherapy) per pediatric brain tumor protocols. The image is consistent with radiology-pathology correlation and supports treatment planning, prognostication, and educational use. This case illustrates classic pediatric posterior fossa tumor morphology, diffusion characteristics not shown here, and the importance of post-contrast imaging in defining tumor extent and fourth ventricle involvement. This information enhances indexing for neuro-oncology research and case-based medical education. It aids radiologists and clinicians in recognizing this tumor in young children.
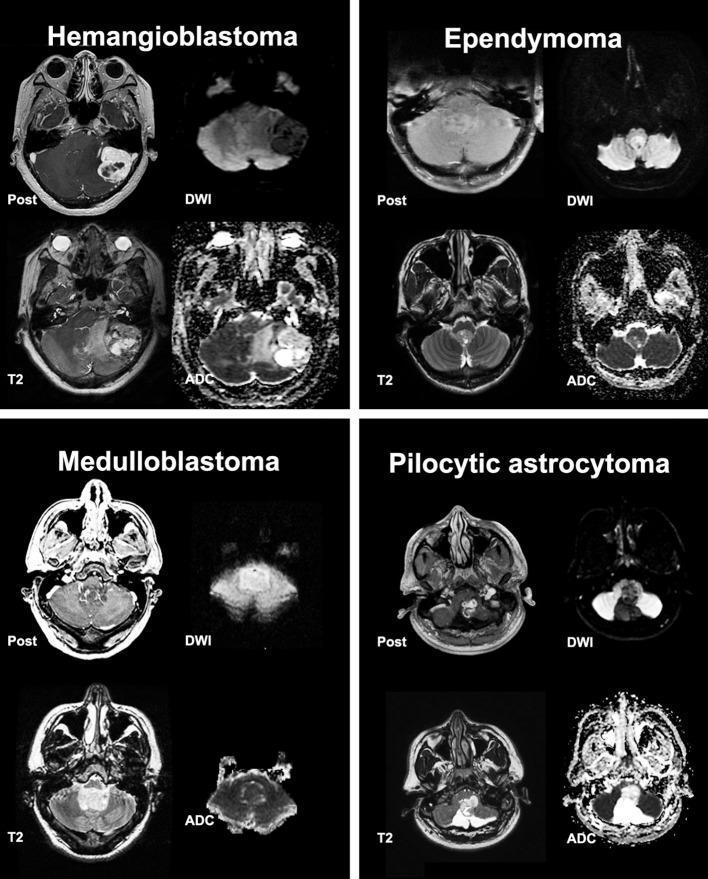
A comparative diagnostic imaging panel displaying four representative posterior cranial fossa tumors—Hemangioblastoma, Ependymoma, Medulloblastoma, and Pilocytic Astrocytoma—across four MRI sequences: post-contrast T1-weighted (Post), T2-weighted (T2), Diffusion-Weighted Imaging (DWI), and Apparent Diffusion Coefficient (ADC) maps. The Hemangioblastoma demonstrates a cystic morphology with a heterogeneously enhancing mural nodule and high ADC signal. The Ependymoma shows homogeneous enhancement and mixed ADC signal. The Medulloblastoma is characterized by significant restricted diffusion, indicated by high signal on DWI and corresponding low signal on ADC, typical of highly cellular tumors. The Pilocytic Astrocytoma exhibits a well-defined cystic component with a solid enhancing portion and high ADC signal. These axial views highlight key neuroradiological features used to differentiate common pediatric and adult intra-axial tumors of the cerebellum and fourth ventricle, emphasizing the clinical significance of ADC values and enhancement patterns in neuro-oncological diagnosis.
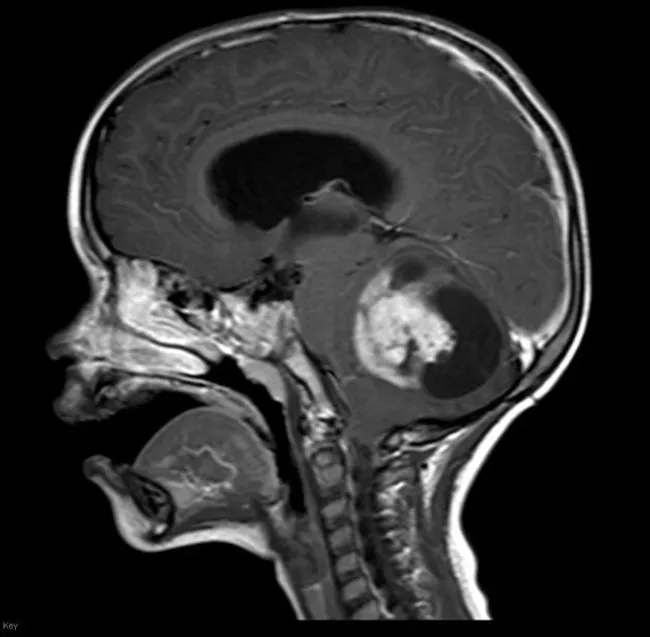
Sagittal gadolinium enhanced MRI of the brain in a 3 year old male demonstrates a large cystic lesion in the cerebellum with a conspicuously enhancing mural nodule. The mass is located in the posterior fossa, displacing adjacent cerebellar tissue and potentially affecting CSF pathways. The imaging signature, a cystic lesion with a solid, brightly enhancing mural nodule, is a classic pattern for pilocytic astrocytoma (juvenile pilocytic astrocytoma, JPA) in children. On T1 and T2 weighted sequences the cyst component typically shows low to intermediate signal with the mural nodule displaying solid enhancement after contrast administration. The border is well circumscribed, and peritumoral edema is minimal, reflecting a low grade glioma. Differential considerations include medulloblastoma and ependymoma, but age, tumor location, and the cyst plus nodule morphology strongly favor PA. Clinically, this pattern guides surgical planning toward maximal safe resection, which offers favorable prognosis in pediatric PA. Correlation with histology would reveal biphasic pilocytic architecture and Rosenthal fiber positive astrocytic cells. This case courtesy of Radiopaedia serves as an educational example of posterior fossa cystic neoplasms in children. Keywords: pediatric brain tumor, cerebellar tumor, posterior fossa, cystic lesion, enhancing mural nodule, gadolinium, MRI, prognosis, resection. Educationally relevant for learners and clinicians worldwide.
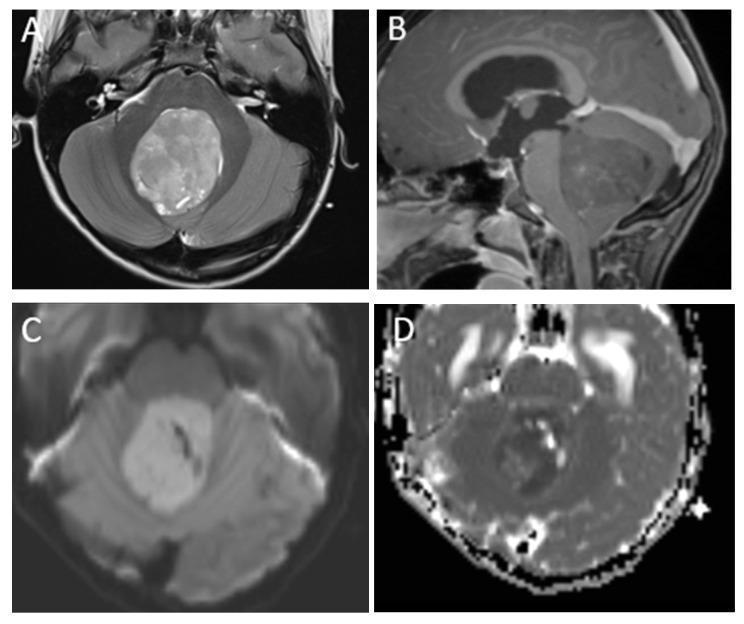
This multi-modal MRI panel presents characteristic findings of medulloblastoma in a 7-year-old child. Image (A), an axial T2-weighted sequence, reveals a large, mildly heterogeneous, hyperintense midline mass within the posterior fossa, exerting mass effect and compressing the fourth ventricle. Image (B), a sagittal post-contrast T1-weighted image, shows the solid mass occupying the cerebellar vermis with heterogeneous enhancement. Advanced sequences include Diffusion-Weighted Imaging (C) and an Apparent Diffusion Coefficient (ADC) map (D). The lesion exhibits marked diffusion restriction, visualized as high signal on DWI and corresponding low signal on ADC. This restriction is a hallmark of highly cellular embryonal neoplasms, such as WHO Grade 4 medulloblastomas. The images provide critical diagnostic information for pediatric neuro-oncology, highlighting the importance of assessing tumor location, morphology, and cellularity through multi-parametric magnetic resonance imaging to differentiate medulloblastoma from other posterior fossa tumors like ependymoma or pilocytic astrocytoma.
pilocytic astrocytoma cerebellum cyst mural nodule MRI enhancement children
Sagittal gadolinium enhanced MRI of the brain in a 3 year old male demonstrates a large cystic lesion in the cerebellum with a conspicuously enhancing mural nodule. The mass is located in the posterior fossa, displacing adjacent cerebellar tissue and potentially affecting CSF pathways. The imaging signature, a cystic lesion with a solid, brightly enhancing mural nodule, is a classic pattern for pilocytic astrocytoma (juvenile pilocytic astrocytoma, JPA) in children. On T1 and T2 weighted sequences the cyst component typically shows low to intermediate signal with the mural nodule displaying solid enhancement after contrast administration. The border is well circumscribed, and peritumoral edema is minimal, reflecting a low grade glioma. Differential considerations include medulloblastoma and ependymoma, but age, tumor location, and the cyst plus nodule morphology strongly favor PA. Clinically, this pattern guides surgical planning toward maximal safe resection, which offers favorable prognosis in pediatric PA. Correlation with histology would reveal biphasic pilocytic architecture and Rosenthal fiber positive astrocytic cells. This case courtesy of Radiopaedia serves as an educational example of posterior fossa cystic neoplasms in children. Keywords: pediatric brain tumor, cerebellar tumor, posterior fossa, cystic lesion, enhancing mural nodule, gadolinium, MRI, prognosis, resection. Educationally relevant for learners and clinicians worldwide.
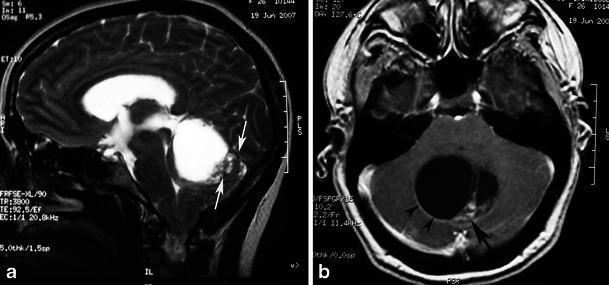
This diagnostic image set consists of two MRI scans demonstrating a pilocytic astrocytoma in the posterior fossa of a 26-year-old female. Image (a) is a sagittal T2-weighted MRI showing a large, well-circumscribed, hyperintense cystic mass located in the cerebellar vermis. A distinct, peripherally situated mural nodule (indicated by arrows) is visible on the posterior aspect of the cyst, which is causing significant mass effect and compression of the fourth ventricle. Image (b) is an axial contrast-enhanced T1-weighted MRI at the level of the cerebellum. It demonstrates the classic enhancement pattern of this pathology: the mural nodule (arrow) shows intense, homogeneous contrast uptake, and there is also smooth enhancement along the cyst wall (arrowheads). These features are hallmark diagnostic criteria for a WHO Grade I pilocytic astrocytoma. The clinical significance of these images lies in demonstrating the relationship between the cystic component, the enhancing solid nodule, and the resultant obstructive pressure on adjacent ventricular structures.
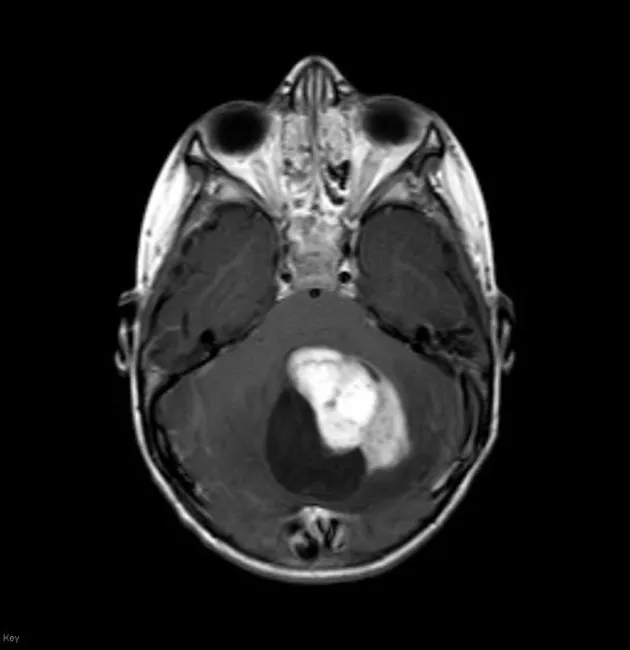
Magnetic Resonance Imaging (MRI) of the brain, coronal view with gadolinium-based contrast. The patient is a 3-year-old male. The imaging demonstrates a large cystic cerebellar mass within the posterior fossa with a nodular mural enhancement projecting from the cyst wall. The mural nodule enhances brightly after contrast, contrasting with a comparatively non-enhancing predominant cystic component. The lesion arises within the cerebellar hemisphere (posterior fossa), causing surrounding cerebellar parenchymal involvement and mild mass effect; the fourth ventricle is partially compressed but hydrocephalus is not evident on this slice. The imaging phenotype—cystic cerebellar lesion with an intensely enhancing mural nodule in a young child—is classic for pilocytic astrocytoma. Alternative considerations include other cerebellar tumors seen in children such as medulloblastoma, ependymoma, and hemangioblastoma, though age, location, and imaging pattern favor pilocytic astrocytoma. These tumors may present with cystic components and mural nodules, but pilocytic astrocytoma typically presents as a circumscribed, cystic lesion with a well-defined, enhancing mural nodule. Clinically, pilocytic astrocytoma is generally WHO grade I with favorable prognosis following surgical resection; radiologic follow-up and clinical correlation with histopathology are essential. This case aligns with the typical pediatric posterior fossa pilocytic astrocytoma presentation and is suitable for surgical planning and prognosis assessment.
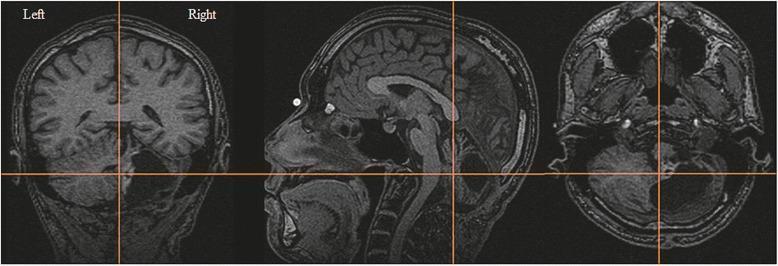
This diagnostic image displays three T1-weighted MRI views of the brain: coronal (left), sagittal (center), and axial (right). The imaging focuses on the posterior fossa, specifically the cerebellum. Orange crosshair lines intersect at a mural nodule of a pilocytic astrocytoma, located in the cerebellar vermis adjacent to the medulla oblongata. A large, hypointense cyst associated with the tumor is clearly visible, occupying the majority of the right cerebellar hemisphere and causing significant architectural asymmetry compared to the left side. The sagittal view provides a lateral perspective of the tumor's extension and its proximity to the brainstem. This image is used to demonstrate the classic morphological presentation of a cystic pilocytic astrocytoma, including the contrast between the solid mural nodule and the expansive cystic component. It serves as an educational reference for neuroradiology and neurosurgery in identifying pediatric cerebellar tumors and their anatomical relationships to midline structures.
medulloblastoma vermis fourth ventricle DWI restricted diffusion hyperdense CT child
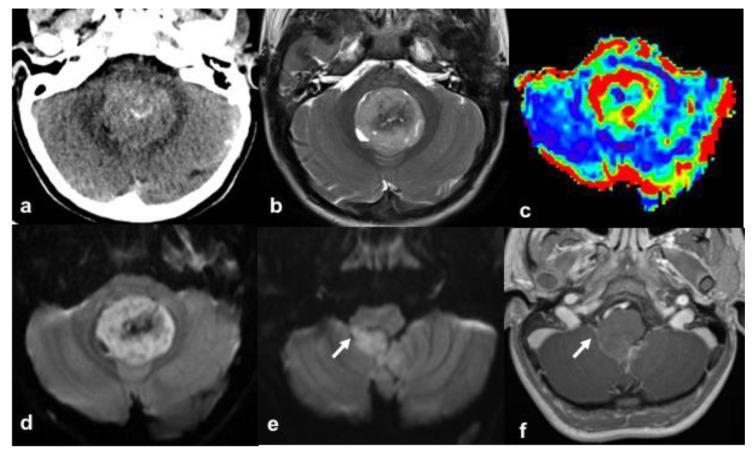
A multi-panel neuroradiological figure displaying axial views of the posterior fossa in a pediatric patient. (a) Non-contrast axial CT shows a hyperdense mass within the fourth ventricle containing focal lesional mineralizations. (b) T2-weighted MRI demonstrates the tumor's heterogeneous signal intensity and its well-circumscribed nature. (c) Arterial Spin Labeling (ASL) perfusion imaging reveals increased cerebral blood flow within the lesion, suggesting hypervascularity. (d) Diffusion-Weighted Imaging (DWI) shows high signal intensity, indicating restricted diffusivity and high cellular density. (e, f) DWI and gadolinium-enhanced T1-weighted images highlight the tumor's extension and involvement of the right foramen of Luschka (arrows), showing mild, heterogeneous contrast enhancement. The imaging features, including hyperdensity on CT, restricted diffusion, and anatomical location, are highly suggestive of medulloblastoma (specifically WNT-subgroup) occurring in the fourth ventricle. This figure illustrates key diagnostic modalities used for neuro-oncological assessment of pediatric brain tumors.
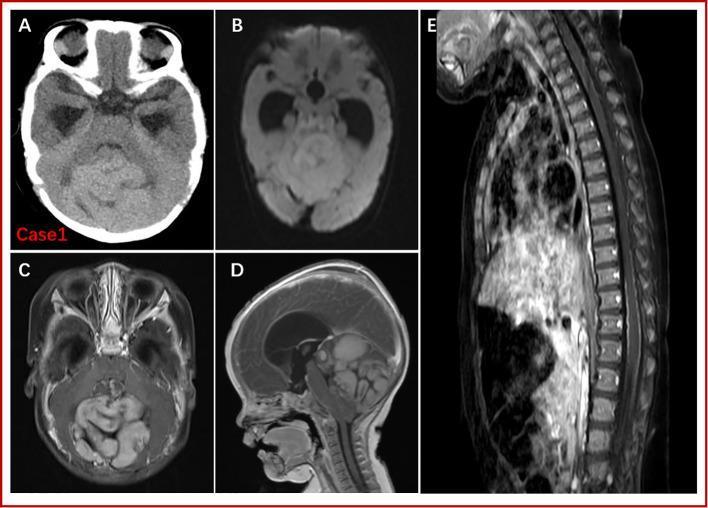
This composite of diagnostic images displays a pediatric neuroimaging case involving a large posterior fossa tumor, consistent with medulloblastoma with extensive nodularity (MBEN) in a patient with Gorlin-Goltz syndrome. (A) Axial non-contrast CT shows a slightly hyperdense mass in the posterior fossa with ill-defined borders. (B) Diffusion-weighted imaging (DWI) demonstrates high signal intensity, suggesting high cellularity and restricted diffusion. (C) Axial and (D) sagittal Gd-enhanced T1-weighted images reveal a large, heterogeneously enhancing mass with a characteristic multinodular appearance. Secondary effects include significant compression of the brainstem, narrowing of the fourth ventricle, and obstructive supratentorial hydrocephalus, indicated by dilated ventricles. (E) Sagittal Gd-enhanced MRI of the spinal cord shows thin, linear enhancement and small nodular signals along the spinal cord surface, concerning for leptomeningeal dissemination or drop metastases. The findings emphasize the importance of neuraxis screening in primary central nervous system tumors. This educational material is suitable for neurosurgical and radiological clinical training.

This composite of brain MRI sequences illustrates a Medulloblastoma with Extensive Nodularity (MBEN) in the posterior fossa. (a) Axial Diffusion-Weighted Imaging (DWI) and (b) Apparent Diffusion Coefficient (ADC) map demonstrate restricted diffusion within the mass, typical of highly cellular tumors. (c) Axial Susceptibility-Weighted Imaging (SWI) shows minor susceptibility artifacts. (d) Sagittal T2-weighted sequence highlights the hallmark 'grape-like' morphology, with numerous hyperintense, well-circumscribed nodules. (e) Sagittal pre-contrast T1-weighted image shows the mass as predominantly hypointense relative to the cerebellum. (f) Sagittal post-gadolinium T1-weighted image reveals significant enhancement of the nodular components, making the multicystic or multinodular internal architecture more prominent. The lesion is located in the cerebellum and vermis, causing mass effect on the fourth ventricle. These radiological features are characteristic of the MBEN variant of medulloblastoma, often seen in infants and associated with a relatively favorable prognosis.
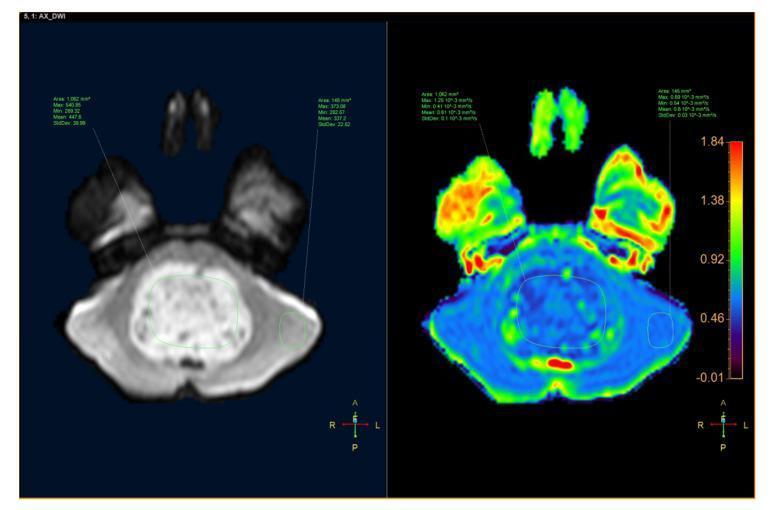
This diagnostic image pair displays an axial brain MRI of an 8-year-old male with a confirmed medulloblastoma in the fourth ventricle. The left panel shows a Diffusion-Weighted Image (DWI) where the tumor exhibits high signal intensity (hyperintensity), indicating restricted diffusion. The right panel shows the corresponding Apparent Diffusion Coefficient (ADC) map, where the tumor appears with low signal intensity (blue/green hues), confirming true diffusion restriction rather than a T2 shine-through effect. Green Regions of Interest (ROI) are demarcated on both images for quantitative analysis. Annotations provide statistical data for the tumor ROI and a control parenchyma ROI, including Area, Max, Min, Mean, and Standard Deviation. On the ADC map, the tumor mean ADC is 0.81 x 10^-3 mm^2/s, while the reference parenchyma mean is 337.2. A color scale on the right correlates signal intensity with quantitative ADC values. This comparison is clinically significant for the differential diagnosis of posterior fossa tumors in pediatric patients, specifically distinguishing highly cellular tumors like medulloblastoma from other entities such as brainstem gliomas.
DIPG diffuse intrinsic pontine glioma brainstem T2 MRI child
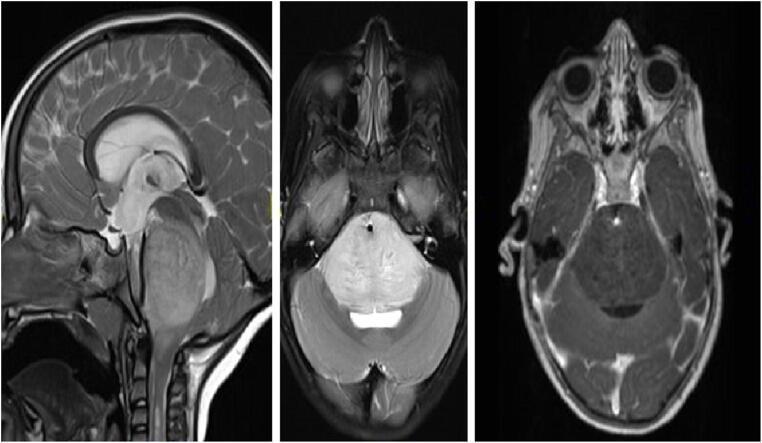
This diagnostic image set consists of three brain MRI scans illustrating a Diffuse Intrinsic Pontine Glioma (DIPG) in a 3.5-year-old female. The left panel shows a sagittal T2-weighted MRI, demonstrating a significantly enlarged pons with an expansive, hyperintense (bright) mass occupying the majority of the brainstem, characteristic of an infiltrative glioma. The middle panel is an axial T2-weighted MRI, highlighting the diffuse nature of the tumor as it encompasses more than 50% of the axial cross-section and ventrally engulfs the basilar artery (visible as a small dark flow void). The right panel shows an axial T1-weighted contrast-enhanced MRI, where the tumor appears predominantly hypointense with only very mild, focal, or linear contrast enhancement, indicating the absence of significant blood-brain barrier breakdown. Clinical relevance includes the diagnosis of DIPG based on typical radiographic features: diffuse expansion of the pons, T2-hyperintensity, and minimal contrast enhancement in a pediatric patient presenting with cranial neuropathies and motor decline.
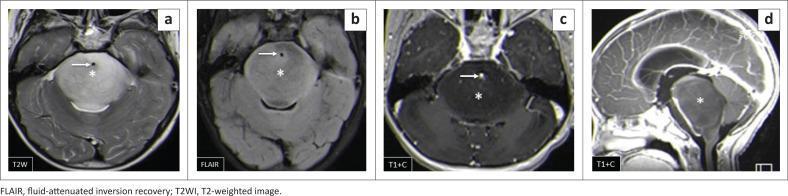
Diagnostic neuroimaging panel showing a diffuse intrinsic pontine glioma (DIPG). The panel includes axial T2-weighted (a), axial FLAIR (b), axial T1-weighted post-contrast (c), and sagittal T1-weighted post-contrast (d) MRI sequences. The images demonstrate a large, infiltrative mass (*) that significantly expands the pons. On T2WI and FLAIR, the lesion is homogeneously hyperintense relative to normal brain parenchyma. On T1-weighted post-contrast images, the mass appears hypointense and lacks significant gadolinium enhancement. A characteristic feature is the anterior displacement and encasement of the basilar artery (arrow), which remains patent, appearing as a signal void on non-contrast sequences and enhancing on post-contrast axial views. The sagittal view (d) highlights the craniocaudal extent of the pontine expansion and its mass effect on the fourth ventricle. This set illustrates the typical imaging hallmark of an aggressive pediatric brainstem glioma in the infratentorial compartment.
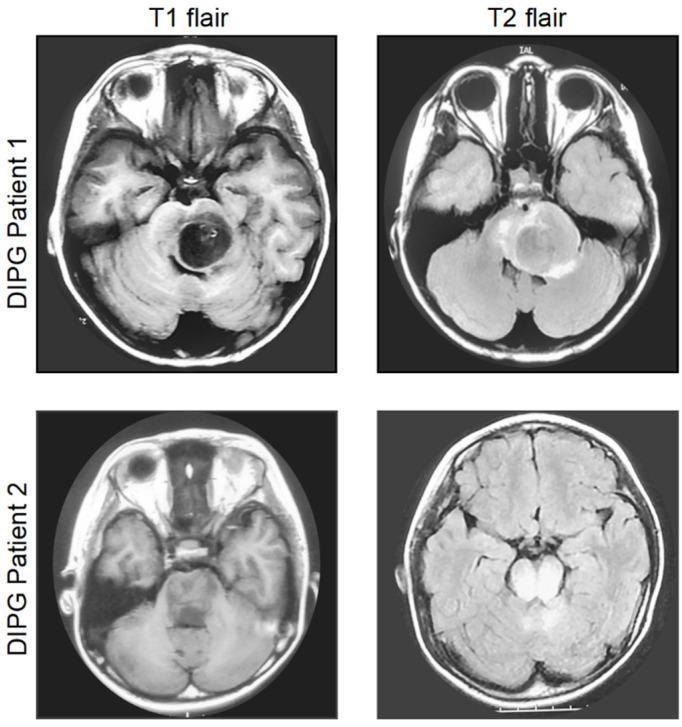
This diagnostic imaging panel presents axial brain MRI scans from two pediatric patients demonstrating radiographically classic Diffuse Intrinsic Pontine Glioma (DIPG). The panel is organized into a 2x2 grid comparing T1-weighted (left) and T2-weighted (right) sequences for Patient 1 and Patient 2. In both cases, the MRI reveals a hallmark space-occupying lesion centrally located within the pons. Patient 1 displays a well-defined pontine mass that is predominantly hypointense to isointense on T1 with a dark central core, appearing hyperintense on T2. Patient 2 exhibits a more ill-defined, expansive lesion that significantly enlarges the pons, showing similar T1 hypointensity and T2 hyperintensity. The images demonstrate the characteristic 'expansile' nature of DIPG, which typically involves more than 50% of the pons and often engulfs the basilar artery. These scans illustrate the essential role of MRI in diagnosing high-grade brainstem gliomas in children based on anatomical location and signal intensity characteristics relative to normal brain tissue.
ATRT atypical teratoid rhabdoid tumor posterior fossa infant MRI
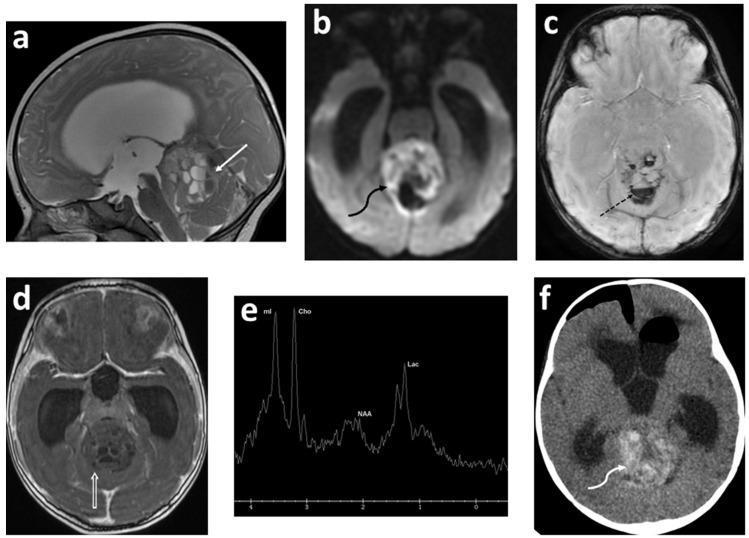
Multi-modal neuroimaging of a five-month-old infant demonstrating a large posterior fossa mass pathologically confirmed as an atypical teratoid rhabdoid tumor (ATRT). (a) Sagittal T2-weighted MRI shows a heterogeneous, cystic-solid mass in the superior/anterior cerebellar vermis effacing the fourth ventricle, with visible fluid-fluid levels within cystic components. (b) Axial Diffusion-Weighted Imaging (DWI) demonstrates areas of restricted diffusion, suggesting high cellularity. (c) Axial SWAN sequence reveals internal hemorrhage (hypointense signals). (d) Axial T1 inversion recovery post-contrast image shows a lack of significant enhancement. (e) Proton MR spectroscopy (H-MRS) displays a high Choline (Cho) peak, markedly elevated Myoinositol (mI), decreased N-acetylaspartate (NAA), and a present Lactate (Lac) doublet, characteristic of aggressive embryonal tumors. (f) Axial non-contrast CT shows high-density areas within the mass consistent with acute hemorrhage, and evidence of post-ventricular shunt placement. The imaging collectively illustrates a malignant pediatric CNS embryonal tumor causing mass effect and obstructive hydrocephalus.
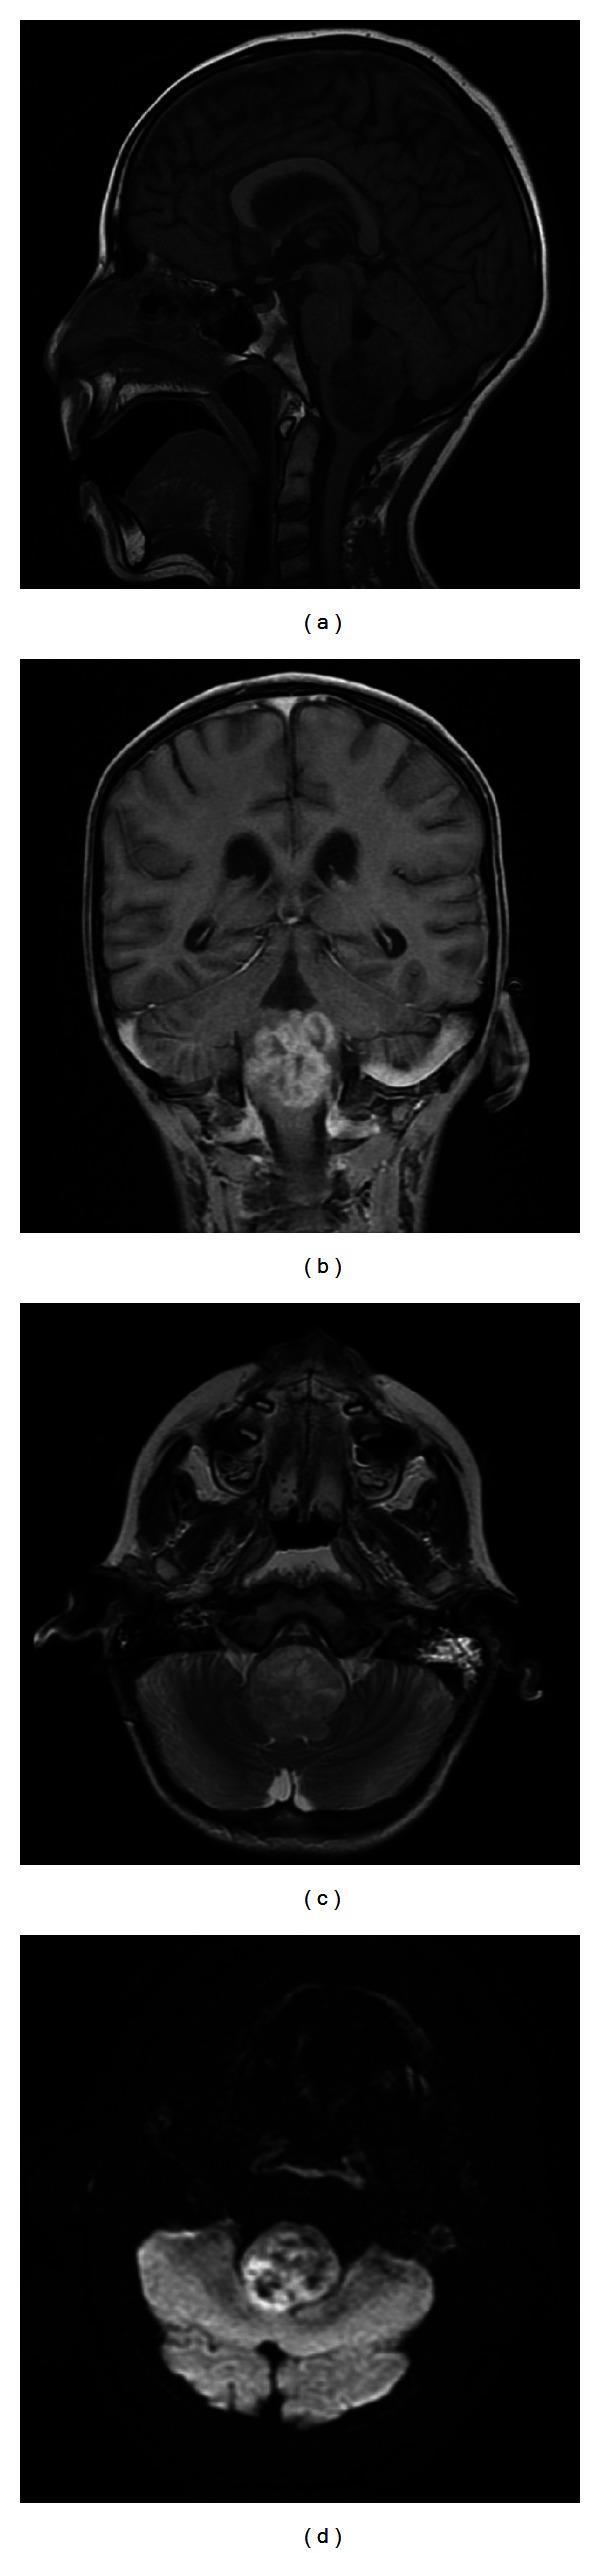
A multi-paneled diagnostic MRI series illustrating the neuroradiological features of an Atypical Teratoid Rhabdoid Tumor (ATRT) in the posterior fossa. Panel (a) is a sagittal T1-weighted image showing a large, heterogeneous, exophytic mass centered in the medulla and lower brainstem with dorsal extension into the fourth ventricle. Panel (b) shows a postcontrast coronal T1-weighted image demonstrating robust, heterogeneous contrast enhancement of the mass. Panel (c) is a transaxial T2-weighted sequence highlighting significant compression of the ventral medulla and displacement of adjacent structures. Panel (d) displays a transaxial diffusion-weighted imaging (DWI) sequence where the tumor exhibits hyperintense signal, indicating restricted diffusion, which is a characteristic feature of highly cellular tumors like ATRT. The imaging demonstrates typical pediatric neuro-oncological findings including mass effect on the brainstem and lack of prominent surrounding vasogenic edema. This sequence is representative of diagnostic workups for pediatric brainstem tumors and emphasizes the role of multi-planar, multi-sequence MRI in characterizing tumor morphology and cellularity.
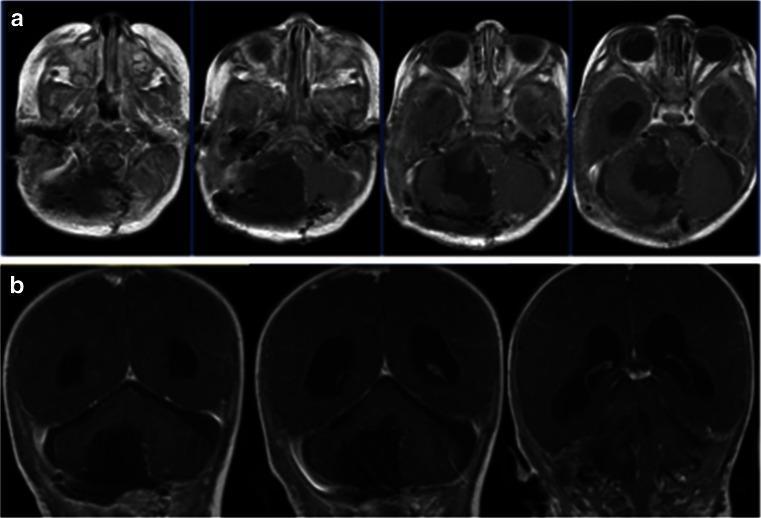
Diagnostic post-operative MRI scans of a pediatric patient following surgical resection of an atypical teratoid/rhabdoid tumor (ATRT). The image consists of two rows: (a) axial T1-weighted post-contrast sequences and (b) coronal T1-weighted post-contrast sequences. The images demonstrate a significant resection cavity in the right posterior fossa, specifically within the right cerebellar hemisphere, extending toward the cerebellopontine angle (CPA). There is a notable absence of abnormal contrast enhancement, indicative of a gross total resection with no immediate evidence of residual tumor tissue. The brain parenchyma in both the infratentorial and supratentorial compartments appears relatively symmetrical, and the ventricular system shows normal morphology and size without signs of hydrocephalus. Bony structures of the skull base remain intact, though post-surgical changes related to the posterior fossa craniotomy are visible. This imaging illustrates successful radical surgical management of a high-grade pediatric brain tumor.
posterior fossa four tumors comparison hemangioblastoma ependymoma pilocytic astrocytoma medulloblastoma MRI
A comparative diagnostic imaging panel displaying four representative posterior cranial fossa tumors—Hemangioblastoma, Ependymoma, Medulloblastoma, and Pilocytic Astrocytoma—across four MRI sequences: post-contrast T1-weighted (Post), T2-weighted (T2), Diffusion-Weighted Imaging (DWI), and Apparent Diffusion Coefficient (ADC) maps. The Hemangioblastoma demonstrates a cystic morphology with a heterogeneously enhancing mural nodule and high ADC signal. The Ependymoma shows homogeneous enhancement and mixed ADC signal. The Medulloblastoma is characterized by significant restricted diffusion, indicated by high signal on DWI and corresponding low signal on ADC, typical of highly cellular tumors. The Pilocytic Astrocytoma exhibits a well-defined cystic component with a solid enhancing portion and high ADC signal. These axial views highlight key neuroradiological features used to differentiate common pediatric and adult intra-axial tumors of the cerebellum and fourth ventricle, emphasizing the clinical significance of ADC values and enhancement patterns in neuro-oncological diagnosis.
This educational image displays Proton MR Spectroscopy (1H-MRS) profiles and corresponding T2-weighted axial MRIs for common pediatric posterior fossa tumors. Panel A illustrates Pilocytic Astrocytoma, characterized by elevated lactate (Lac), lipids, and N-acetylated sugars (~3.8 ppm), with low creatine (Cr) and myo-inositol (mI). Panel B shows Ependymoma, featuring variable lipid levels and myo-inositol peaks. Section C provides a comparison of four Medulloblastoma molecular subgroups: (i) Group 3, (ii) Group 4, (iii) Sonic Hedgehog (SHH), and (iv) WNT. The medulloblastoma spectra generally demonstrate high Choline (Cho) peaks and varying presence of Taurine (Tau) and Glycine (Glyc) at ~3.4-3.5 ppm. The accompanying axial MRI scans show the voxel placement (white boxes) within the cerebellum and fourth ventricle for each tumor type. These metabolic fingerprints assist in differentiating highly cellular medulloblastomas from other cerebellar lesions and investigating subgroup-specific biomarkers. All spectra were acquired at 3T using SV-PRESS (TE=35ms, TR=2s).
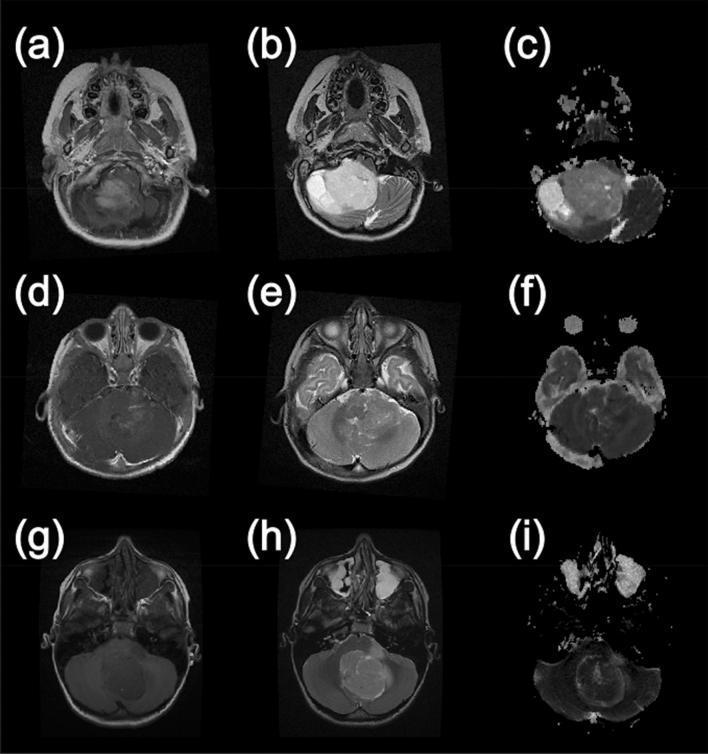
A comparison grid of axial magnetic resonance imaging (MRI) scans demonstrating common pediatric posterior fossa tumors across three imaging modalities: T1-weighted post-gadolinium contrast (left column), T2-weighted (middle column), and Apparent Diffusion Coefficient (ADC) maps (right column). Row 1 (a-c) illustrates a Pilocytic Astrocytoma, characterized by a large, heterogeneous, T2-hyperintense mass with high ADC values (bright signal), reflecting its cystic/microcystic nature. Row 2 (d-f) displays an Ependymoma, showing intermediate T2 signal and intermediate ADC values with less defined borders. Row 3 (g-i) shows a Medulloblastoma, appearing as a midline mass with moderate contrast enhancement and restricted diffusion, evidenced by low ADC values (dark signal) indicating high cellularity. This comparison highlights the diagnostic utility of diffusion-weighted imaging (DWI) and ADC mapping in differentiating pediatric brain tumors by evaluating tissue microstructure and cellular density alongside conventional anatomical sequences.
Imaging of Posterior Fossa Lesions in Children
Background
- Brain and whole-spine MRI at diagnosis (including post-contrast)
- Axial T2, coronal FLAIR, axial T1 pre- and post-contrast in three planes
- DWI/DTI
- Post-op MRI within 24 hours (before reactive enhancement appears)
- Whole-spine post-contrast T1 sagittal (+ axial through any suspicious areas)
Grainger & Allison: "At initial presentation, all paediatric brain tumours should have brain and whole-spine MRI, including contrast-enhanced images."
Classification of Posterior Fossa Lesions in Children
Intra-axial Tumors
- Medulloblastoma
- Cerebellar Low-Grade Astrocytoma (Pilocytic Astrocytoma)
- Ependymoma
- Atypical Teratoid/Rhabdoid Tumor (ATRT)
- Brainstem Glioma (DIPG / Diffuse Midline Glioma)
- Hemangioblastoma (von Hippel-Lindau)
Extra-axial / Other
- Craniopharyngioma
- Dermoid / Epidermoid Cysts
- Langerhans Cell Histiocytosis
- Pineal Region / Germ Cell Tumors
1. Medulloblastoma (WHO Grade 4)
CT
- Hyperdense midline vermian mass (high nuclear-to-cytoplasm ratio, densely packed cells) - most reliable CT sign
- Perilesional edema
- Variable patchy contrast enhancement
- Obstructive hydrocephalus
- Cystic change, hemorrhage, and calcification possible
- Brainstem displaced anteriorly (not invaded)
MRI
- T1: Hypo- to isointense
- T2: Hypointense (key feature - reflects hypercellularity; opposite of most pediatric tumors)
- T1+Gad: Variable, patchy enhancement
- DWI/ADC: Restricted diffusion (low ADC) - most reliable differentiating sign from ependymoma and pilocytic astrocytoma
- MRS: Elevated choline/creatine ratio, reduced NAA, elevated taurine/glycine; occasional lipid/lactate peaks
Grainger & Allison: "CT hyperdensity and MRI T2 hypointensity, supported by restricted diffusion on DWI, are the most reliable observations in prospectively differentiating medulloblastoma from ependymoma or other posterior fossa tumours."
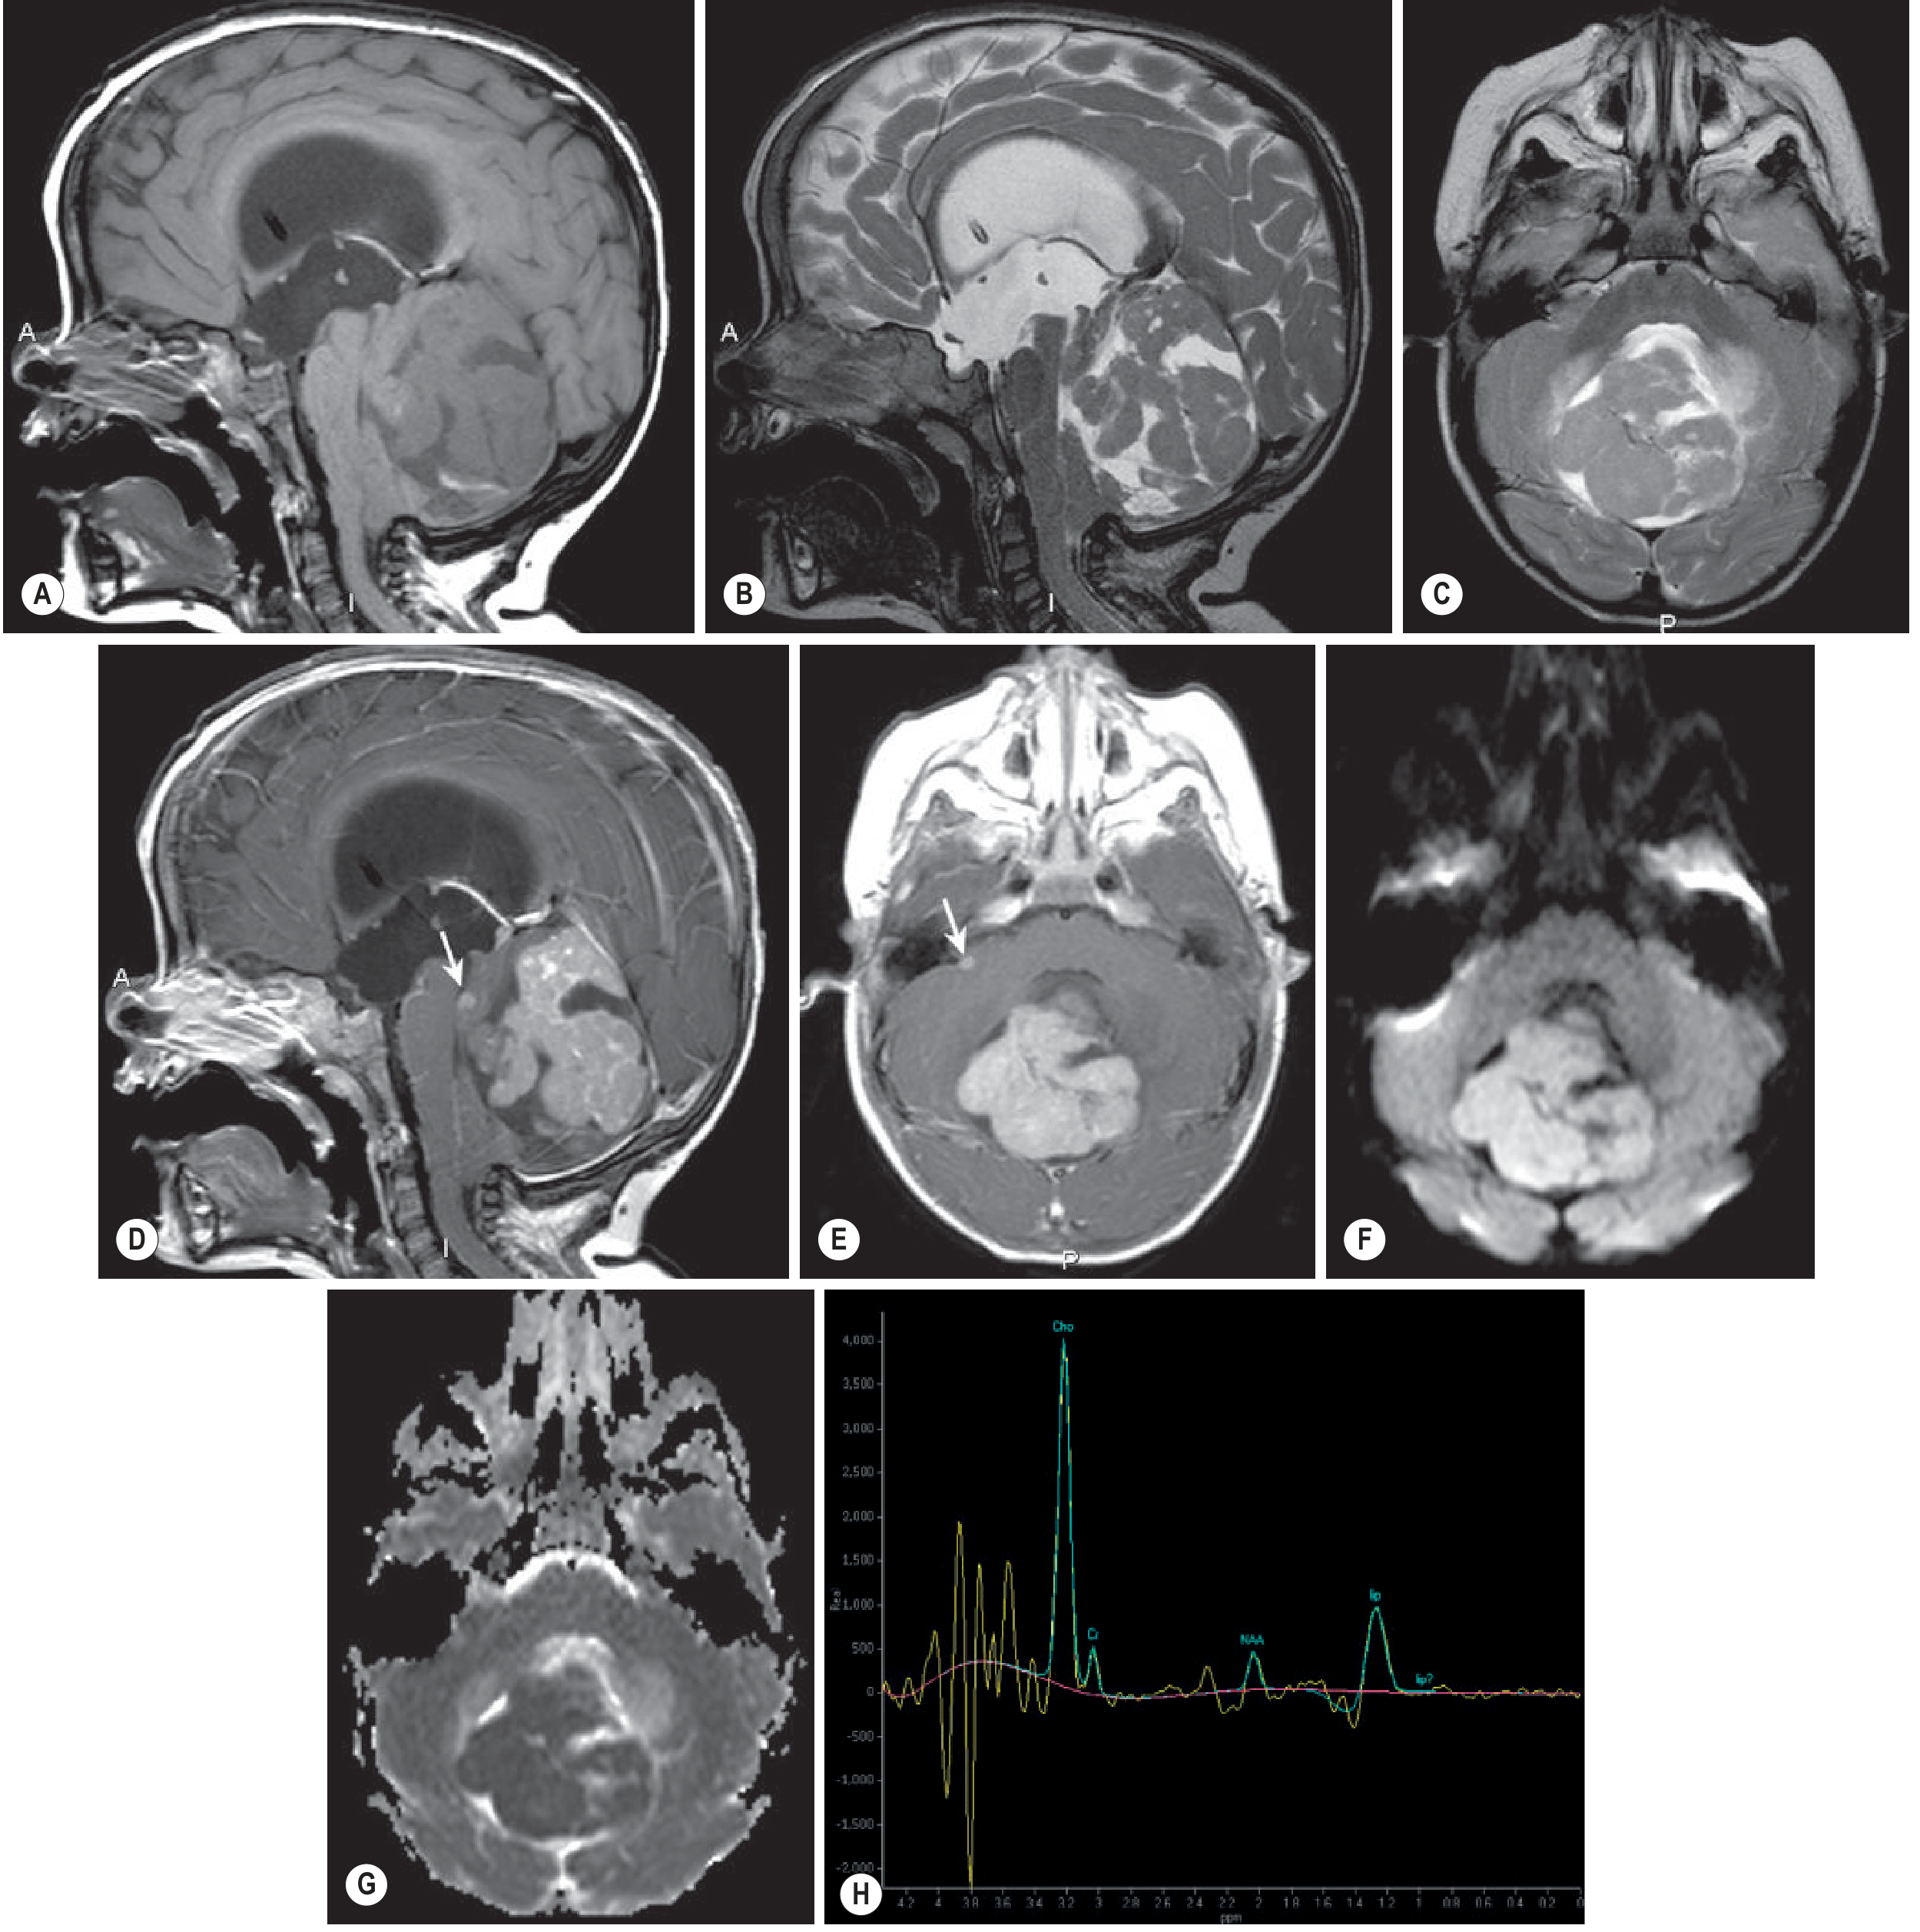
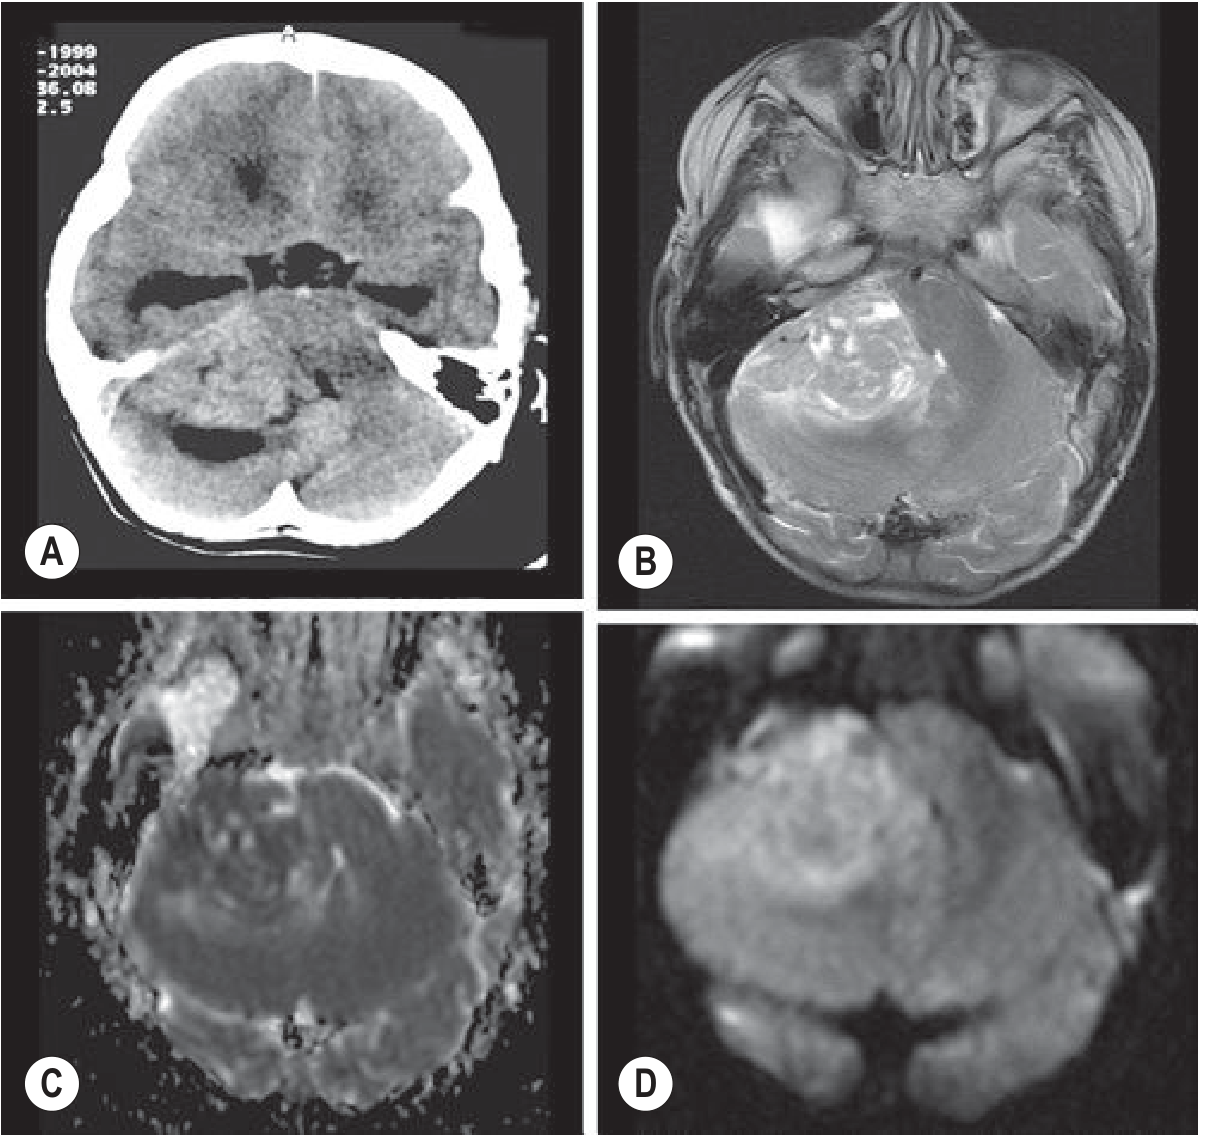
2. Cerebellar Low-Grade Astrocytoma (Pilocytic Astrocytoma, WHO Grade I)
CT
- Hypo- to isodense cystic mass
- Solid enhancing mural nodule
- No CT hyperdensity (unlike medulloblastoma)
MRI - Classic Pattern: Cyst + Enhancing Mural Nodule
- T1: Hypointense cyst; isointense nodule
- T2: Hyperintense (cystic/microcystic, hypocellular, loose architecture - opposite of medulloblastoma)
- T1+Gad: Avid, homogeneous enhancement of solid nodule (deficient BBB); cyst wall may or may not enhance
- DWI/ADC: High ADC, no restriction (low cellularity) - key differential from medulloblastoma
- FLAIR: Hyperintense
Grainger & Allison: "The solid component is highly vascular with a deficient blood-brain barrier and therefore enhances avidly and homogeneously."
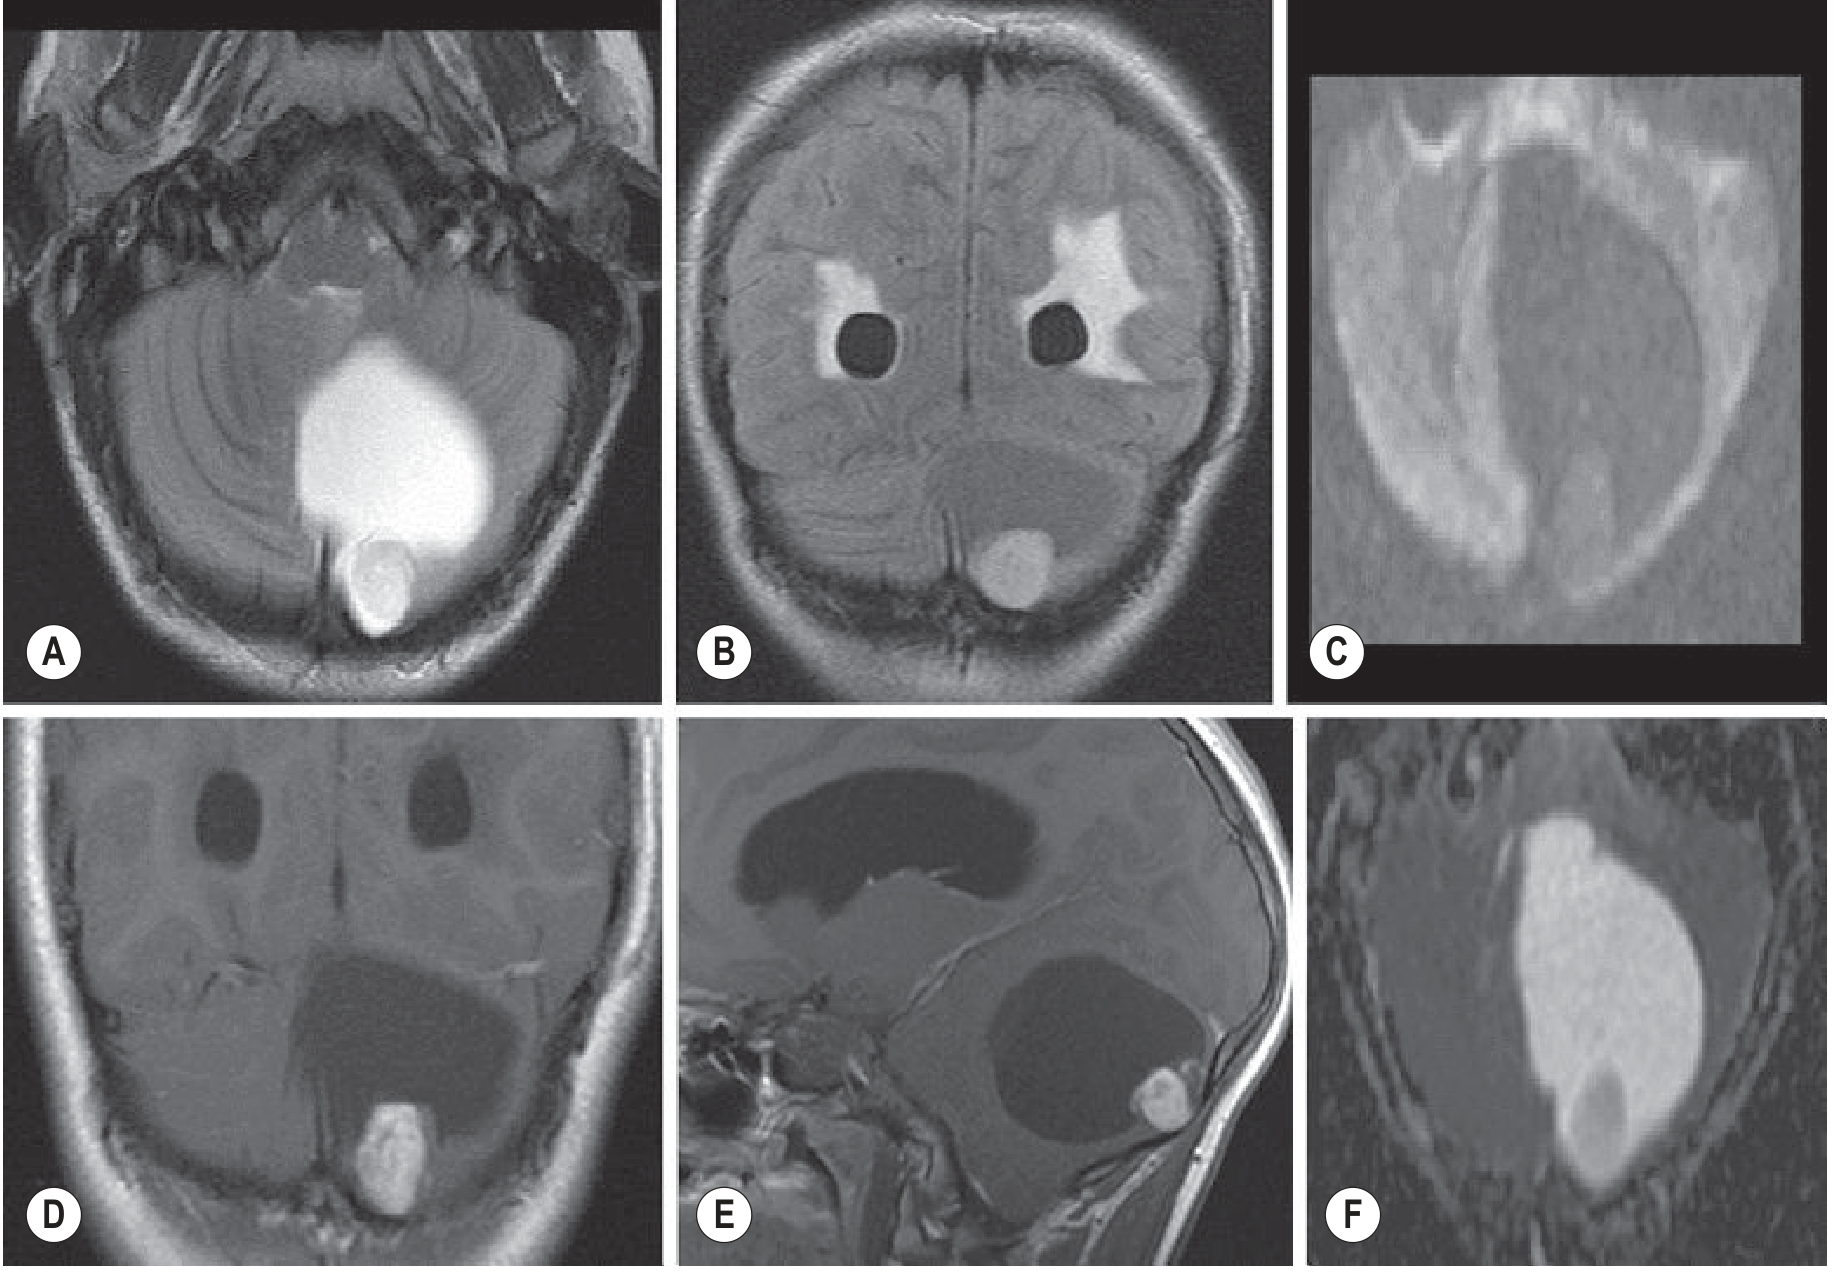
3. Ependymoma (WHO Grade II)
CT
- Iso- to hypodense (more water content than medulloblastoma - distinguishing feature)
- Calcification in up to 50% (important clue)
- Variable enhancement
- Obstructive hydrocephalus
MRI
- T1: Hypointense
- T2: Isodense to hyperintense (more water/less cellular than medulloblastoma)
- T1+Gad: Variable, heterogeneous enhancement
- DWI/ADC: Higher ADC than medulloblastoma (less cellularity) - key differential
- SWI: Blooming from calcification / microhemorrhage
- Pathognomonic sign: "Plastic" toothpaste-like extension through foramina of Luschka (laterally into CPA) and Magendie (inferiorly toward foramen magnum) - tumor molds around structures
Grainger & Allison: "They typically originate from the floor or roof of the fourth ventricle, extend into the cerebellopontine angle and extrude through the foramina of Luschka and Magendie."
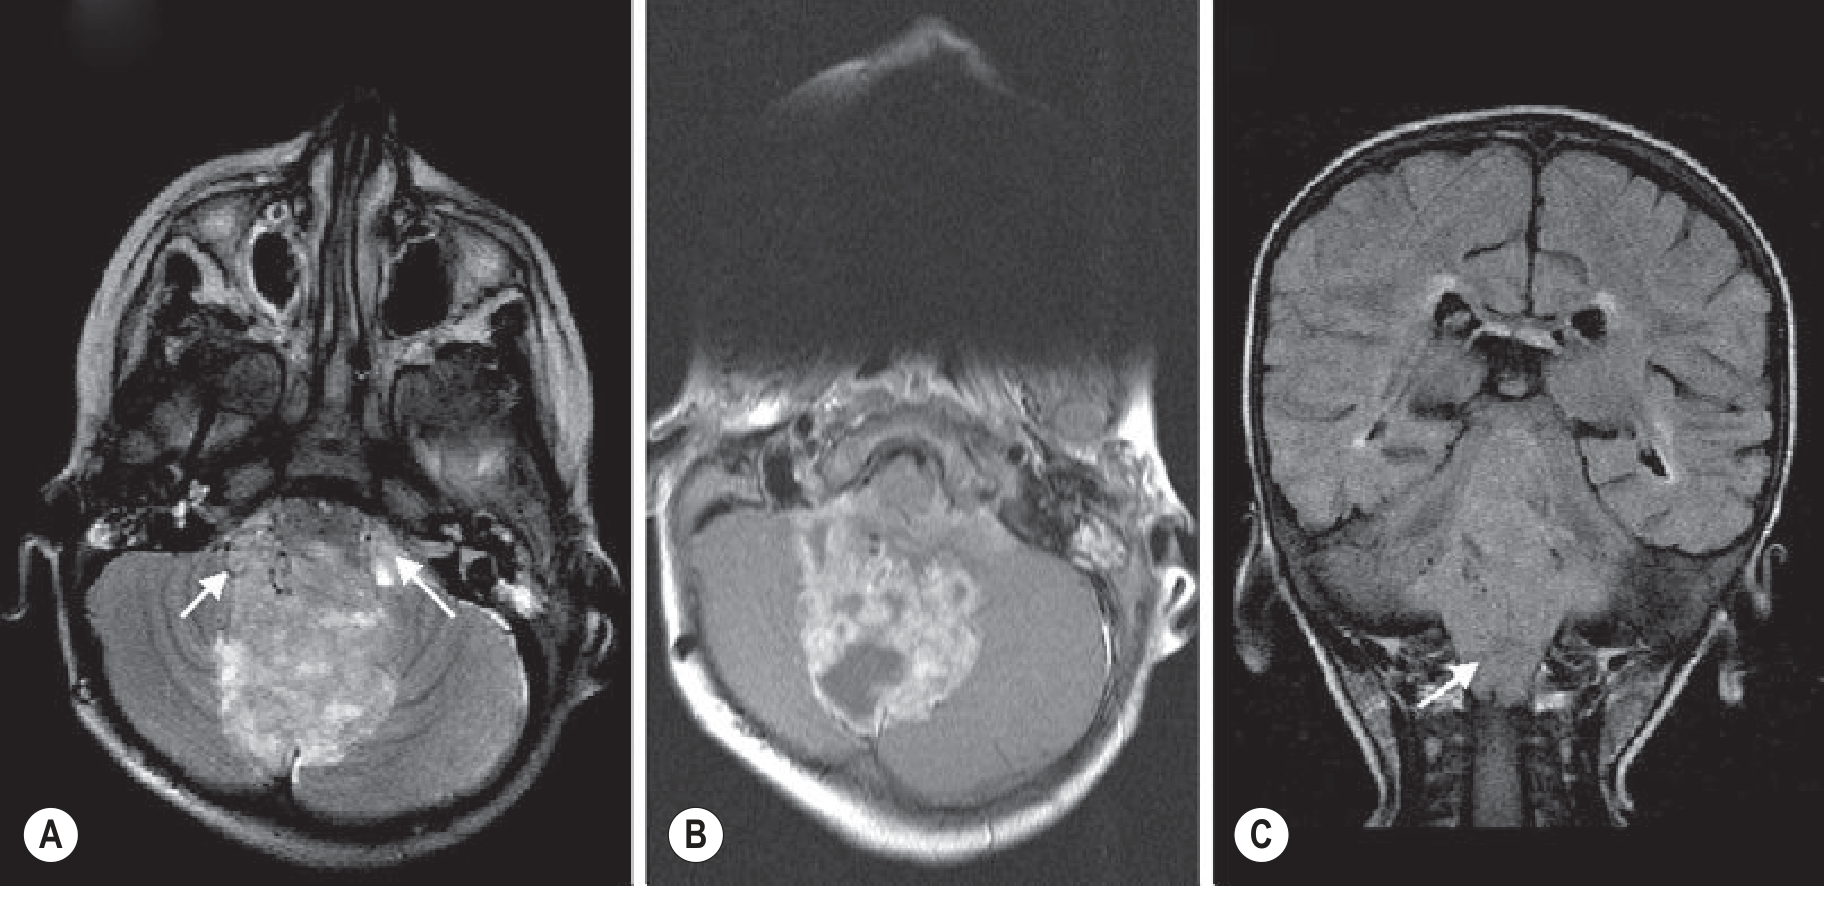
4. Atypical Teratoid/Rhabdoid Tumor (ATRT)
Imaging
- CT hyperdense
- T2 hypointense (high cellularity)
- DWI: Restricted diffusion
- Hemorrhagic components (more common than medulloblastoma)
- Heterogeneous enhancement
Grainger & Allison: "For practical purposes, the imaging features are indistinguishable from medulloblastoma. They are often large at time of presentation and occur in slightly younger children, typically younger than the age of 2 years."
5. Brainstem Glioma / DIPG (Diffuse Midline Glioma, H3K27M-mutant)
A. Diffuse Type (DIPG / Diffuse Midline Glioma)
- Location: Pons (most common); may involve midbrain and medulla
- CT: Hypodense/isodense expansion of pons; CT often underestimates extent
- MRI:
- T2/FLAIR: Diffuse hyperintensity with expansion of >50% of the pons axial cross-section
- T1: Hypointense
- T1+Gad: Minimal or no enhancement (distinguishes from other tumors; enhancement may appear after irradiation or at progression)
- Envelops but does not occlude the basilar artery (characteristic "basilar artery engulfment" sign)
- No biopsy needed if classic imaging - diagnosis made on MRI appearance alone
Grainger & Allison: "Diffuse tumours extend up and down the brainstem and are seen best as ill-defined signal hyperintensity on T2 weighted (including FLAIR) images in association with expansion of the brainstem. Their enhancement if present is usually minimal."
B. Focal Exophytic Type
- Usually dorsally exophytic from dorsal brainstem, growing outward rather than along white matter tracts
- Better prognosis than diffuse type
- Well-defined, enhancing (usually pilocytic or grade II astrocytoma)
- Tumors confined to the midbrain tectum have the best prognosis of all
6. Hemangioblastoma (VHL-associated in children)
Imaging
- Cyst + intensely enhancing mural nodule - mimics pilocytic astrocytoma
- Nodule abuts the pial surface
- Distinguishing features from CLGA:
- Prominent vascular flow voids around the lesion (tortuous feeding/draining vessels)
- Hemorrhage and frank necrosis more common
- Angiography: Rich tumor vascularity
7. Craniopharyngioma
CT
- Calcification in >90% (virtually pathognomonic) - rim, nodular, or eggshell pattern
- Mixed solid-cystic with hyperdense cystic components (cholesterol/"machine oil" content)
- Solid enhancing components
MRI
- T1: Cysts show T1 shortening (high signal) due to proteinaceous/cholesterol content
- T2: Cysts hyperintense on T2 FSE
- T1+Gad: Intense enhancement of solid components; cyst wall may enhance
- MRS: High lipid peaks
Grainger & Allison: "The cystic components may extend behind the clivus and into any of the cranial fossae... T1 shortening due to proteinaceous components, which have been described macroscopically as appearing like 'machine oil'."
Comparison Table: "Big Four" Posterior Fossa Tumors in Children
| Feature | Medulloblastoma | Pilocytic Astrocytoma | Ependymoma | ATRT |
|---|---|---|---|---|
| Age | Peak 7 yrs; wide range | Children/young adults | Mean 6.4 yrs | <2 years |
| Location | Vermis / 4th V | Vermis or hemisphere | 4th V floor/roof | Posterior fossa, large |
| Symptom onset | <1 month (rapid) | Months (slow) | Weeks-months | Rapid |
| CT density | Hyperdense | Iso/hypodense | Iso/hypodense | Hyperdense |
| T2 signal | Hypointense | Hyperintense | Iso-hyperintense | Hypointense |
| DWI | Restricted (low ADC) | No restriction (high ADC) | High ADC | Restricted |
| Enhancement | Variable, patchy | Avid, homogeneous nodule | Variable, hetero | Variable |
| Calcification | Possible | Rare | ~50% | Possible |
| Hallmark sign | Restricted DWI + T2 dark | Cyst + enhancing nodule | "Plastic" foramen extension | Image = medulloblastoma + age <2 |
| CSF spread | 1/3 at presentation | Rare | Less common | Common |
| Prognosis | 50-80% 5-yr survival | >95% 5-yr survival | ~50% 5-yr PFS | Poor |
Differentiating Key: CT Hyperdensity + T2 Hypointensity (Grainger & Allison Table 76.3)
- Medulloblastoma / ATRT (by far most common)
- Choroid plexus carcinoma
- Ewing sarcoma
- Chondrosarcoma / Chordoma (skull base)
- Lymphoma
- Langerhans cell histiocytosis
Comparative MRI Panel: All Four Tumors
Imaging of facial nerve injury
facial nerve anatomy course temporal bone segments CT MRI imaging
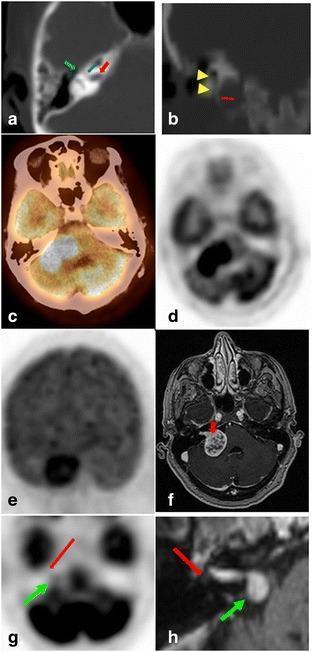
This composite educational graphic displays diagnostic imaging of the internal auditory canal (IAC) and cerebellopontine angle (CPA). Panels A and B utilize high-resolution CT to demonstrate normal temporal bone anatomy, including the facial nerve (CN VII) and vestibulocochlear nerve (CN VIII) segments. Red arrows indicate the IAC portions; blue and green arrows highlight the labyrinthine and tympanic segments of CN VII. Panel B uses the styloid process (red arrow) as a landmark for the stylomastoid foramen (yellow arrowheads). Panels C–F present a clinical case of a hypermetabolic vestibular schwannoma in the right CPA, shown on fused FDG PET/CT (C, D) and coronal MIP (E). The axial T1-weighted contrast-enhanced MRI (F) shows the characteristic 'ice cream cone' morphology of the mass extending into the IAC. Panels G and H compare FDG PET (G) and MRI (H) for a facial nerve schwannoma, characterized by tumor extension along the labyrinthine and tympanic segments of CN VII, distinguishing it from the more common vestibular nerve schwannoma.
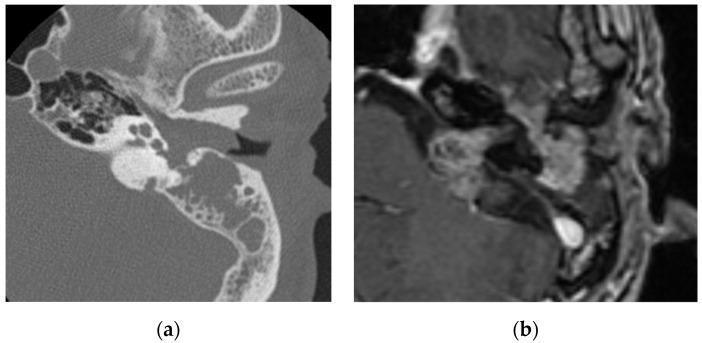
This composite diagnostic image illustrates a facial nerve schwannoma through two imaging modalities. Image (a) is an axial non-contrast computed tomography (CT) scan of the temporal bone, showing a soft-tissue density shadow occupying the external auditory canal, middle ear cavity, and mastoid region. Notably, there is evidence of expansile bone erosion and remodeling around the tympanic and mastoid segments. Image (b) presents a contrasted T1-weighted magnetic resonance image (MRI) of the same region. It reveals a robustly enhancing mass lesion extending along the anatomical course of the facial nerve, involving the cerebellopontine angle, internal auditory canal, and middle ear. The lesion exhibits a characteristic tubular or 'sausage-link' appearance typical of nerve sheath tumors. These visual findings demonstrate the primary features used for differentiating facial nerve schwannomas from other temporal bone masses like hemangiomas or glomus tumors, emphasizing the role of CT in assessing bone destruction and MRI contrast enhancement in delineating perineural tumor spread.
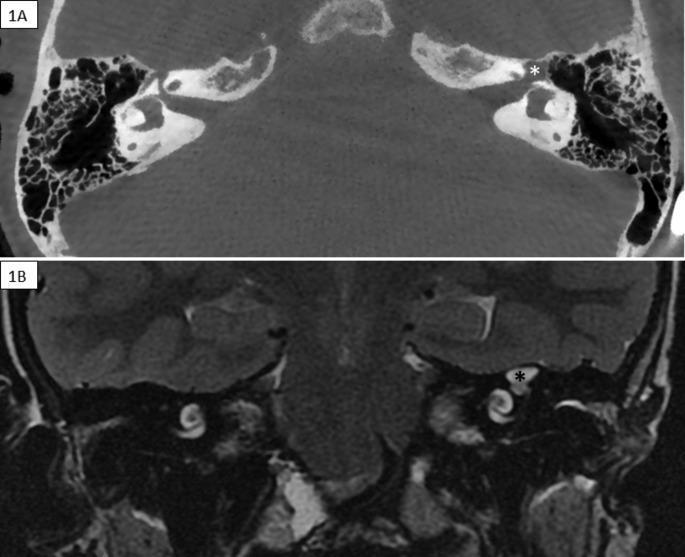
This diagnostic image set consists of two panels comparing the left temporal bone in axial Cone Beam CT (1A) and coronal T2-weighted MRI (1B). The primary finding is fluid ectasia localized at the left geniculate ganglion, marked with an asterisk (*). In the Cone Beam CT, the area appears as a focal, well-defined region of low density (hypodense) compared to the adjacent dense petrous bone. In the T2-weighted MRI, the same region demonstrates high signal intensity (hyperintense), characteristic of cerebrospinal fluid or fluid collection. This fluid ectasia is shown in continuity with the labyrinthine and tympanic segments of the facial nerve canal. Despite the expansion, the CT imaging shows that the surrounding bony walls remain intact, with no evidence of dehiscence or communication with the ipsilateral middle cranial fossa. Anatomical landmarks such as the mastoid air cells, cochlea, and semicircular canals are visible. The comparison highlights the utility of multimodality imaging in assessing facial nerve pathology and associated fluid leaks within the temporal bone.
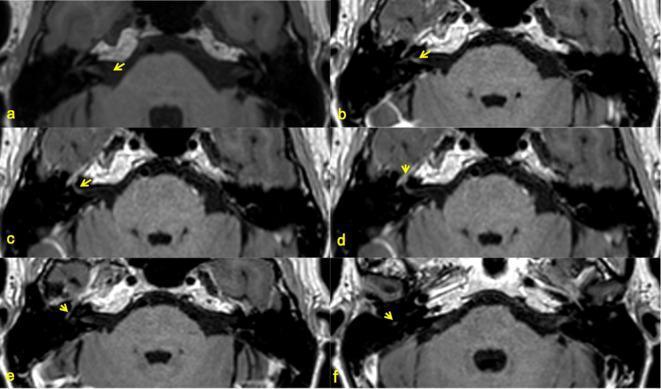
A series of six axial magnetic resonance imaging (MRI) scans using 3D T1-weighted Fast Spin Echo (FSE) sequences, labeled (a) through (f). The images provide high-resolution views of the posterior cranial fossa at the level of the pons and the petrous part of the temporal bone. Yellow arrows specifically point to the various anatomical segments of the facial nerve (Cranial Nerve VII) to illustrate its course and signal intensity characteristics. The segments identified include: (a) medial canalicular and (b) fundal canalicular portions within the internal auditory canal (IAC); (c) the labyrinthine segment; (d) the geniculate ganglion at the first genu; (e) the tympanic (horizontal) segment; and (f) the mastoid (vertical) segment. These diagnostic images are used for neuroradiological assessment of nerve morphology and pre-gadolinium signal baseline. Key anatomical landmarks visible include the brainstem (pons), cerebellum, and the bony labyrinth of the inner ear, which presents with low signal (dark) on these T1-weighted views compared to the intermediate signal of the brain parenchyma.
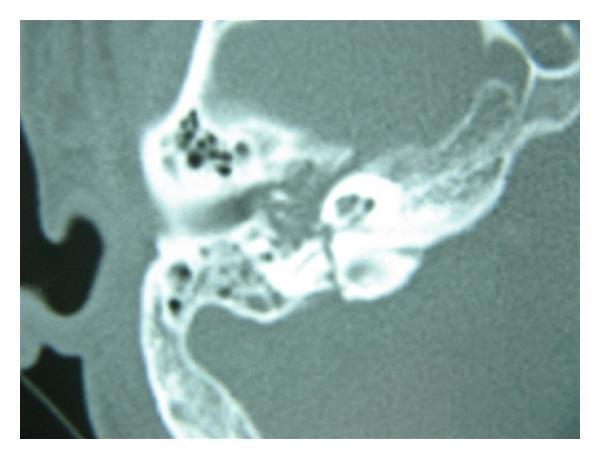
This diagnostic image is a high-resolution axial computerized tomography (CT) scan of the right temporal bone, focused on the petrous and mastoid segments. The scan demonstrates the complex anatomy of the auditory apparatus, including the mastoid air cells (visible as low-density, air-filled honeycomb structures), the external auditory canal, and the middle ear cavity. A sharp, hypodense linear lucency is clearly visible traversing the midportion of the vertical segment of the temporal bone, representing a transverse temporal bone fracture. This fracture line disrupts the high-density cortical bone and is oriented perpendicular to the long axis of the petrous pyramid. Such imaging is critical in evaluating traumatic head injuries, particularly when assessing for risks to the facial nerve canal or potential ossicular chain disruption. This material is suitable for advanced medical education in radiology, otolaryngology, and emergency medicine, illustrating the hallmark radiographic features of temporal bone trauma.
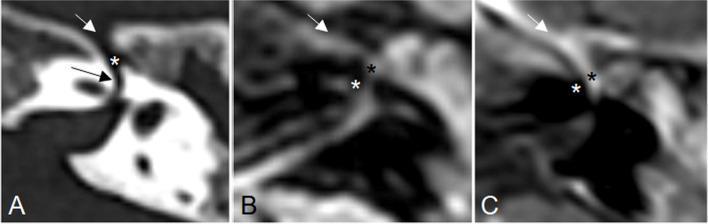
This figure presents axial plane imaging of the left temporal bone through three distinct modalities: high-resolution CT (A), MRI Fluid-Attenuated Inversion Recovery (FLAIR) sequence (B), and T1-weighted post-contrast MRI (C). Image A serves as an anatomical reference, identifying the bony canal of the labyrinthine segment of the facial nerve (black arrow), the bony canal of the greater petrosal nerve (white arrow), and the geniculate ganglion fossa (asterisk). Images B and C demonstrate clinical pathology in these same regions. Specifically, image B exhibits hyperintensity on the FLAIR sequence involving the geniculate ganglion (black asterisk), the labyrinthine portion of the facial nerve (white asterisk), and the proximal greater petrosal nerve (white arrow). Image C shows corresponding subtle T1 contrast enhancement in these anatomical locations. These imaging findings are characteristic of an inflammatory process affecting the facial nerve complex, such as Bell's palsy or secondary inflammation from acute otitis media, where nerve edema and blood-nerve barrier breakdown lead to hyperintensity and enhancement, respectively.
Bell's palsy facial nerve gadolinium enhancement MRI geniculate ganglion labyrinthine segment
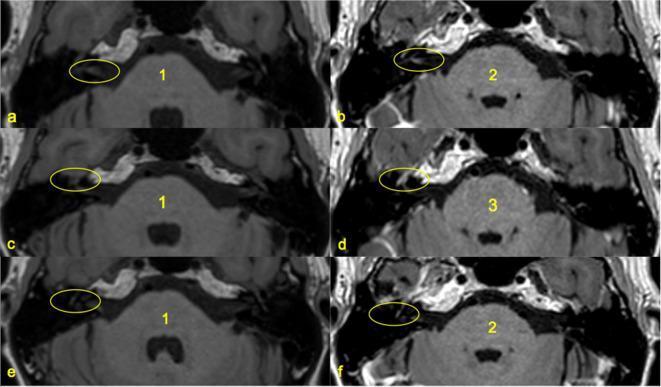
This diagnostic imaging set consists of six 3D T1-weighted Fast Spin Echo (FSE) MRI axial slices at the level of the pons and internal auditory canals. The panels demonstrate a qualitative Likert scoring system (0–3) for gadolinium contrast enhancement of various facial nerve (CN VII) segments. Panels a, c, and e represent pre-contrast images where the facial nerve segments (circled in yellow) show a baseline signal intensity equivalent to the brainstem (Score 1). Panels b, d, and f represent post-gadolinium sequences showing different grades of pathological enhancement. Panels a and b compare the fundal canalicular segment, showing an increase to Score 2 (signal intensity between brainstem and subcutaneous fat). Panels c and d compare the geniculate ganglion, showing a marked increase to Score 3 (signal intensity equal to subcutaneous fat). Panels e and f compare the tympanic segment, showing an increase to Score 2. This comparison is clinically significant for evaluating inflammatory or neoplastic conditions of the facial nerve, such as Bell's palsy or Ramsay Hunt syndrome, by quantifying blood-nerve barrier breakdown.
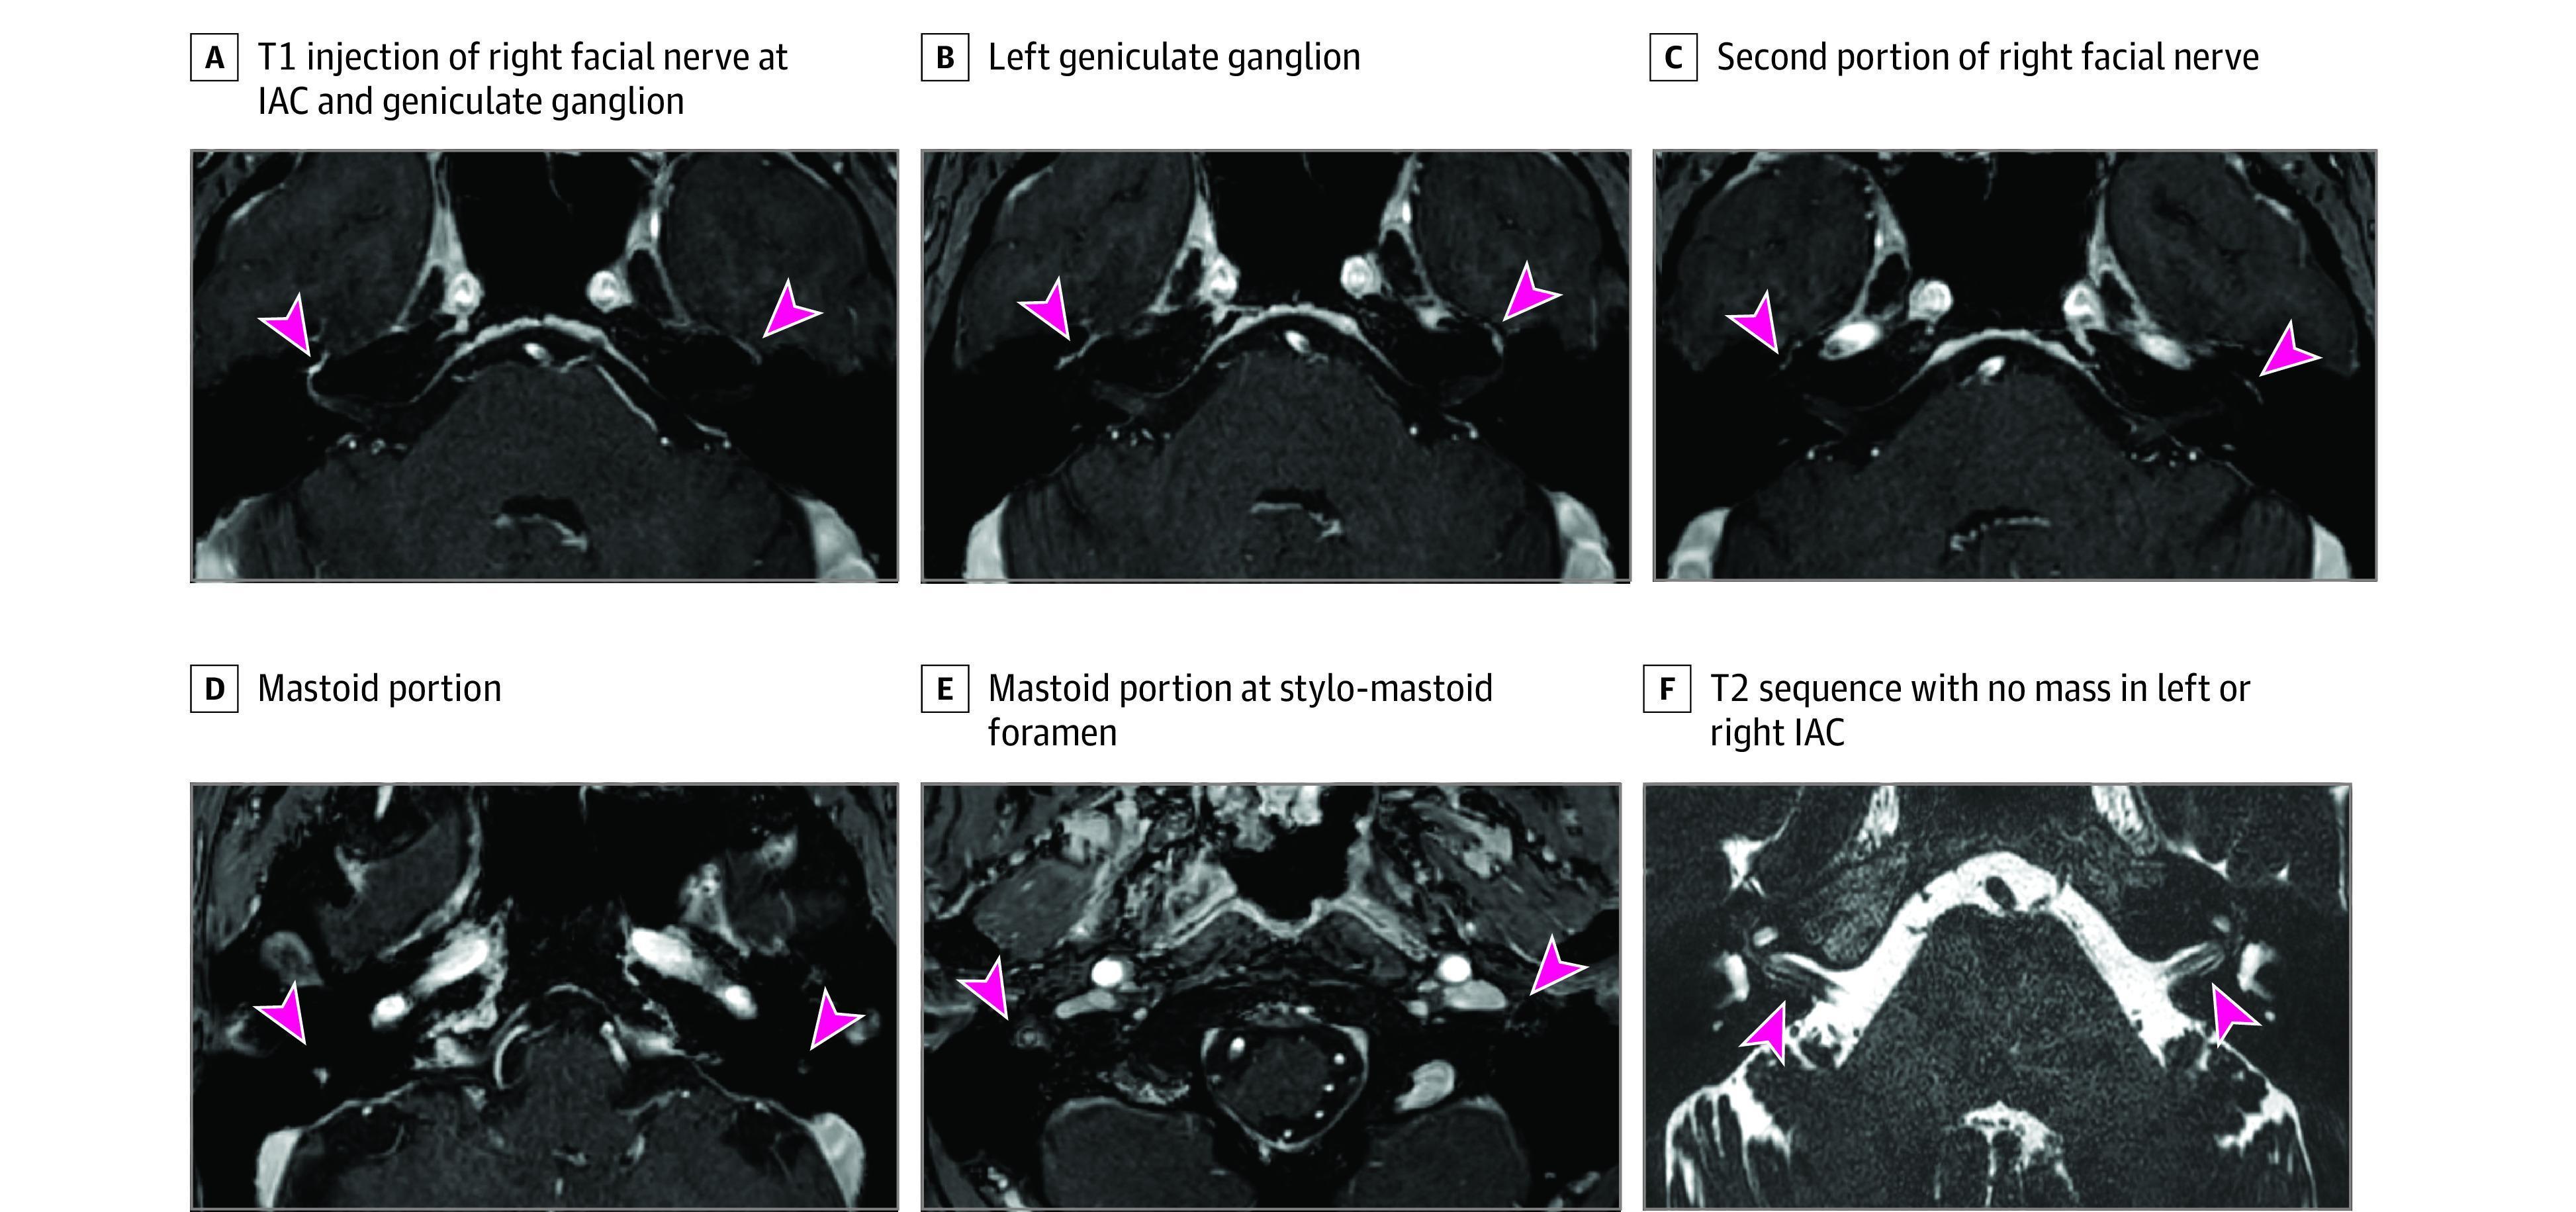
This set of six axial MRI images (A-F) illustrates the diagnostic imaging findings of idiopathic peripheral facial palsy (Bell's palsy) in a middle-aged patient. Images A through E are T1-weighted sequences following gadolinium administration, demonstrating nonnodular hyperintensity and contrast enhancement of the right facial nerve across various segments. Specific anatomical regions highlighted by pink arrowheads include the internal auditory canal (IAC), the geniculate ganglion, the tympanic (second) portion, the mastoid (third) portion, and the nerve's exit at the stylomastoid foramen. The left facial nerve is indicated for side-by-side comparison, showing normal, minimal-to-no contrast uptake. Image F is a submillimeter-resolution T2-weighted sequence used to rule out compressive lesions or masses, showing a clear, unobstructed internal auditory canal bilaterally. The clinical significance of these findings is to confirm facial nerve neuritis while excluding alternative etiologies like vestibular schwannoma or lymphoma.
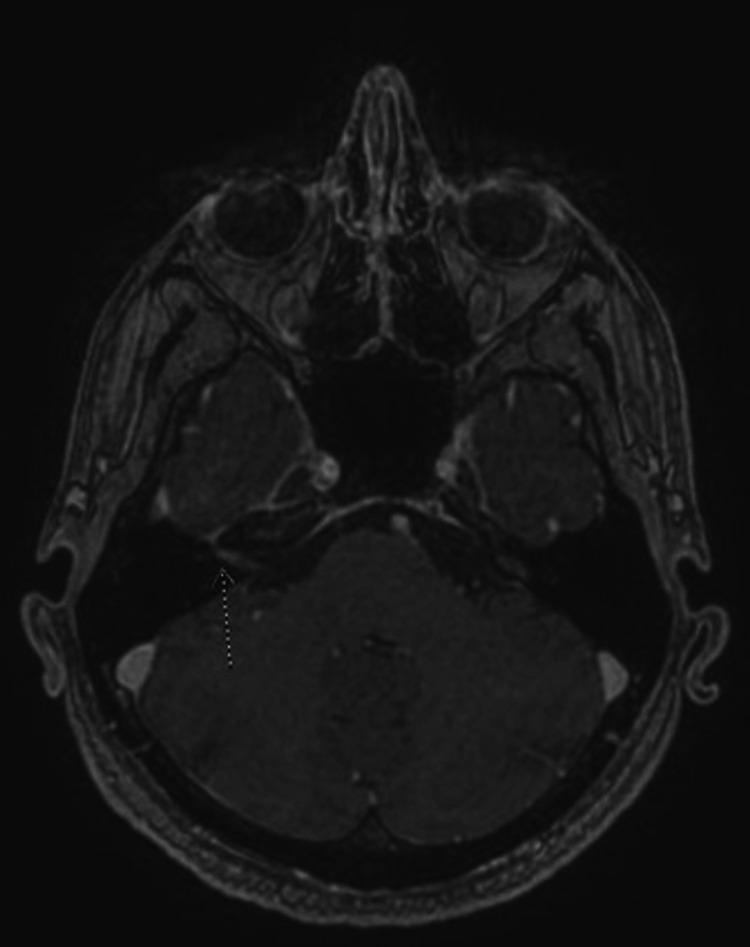
This diagnostic image is an axial T1-weighted post-contrast magnetic resonance imaging (MRI) scan of the brain at the level of the internal auditory canal. The scan provides a cross-sectional view of the posterior fossa and skull base, clearly delineating the cerebellum, temporal lobes, and sphenoid sinus. A prominent white dashed arrow indicates a focal pathological finding on the anatomical right side: asymmetric gadolinium enhancement of the facial nerve (Cranial Nerve VII) within the internal auditory canal and labyrinthine segment. This hyperintensity is notably absent in the corresponding contralateral (left) facial nerve, representing a significant diagnostic sign of neuritis. This radiological finding is clinically significant for the diagnosis of Bell's palsy (idiopathic facial nerve paralysis), demonstrating the inflammatory enhancement and edema typically associated with the condition. The image serves as a high-level educational resource for neurology and radiology students to identify cranial nerve pathology and understand the role of contrast-enhanced MRI in evaluating lower motor neuron facial nerve palsy.
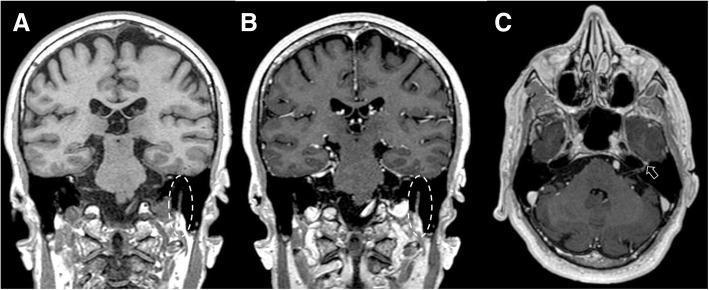
This set of diagnostic MRI images illustrates a clinical case of Bell’s palsy (idiopathic facial palsy). The figure comprises three panels: (a) and (b) are T1-weighted coronal views, while (c) is a T1-weighted axial view. Panels (a) and (b) provide a side-by-side comparison of the left facial nerve pre- and post-gadolinium administration. In the pre-contrast image (a), the nerve within the dotted circle displays normal dimensions and signal intensity. In the post-contrast image (b), the same region exhibits marked contrast enhancement and focal swelling, characteristic of inflammation and blood-nerve barrier disruption. Panel (c) is a post-contrast axial slice showing linear enhancement extending along the facial canal toward the geniculate ganglion (indicated by the arrow), which is located within the petrous portion of the temporal bone. These findings represent the typical radiological manifestation of Bell's palsy, distinguishing it from neoplastic processes by the absence of nodularity. The images serve as an educational resource for identifying cranial nerve VII pathology, relevant for neurology, neuroradiology, and emergency medicine specialties.
temporal bone fracture facial nerve CT longitudinal transverse
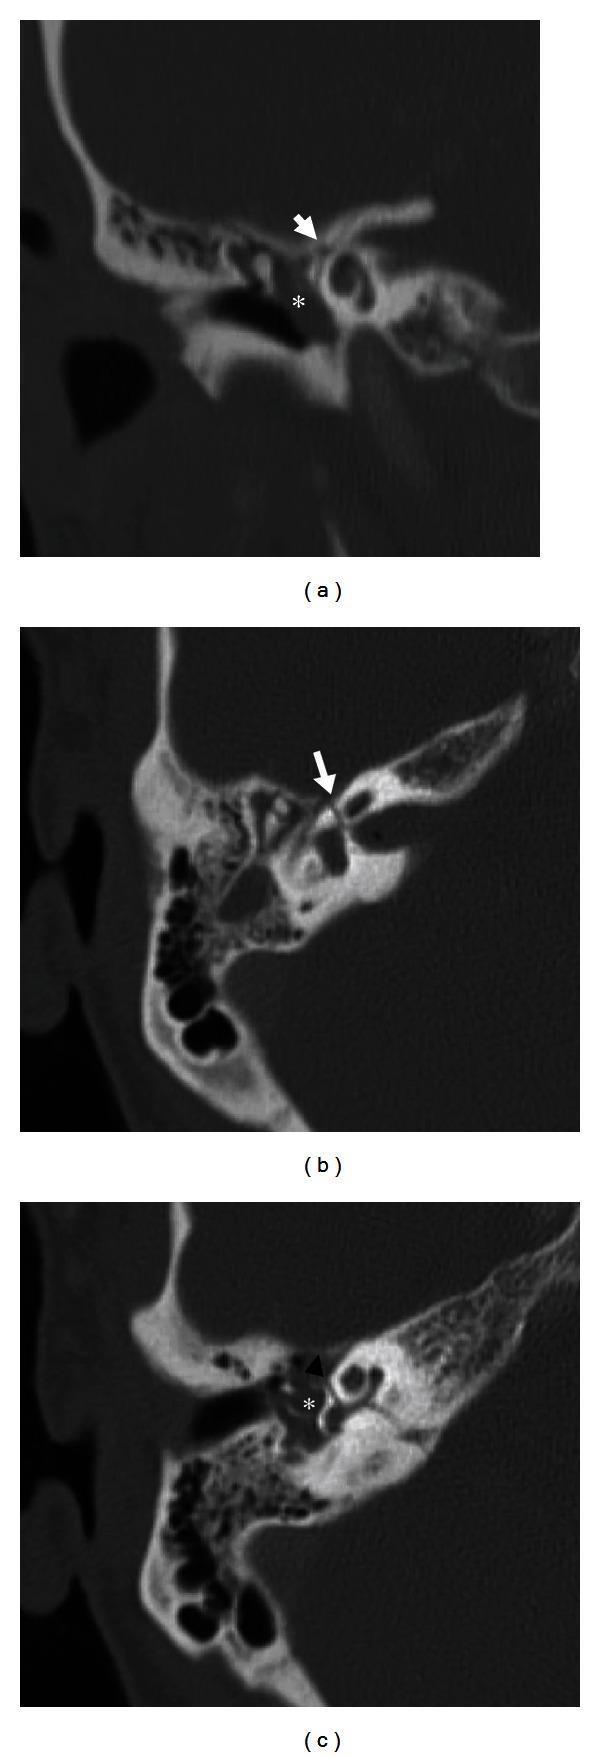
This composite of high-resolution computed tomography (CT) images illustrates a transverse temporal bone fracture, a common cause of traumatic facial nerve injury. The set includes a coronal view (a) and two axial views (b, c). In images (a) and (b), white arrows highlight a transverse fracture line intersecting the labyrinthine segment of the facial nerve canal, which is the narrowest and shortest part of the nerve's course, making it highly susceptible to injury. In axial image (c), a black arrowhead indicates the fracture's extension through the otic capsule and the basal turn of the cochlea, pathology associated with sensorineural hearing loss and vestibular dysfunction. Throughout all three panels, asterisks (*) identify the middle ear cavity, which is opacified by hyperdense material consistent with blood products (hemotympanum). These diagnostic images demonstrate the key radiological findings used to evaluate temporal bone trauma, specifically the relationship between fracture orientation and critical neuro-otologic structures like the facial nerve and inner ear.
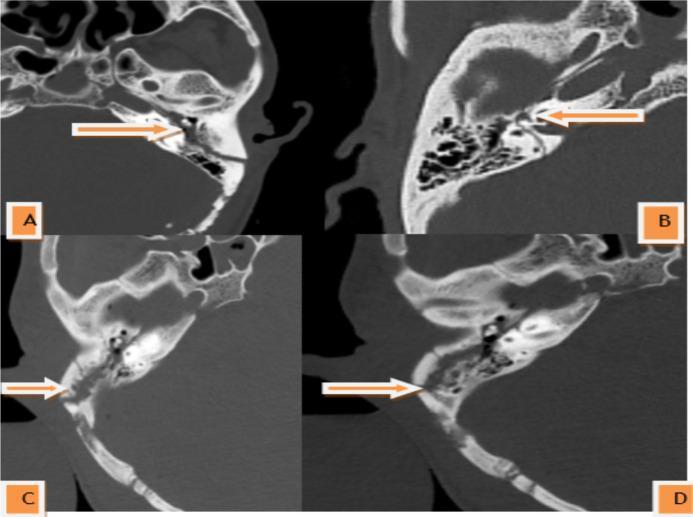
This composite diagnostic image displays four axial non-contrast CT scans of the head in a bone window, specifically illustrating the traditional classification of temporal bone fractures. Image A demonstrates a longitudinal fracture, with the fracture line (indicated by an arrow) running parallel to the long axis of the petrous pyramid, typically associated with otic capsule-sparing trauma and ossicular chain disruption. Image B shows a transverse fracture, where the fracture line runs perpendicular to the long axis of the temporal bone, often involving the otic capsule and increasing the risk of sensorineural hearing loss or facial nerve injury. Images C and D illustrate a mixed fracture pattern, characterized by complex, multi-directional, and branching fracture lines that combine features of both longitudinal and transverse types. The series serves as an educational tool for identifying radiological trauma patterns in the skull base and temporal bone, emphasizing the orientation of fracture lines relative to anatomical landmarks like the petrous ridge and inner ear structures.
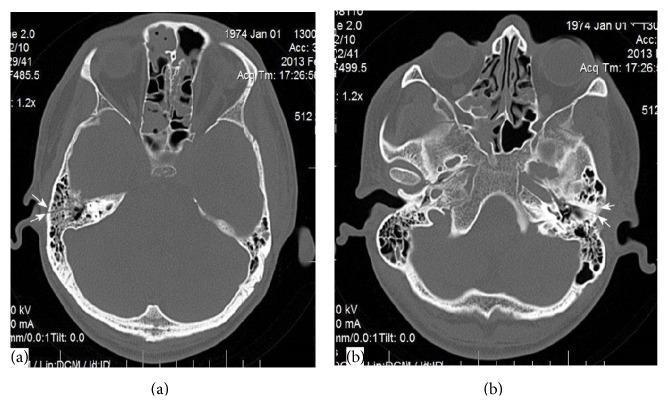
This diagnostic image consists of two axial non-contrast Computed Tomography (CT) scans of the skull base, specifically focusing on the temporal bones. Image (a) displays the right petrous temporal bone, and image (b) displays the left. In both images, white arrows highlight dark, linear radiolucent lines indicating nondisplaced transverse temporal bone fractures. These fractures originate at the posterior aspect of the petrous pyramid and extend across the long axis toward the internal auditory canal. Key anatomical landmarks visible include the mastoid air cells, sphenoid sinus, ethmoid cells, and the bony margins of the posterior and middle cranial fossae. These findings are clinically significant for patients presenting with post-traumatic facial nerve paralysis and sensorineural hearing loss, as transverse fractures are more likely than longitudinal fractures to involve the otic capsule or the internal auditory canal where the VII and VIII cranial nerves reside. This content is intended for medical training in radiology and otolaryngology to differentiate between temporal bone fracture orientations following blunt head trauma.
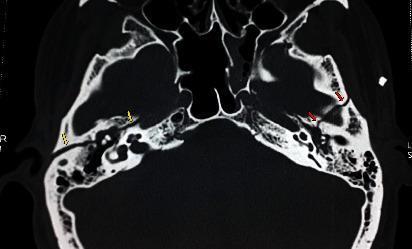
This diagnostic image is a high-resolution axial computerized tomography (CT) scan of the skull base, specifically focusing on the temporal bones at the level of the incudomalleolar joint. The image demonstrates bilateral temporal bone fractures with different orientations. On the patient's right side, yellow arrows indicate a longitudinal temporal bone fracture that appears to be otic-sparing, running parallel to the long axis of the petrous pyramid. On the patient's left side, red arrows highlight a transverse temporal bone fracture, which crosses the petrous ridge perpendicularly. Key anatomical structures visible include the mastoid air cells, the sphenoid bone, and the ossicular chain (incus and malleus) within the middle ear cavity. This scan is educationally significant for distinguishing between longitudinal and transverse fracture patterns and their respective proximity to middle ear structures, which is critical in evaluating trauma-related hearing loss and facial nerve paralysis.
facial nerve schwannoma hemangioma parotid perineural tumor spread MRI enhancement
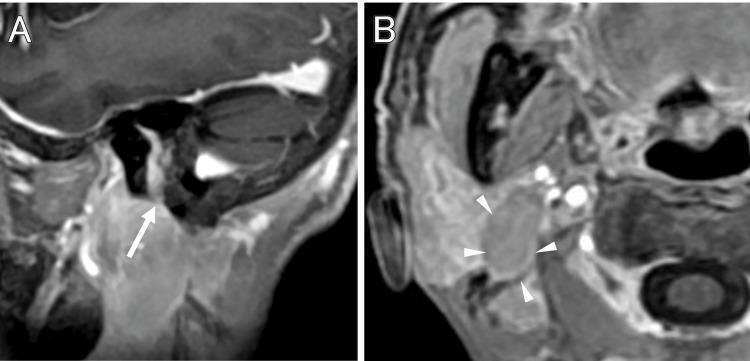
This diagnostic imaging study consists of two contrast-enhanced T1-weighted MRI scans (Panel A: sagittal view; Panel B: axial view) demonstrating a tumor's extracranial extension along the facial nerve pathway. Panel A shows an enhancing, linear-to-irregular lesion passing through the mastoid segment of the facial nerve (marked with a white arrow), extending inferiorly toward the stylomastoid foramen. Panel B illustrates the subsequent infiltration of the right parotid gland. The tumor appears as multiple regions of hyperintense signal (marked with white arrowheads) within the glandular parenchyma, exhibiting an irregular and diffuse enhancement pattern. The visual evidence supports an invasive growth process originating from the internal auditory canal/temporal bone and extending into the cervical soft tissues via the facial nerve canal. This case illustrates the radiological presentation of perineural tumor spread, a critical finding in the differential diagnosis of facial nerve palsy and skull base pathology, such as facial schwannoma or malignant lymphoma.
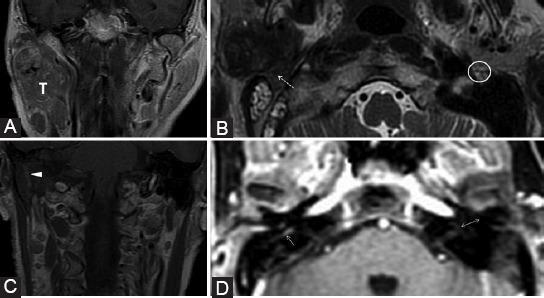
This composite of magnetic resonance imaging (MRI) scans demonstrates a right-sided parotid adenocarcinoma with retrograde perineural spread (PNS) along the facial nerve (CN VII). Image A (coronal contrast-enhanced T1-weighted) shows a large heterogeneous tumor (T) involving both superficial and deep lobes of the right parotid gland. Image B (axial T2-weighted) highlights the effacement of the normal high-signal fat pad at the right stylomastoid foramen (dashed arrow), contrasted with the preserved fat pad on the left (white circle). Image C (coronal contrast-enhanced T1-weighted) illustrates pathological contrast enhancement (arrowhead) along the mastoid segment of the right facial nerve, indicating retrograde neural invasion. Image D (dynamic contrast-enhanced sequence) reveals asymmetric enhancement extending to the right tympanic segment (single arrow) compared to the normal left side (double arrow). These findings are characteristic of malignant perineural tumor dissemination, resulting in the obliteration of normal anatomical fat planes and pathological enhancement of cranial nerve segments, correlating with the patient's presentation of peripheral facial palsy.
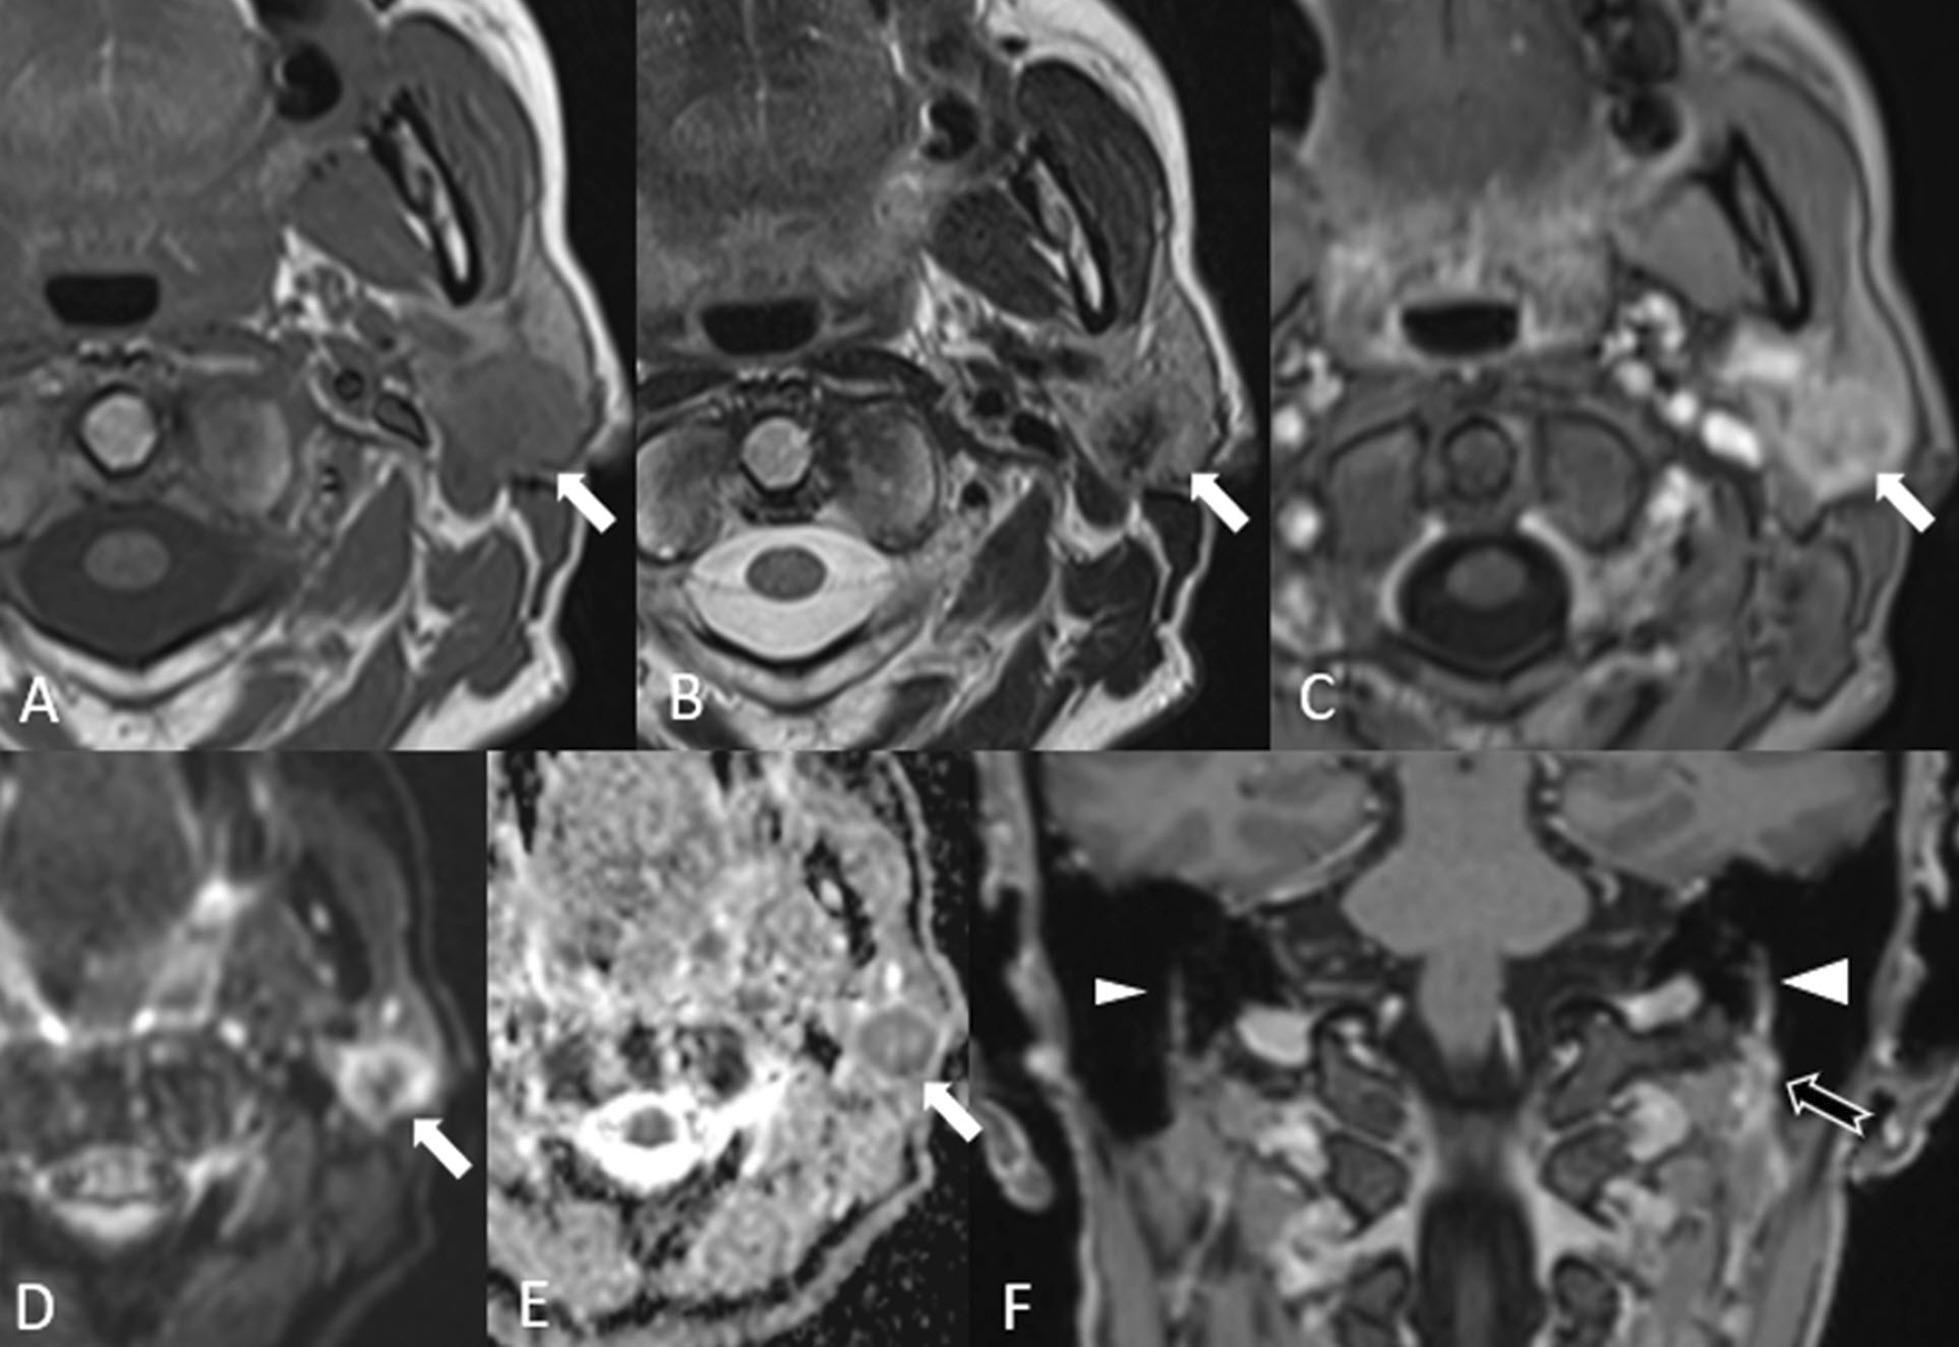
This composite of six diagnostic magnetic resonance (MR) images demonstrates high-grade parotid carcinoma with perineural tumor spread in a 63-year-old patient. (A) Axial T1-weighted image shows a lobulated, hypointense mass in the left parotid gland. (B) Axial T2-weighted image reveals the lesion with central hypointensity. (C) Post-contrast axial T1-weighted image demonstrates heterogeneous enhancement of the primary tumor. (D, E) Diffusion-weighted imaging (DWI) and the corresponding apparent diffusion coefficient (ADC) map show restricted diffusion at the tumor periphery, suggesting high cellularity. (F) Coronal 3D Multi-Planar Reconstruction (MPR) after contrast administration highlights asymmetrical thickening and pathological enhancement of the left facial nerve (indicated by a large arrowhead) compared to the normal right side (small arrowhead). Additionally, there is abnormal enhancing tissue around the left stylomastoid fossa. The visual findings correlate with the clinical presentation of facial paralysis, emphasizing the role of MRI in evaluating malignant invasion and perineural extension in salivary gland oncology.
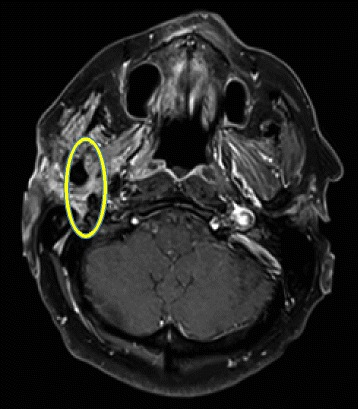
**Imaging Modality:** Axial Magnetic Resonance Imaging (MRI); T1-weighted Turbo Spin Echo (TSE) with Fat Suppression (FS) and gadolinium contrast enhancement. **Anatomical Region:** Axial section of the skull base and head at the level of the internal auditory canals and the parotid glands. **Observed Pathology:** Abnormal thickening and intense contrast enhancement of the right facial nerve (Cranial Nerve VII). The enhancement involves the extracranial segment as it exits the stylomastoid foramen and traverses the parotid region. **Characteristic Visual Features:** * **Signal Intensity:** High signal intensity (bright) on post-contrast T1-weighted imaging, indicating significant enhancement. * **Morphology:** Marked focal thickening and perineural enhancement of the nerve, highlighted within the yellow elliptical marker. * **Symmetry:** Asymmetrical presentation when compared to the contralateral (left) facial nerve, which appears normal in caliber and enhancement. **Clinical Context:** These findings are characteristic of perineural spread of tumor, inflammatory processes (e.g., Bell's palsy), or neoplastic involvement (e.g., facial nerve schwannoma or parotid malignancy extending along the nerve path). **Diagnostic Cues:** Post-contrast enhancement combined with fat suppression allows for clear visualization of pathology against the suppressed signal of adjacent fatty tissues.
Ramsay Hunt syndrome herpes zoster facial nerve MRI enhancement external ear vesicles
This clinical photograph shows a close-up of the right external ear and preauricular region exhibiting characteristic features of Ramsay Hunt syndrome (herpes zoster oticus). The image displays a cluster of small, fluid-filled vesicles on an erythematous base. These herpetic lesions are localized to the pinna and the external auditory canal entrance, which corresponds to the sensory distribution of the facial nerve (cranial nerve VII). Some vesicles appear intact with clear fluid, while others show signs of early crusting or rupture. The surrounding skin exhibits diffuse erythema and mild edema. This presentation is medically significant for medical students and clinicians as it illustrates the typical cutaneous manifestations of varicella-zoster virus reactivation involving the geniculate ganglion. Key educational points include the recognition of dermatomal vesicular rashes and their association with otalgia and potential facial nerve palsy.
A multi-panel clinical figure documenting a case of Ramsay Hunt syndrome (herpes zoster oticus). Panel A: A clinical photograph of the right auricle showing erythematous, crusting vesicular eruptions and pustules concentrated within the concha and extending to the antihelix, characteristic of a varicella-zoster virus infection in the remission phase. Panel C: An axial T1-weighted Gadolinium-enhanced MRI of the brain at the level of the internal auditory canals. A yellow arrow highlights pathological contrast enhancement in the right external auditory canal and potentially the facial nerve (CN VII) or vestibulocochlear nerve (CN VIII) complex, indicating inflammatory changes. Panel D: A frontal clinical photograph of the patient demonstrating right-sided peripheral facial nerve palsy. Key visible signs include loss of forehead wrinkling, flattening of the nasolabial fold, and a drooping of the right oral commissure (angle of the mouth). Together, these images illustrate the triad of auricular vesicles, otic involvement, and ipsilateral facial paralysis.
This composite clinical photograph displays the hallmark signs of Ramsay Hunt syndrome (herpes zoster oticus). Image A (left) shows the right ear auricle with inflammatory swelling and a characteristic vesicular eruption within the concha and external auditory meatus. Multiple clustered vesicles and hemorrhagic crusting are visible, extending down the preauricular area and neck. Image B (right) demonstrates an associated ipsilateral peripheral facial nerve palsy (CN VII). Key findings include significant facial asymmetry with right-sided drooping, loss of nasolabial fold depth, and deviation of the mouth to the contralateral (left) side. The patient displays Bell's phenomenon on the right, where the globe rotates upward during an attempt to close the eye, leaving only the white sclera visible due to incomplete eyelid closure (lagophthalmos). These images illustrate the triad of otalgia, auricular vesicles, and facial paralysis typical of varicella-zoster virus reactivation in the geniculate ganglion, targeting medical students and clinicians in neurology, otolaryngology, and dermatology.
Imaging of Facial Nerve Injury
Part 1: Anatomy of the Facial Nerve - The Imaging Roadmap
| Segment | Course | Length | Key Landmarks |
|---|---|---|---|
| 1. Cisternal (CPA) | Exits pons → crosses CPA cistern | ~15-17 mm | Runs with CN VIII toward IAC |
| 2. Meatal (intracanalicular, IAC) | Traverses IAC | ~8-10 mm | Fundal canalicular portion at IAC apex |
| 3. Labyrinthine | IAC fundus → geniculate ganglion | ~3-4 mm (shortest, narrowest) | No blood supply from local vessels - most vulnerable to ischemia and edema |
| 4. Geniculate ganglion | First genu (90° turn) | - | Greater petrosal nerve branches here |
| 5. Tympanic (horizontal) | Geniculate → second genu | ~10-12 mm | Runs along medial wall of middle ear |
| 6. Mastoid (vertical) | Second genu → stylomastoid foramen | ~13-15 mm | Stapedius and chorda tympani branch here |
| 7. Extratemporal | Stylomastoid foramen → parotid → face | Variable | Pes anserinus (parotid gland) - upper and lower divisions |
Part 2: Imaging Modalities
CT (High-Resolution CT / HRCT)
- Slice thickness: 0.5-0.6 mm (multidetector CT; reformatted in axial, coronal, and Pöschl planes)
- Best for:
- Visualizing the bony Fallopian (facial nerve) canal - its walls, dimensions, and dehiscence
- Temporal bone fractures and their relation to the nerve canal
- Erosion of canal walls (cholesteatoma, CSOM)
- Calcification (hemangioma honeycomb matrix)
- Mass effect / expansion of the bony canal (schwannoma)
- Limitation: Cannot show the nerve itself; cannot differentiate soft tissue pathologies within the canal (granulation tissue vs tumor vs nerve)
MRI (with Gadolinium)
- Protocol: Pre- and post-contrast T1 sequences through the temporal bone; T2 sequences of the whole brain; parotid-specific fat suppression imaging
- Best for:
- The only modality demonstrating the facial nerve comprehensively from pons to parotid gland
- Inflammatory changes (Bell's palsy, Ramsay Hunt)
- Neoplastic lesions (schwannoma, hemangioma, perineural spread)
- Soft tissue extension (parotid malignancy)
- Cisternal and intracanalicular segments not visible on CT
- Limitation: Cannot reliably image the intraparotid facial nerve; MRI cannot differentiate increased nerve signal from surrounding inflamed granulation tissue in otitis media
Scott-Brown's: "MRI is the only modality that demonstrates the facial nerve comprehensively from the pons to the parotid gland; with gadolinium enhancement it is capable of showing inflammatory changes."
Scott-Brown's: "Both imaging techniques are complementary and may be used in combination."
Part 3: Imaging by Cause of Facial Nerve Injury
1. Bell's Palsy (Idiopathic Facial Nerve Palsy)
- Presentation is atypical
- Alternative diagnosis suspected
- Surgical decompression is planned
- Recovery is incomplete at 6 months
- Clinical condition is worsening (scan earlier)
- Enhancement may be normal in the first 10 days - a normal scan does not exclude Bell's palsy early on
- Pattern: Asymmetric, diffuse, intense, linear enhancement (not nodular - nodularity should prompt concern for neoplasm)
- Involves the entire intratemporal segment, most distinct at the fundus of the IAC and labyrinthine segment
- Enhancement may persist for months after full clinical recovery - not a sign of ongoing disease
- The degree of enhancement has no significant prognostic value
Scott-Brown's: "Post-gadolinium enhancement is characteristically asymmetric, diffuse, intense and linear (not nodular). It involves the entire intratemporal segment of the facial nerve, but is more distinct in the fundus of the IAM and labyrinthine segments and may well persist for several months after full recovery."
2. Ramsay Hunt Syndrome (Herpes Zoster Oticus)
- Enhancement pattern similar to Bell's palsy but can be more intense and more extensive, involving not just CN VII but also CN VIII (cochlear and vestibular nerves)
- Enhancement of the external auditory canal may be seen (corresponding to the herpetic vesicles)
- Enhancement of the geniculate ganglion is a characteristic finding
- Enhancement may extend into the labyrinth on FLAIR (labyrinthitis)
- Often indistinguishable from Bell's palsy on MRI alone - clinical vesicles are the differentiator
3. Temporal Bone Fracture (Traumatic Facial Nerve Injury)
| Type | CT Appearance | Facial Nerve Risk | Injury Site |
|---|---|---|---|
| Longitudinal (~80%) | Fracture line parallel to long axis of petrous pyramid | 20% risk of facial palsy | Distal to geniculate ganglion / first genu |
| Transverse (~20%) | Fracture line perpendicular to long axis | 50% risk of facial palsy (higher severity) | Proximal to geniculate ganglion |
| Mixed | Complex, multi-directional lines | Variable | Variable |
- Fracture line through or adjacent to the Fallopian canal
- Hemotympanum (opacification of middle ear with blood - hyperdense on CT)
- Otic capsule violation (transverse fractures) → higher risk of sensorineural hearing loss and facial palsy
- Canal dehiscence or displacement
- Ossicular chain disruption (longitudinal fractures)
Scott-Brown's: "Facial nerve injury is usually situated just distal to the geniculate ganglion and the first genu in longitudinal fractures and just proximal to the geniculate ganglion in transverse fractures."
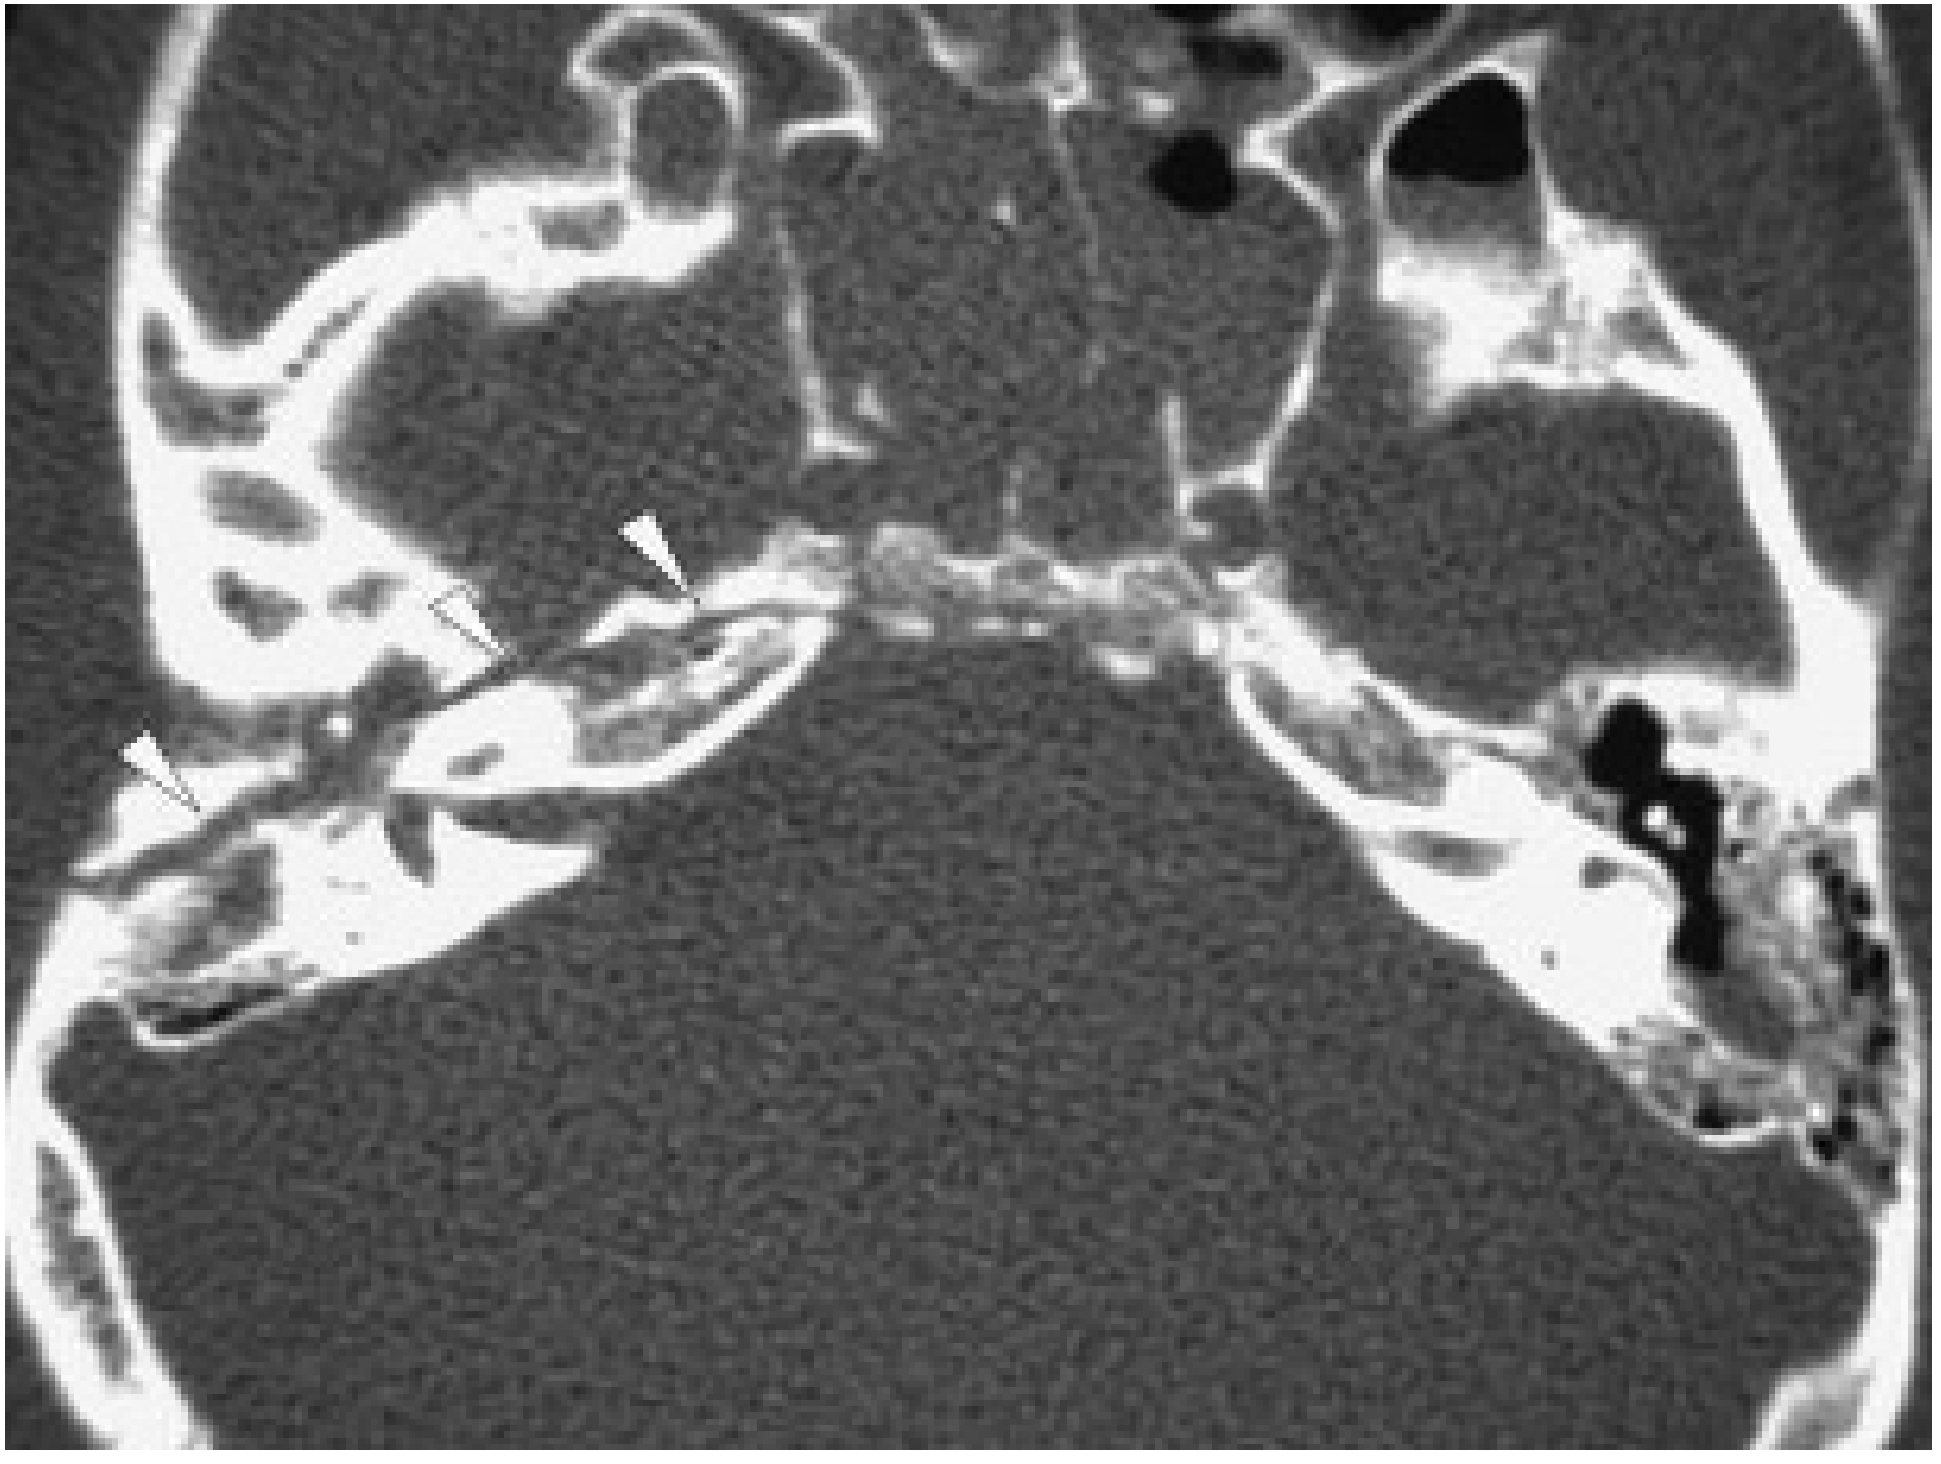
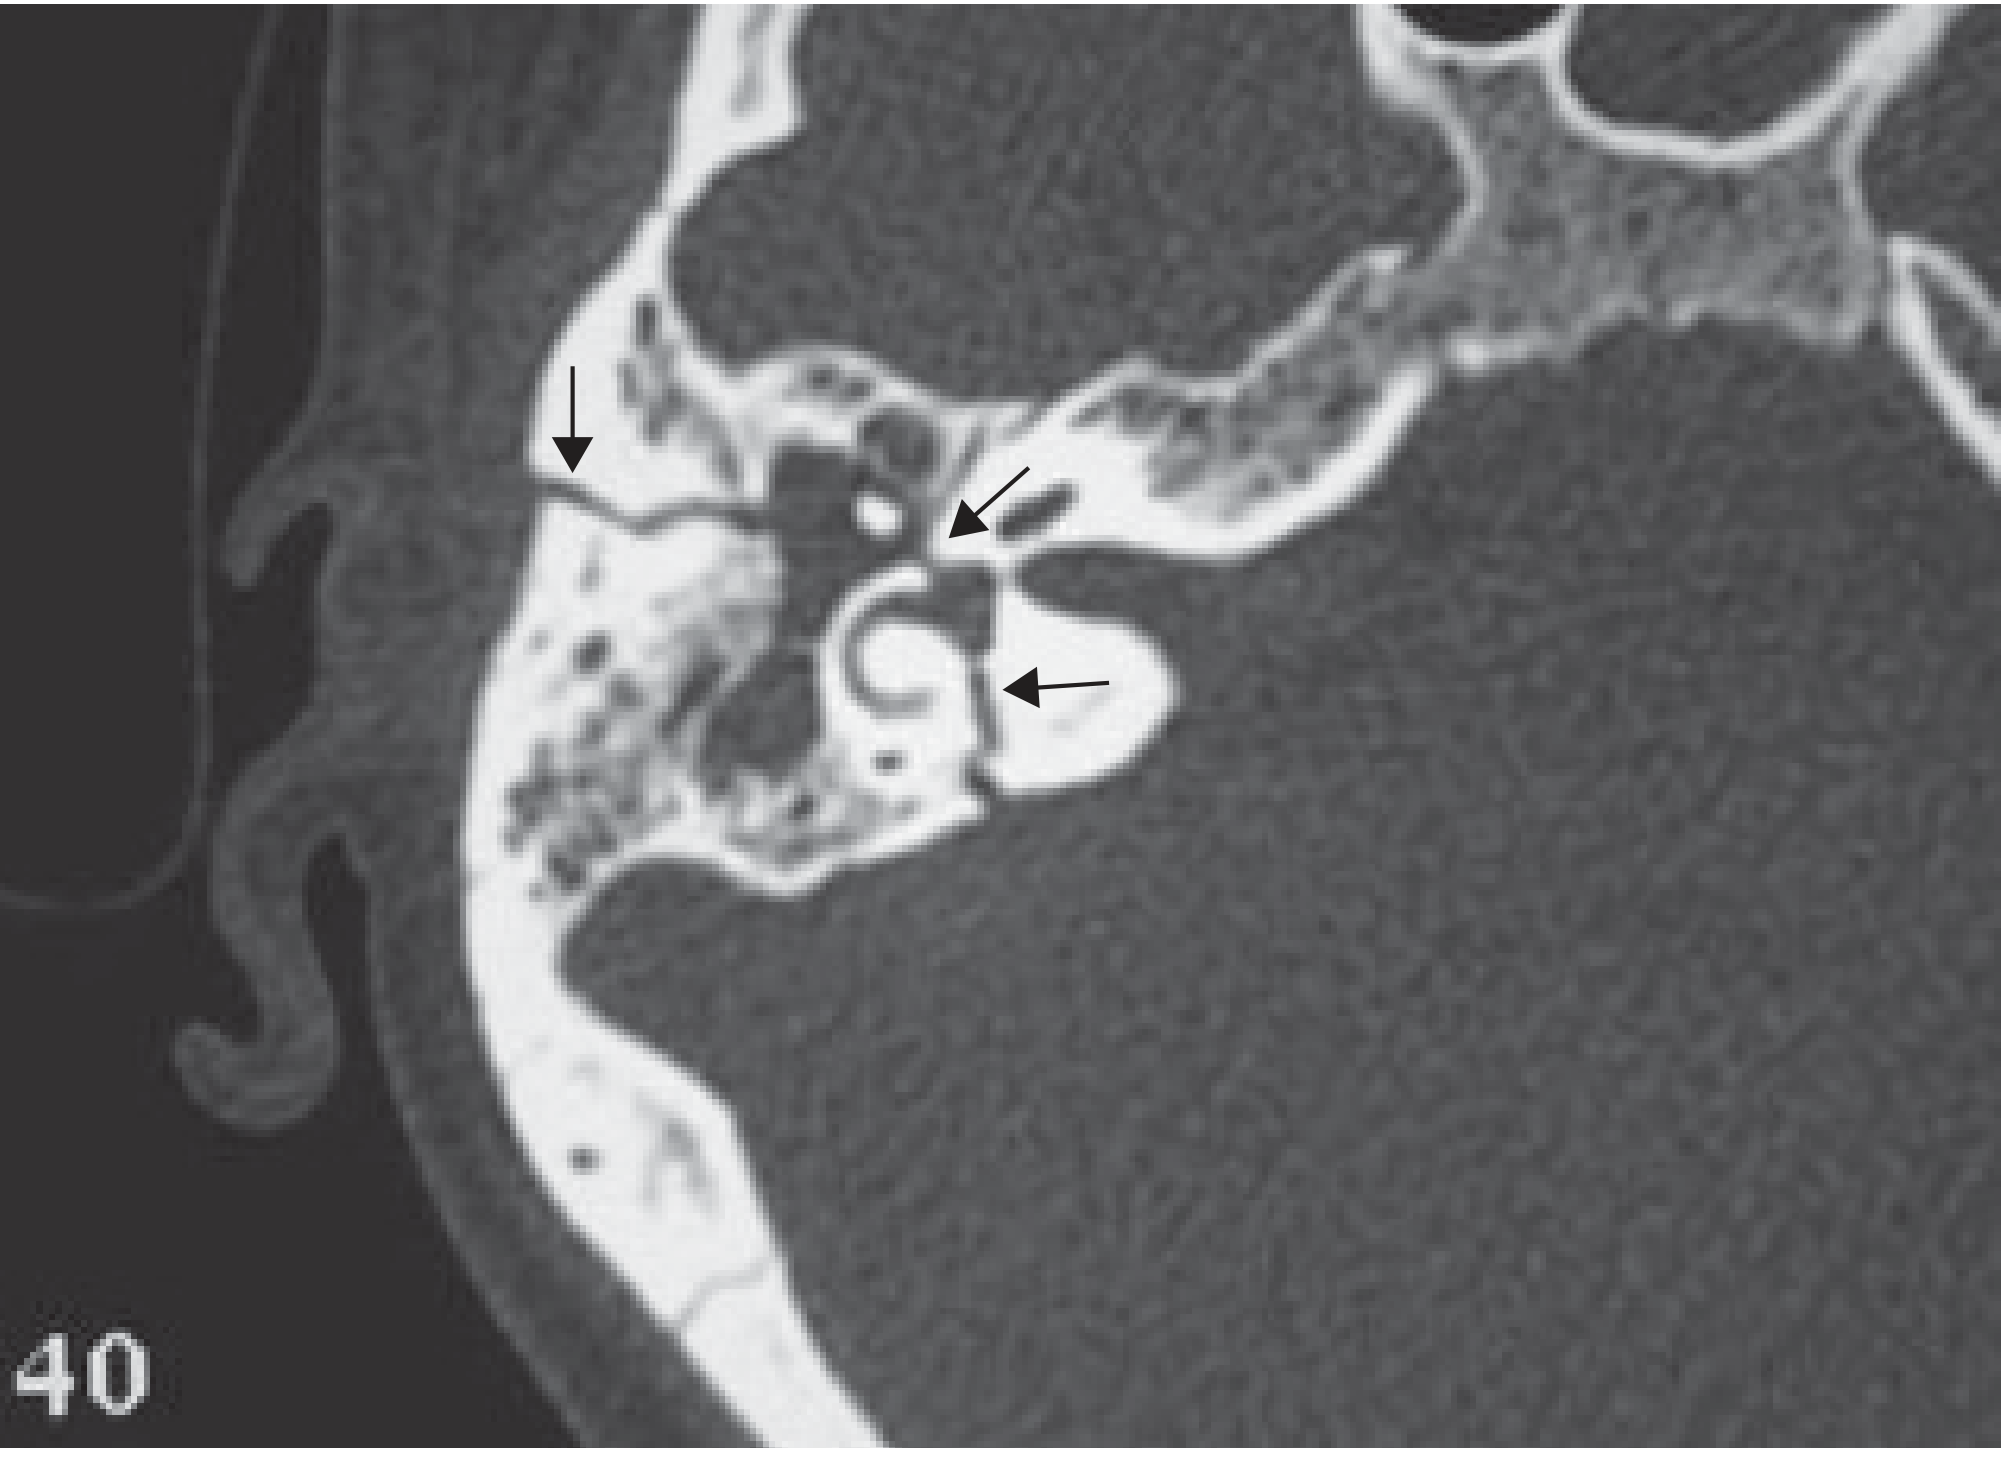

4. Facial Nerve in Otitis Media (Acute and Chronic)
- CT is the investigation of choice - delineates erosion of the Fallopian canal by cholesteatoma
- CT shows the site of canal erosion and extent of disease
- MRI limitation: Cannot reliably differentiate increased signal of the facial nerve from surrounding inflamed granulation tissue or cholesteatoma matrix
- Non-echo planar DWI (non-EPI DWI) on MRI is useful for cholesteatoma detection (restricted diffusion in keratin matrix)
Scott-Brown's: "A CT scan of the temporal bone can delineate the site of erosion of the Fallopian canal, but MRI cannot differentiate between the increased signal of the facial nerve from that of surrounding inflamed granulation tissue."
5. Facial Nerve Tumors
A. Facial Nerve Schwannoma
- CT: Expanded, scalloped Fallopian canal (smooth bony remodeling, not aggressive erosion)
- MRI: Strong, homogeneous gadolinium enhancement on T1; can be tubular ("sausage-link" appearance) along the nerve course
- When large enough to fill the IAC, cannot be distinguished from vestibular schwannoma on imaging alone - the key differential point is the nerve of origin (which may require surgical exploration)
- CT shows expanded bony canal, MRI shows the enhancing soft tissue mass
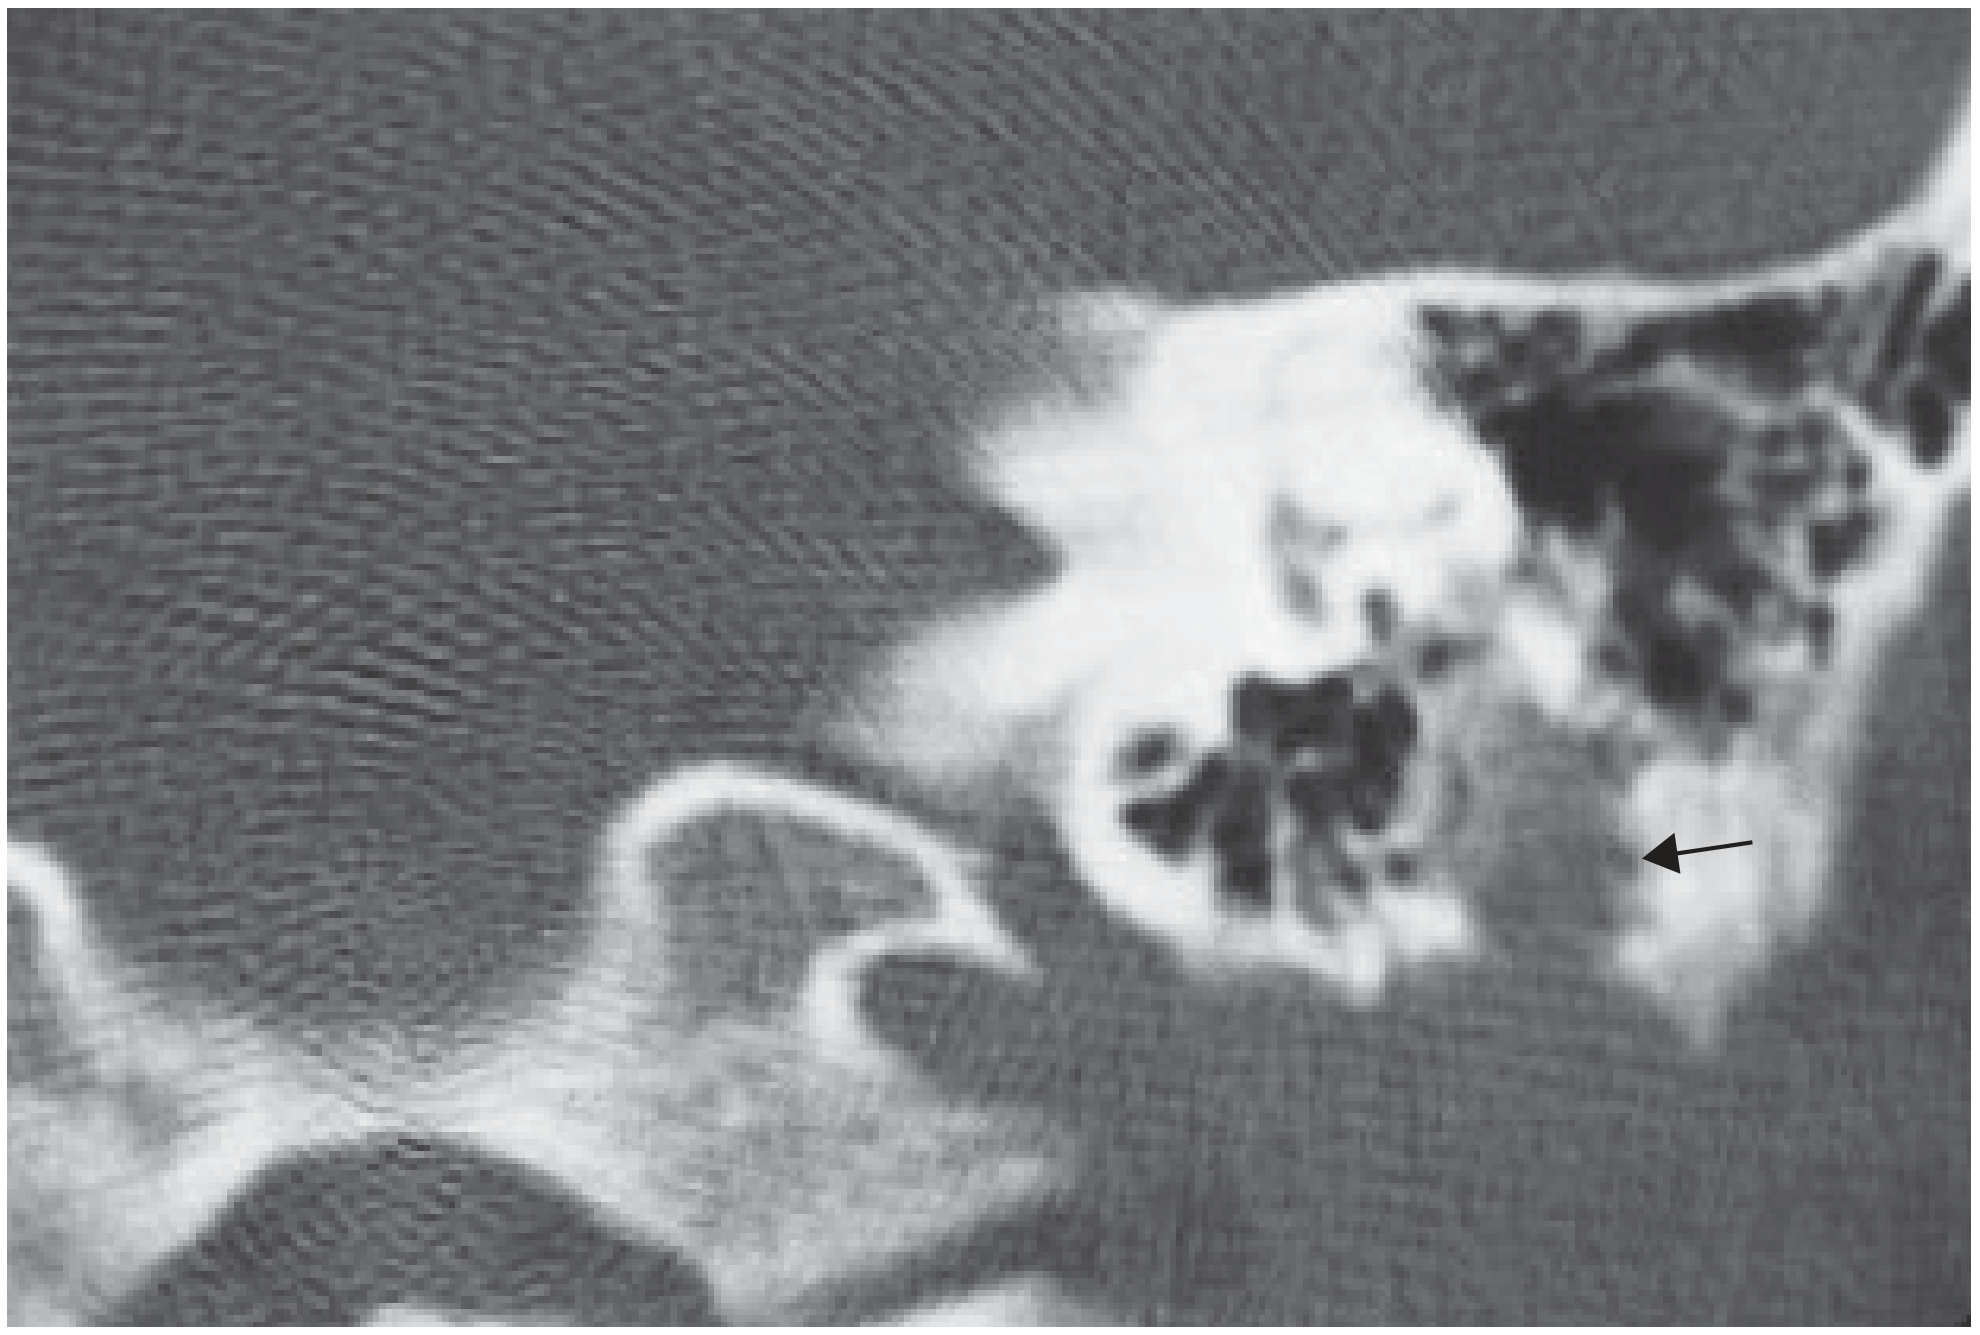
B. Facial Nerve Hemangioma
- CT: Characteristic honeycomb matrix (irregular intratumoral calcification/bony spiculation) - virtually pathognomonic
- MRI: Intense enhancement on T1+Gad; most commonly at the geniculate ganglion
- CT honeycomb pattern distinguishes hemangioma from schwannoma
C. Meningioma (CPA / IAC)
- May involve the facial nerve in the CPA or IAC
- CT: May show hyperostosis or calcification
- MRI: Homogeneous enhancement; dural tail if present
6. Perineural Tumor Spread (Malignant Parotid Tumors)
- Soft-tissue intensity enhancing mass extending from the parotid gland through an enlarged stylomastoid foramen
- Progressive involvement of mastoid → tympanic → labyrinthine segments
- Replacement of the normal T1-hyperintense fat at the stylomastoid foramen by hypointense signal (fat obliteration sign - compare sides)
- Thickening, nodularity, and asymmetric enhancement of the facial nerve segments
- Widening and enhancement of the stylomastoid foramen on post-contrast fat-suppressed T1
Scott-Brown's: "Malignant parotid tumours may track up the facial nerve and a soft-tissue intensity enhancing mass is usually observed extending from the gland through an enlarged stylomastoid foramen to involve the mastoid segment of the facial nerve. There is usually replacement of the hyperintense fat tissue by a hypointense signal in T1-weighted images."
7. Diffusion Tensor Imaging (DTI) / Tractography
- DTI can map the course of the displaced, thinned facial nerve relative to the schwannoma before surgery
- Helps surgeons anticipate the nerve location (anterior, superior, inferior displacement) intraoperatively
- Complements intraoperative EMG monitoring
- Still largely a research/specialized center tool; not yet standard practice
Scott-Brown's: "Skull base surgeons are well aware of the challenges of functional preservation of the facial nerve at the time of tumour dissection in vestibular schwannoma surgery... DTI tractography [helps locate] the often-thinned nerve traversing [the tumor]."
Summary: Imaging Strategy by Clinical Scenario
| Clinical Scenario | Modality of Choice | Key Findings |
|---|---|---|
| Bell's palsy (typical) | MRI not routinely needed; consider if atypical/no recovery | Linear diffuse T1+Gad enhancement, labyrinthine/fundus most affected |
| Ramsay Hunt | MRI (gadolinium) | Similar to Bell's; EAC/labyrinth enhancement; clinical diagnosis |
| Temporal bone trauma | HRCT | Fracture line through Fallopian canal; longitudinal vs transverse |
| Cholesteatoma/CSOM | HRCT (primary); Non-EPI DWI MRI | Fallopian canal erosion; sclerosis; mass effect |
| Facial nerve schwannoma | MRI (+ CT) | Canal expansion on CT; intense tubular enhancement on MRI |
| Facial nerve hemangioma | CT (honeycomb) + MRI (intense enhancement) | CT honeycomb at geniculate; T1+Gad intense |
| Perineural tumor spread | MRI fat-suppressed T1+Gad | Fat obliteration at stylomastoid foramen; progressive nerve enhancement |
| CPA/IAC neoplasm | MRI (gadolinium) | Enhancing mass; "ice cream cone" if vestibular schwannoma |
| Surgical planning (VS) | DTI tractography | Nerve displacement mapping |
Enhancement Pattern: Benign vs Malignant
| Feature | Bell's Palsy / Inflammatory | Neoplastic |
|---|---|---|
| Pattern | Linear, diffuse | Nodular, focal |
| Extent | Whole intratemporal segment | May be focal or discontinuous |
| Enhancement intensity | Variable but usually not nodular | May be intense and focal |
| Canal expansion | Normal | Expanded (schwannoma) |
| Fat at stylomastoid foramen | Preserved | Obliterated (perineural spread) |
| Mass effect | Absent | Present |
| T2 | Normal or subtle edema | Mass may be iso/hyperintense |
Anatomy of cerebellopontine angle and sol in cp angle radiology
cerebellopontine angle anatomy CPA cistern MRI CT lesions vestibular schwannoma meningioma epidermoid
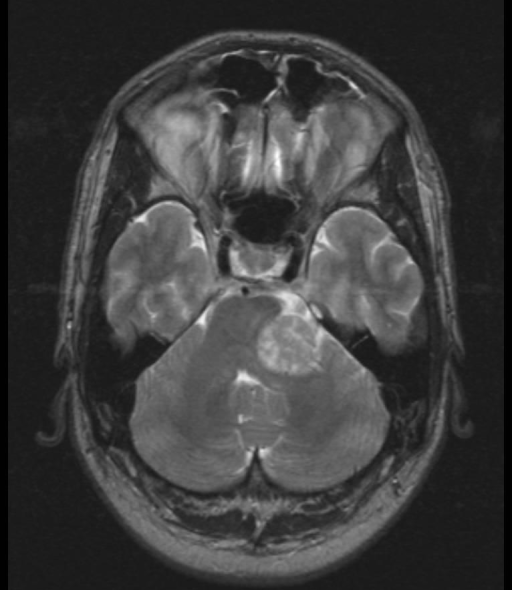
**Imaging Modality:** Magnetic Resonance Imaging (MRI), Axial T2-weighted sequence. **Anatomical Region:** Posterior cranial fossa at the level of the cerebellopontine angle (CPA). **Observed Pathology:** A large, well-circumscribed, heterogeneous hyperintense mass is situated in the left cerebellopontine angle. This finding is highly characteristic of a Vestibular Schwannoma (Acoustic Neuroma). **Characteristic Visual Features:** * **Location:** The lesion originates within the left CPA and extends medially. * **Mass Effect:** Significant compression and rightward displacement of the brainstem (pons) and the fourth ventricle. There is associated effacement of the surrounding cisterns. * **Signal Intensity:** Heterogeneous high T2 signal, suggesting solid components with potential areas of cystic degeneration or proteinaceous fluid. * **Morphology:** The "ice cream cone" appearance is suggested where the mass occupies the CPA cistern and extends toward the internal auditory canal. **Key Diagnostic Features:** The presence of a localized CPA mass causing mass effect on the brainstem in the context of vestibular schwannoma pathology. Differential diagnoses for this location typically include meningioma or epidermoid cyst, though the T2 signal and morphology here strongly favor schwannoma.
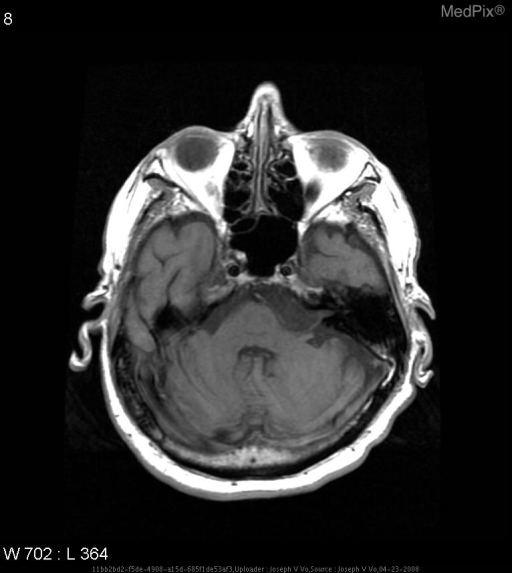
**Imaging Modality:** Magnetic Resonance Imaging (MRI), T1-weighted axial sequence. **Anatomical Region:** Posterior cranial fossa at the level of the cerebellopontine angle (CPA) and pons. **Observed Pathology:** There is an irregular, lobulated, extra-axial mass located within the left cerebellopontine angle cistern. The lesion appears hypointense relative to the brain parenchyma, roughly isointense to cerebrospinal fluid (CSF) on this T1-weighted image. **Characteristic Visual Features:** The mass demonstrates a "creeping" or "encapsulating" growth pattern, filling the subarachnoid space and mildly displacing the adjacent pons and cerebellum without significant parenchymal edema. It extends into the ambient cistern and follows the contours of the brainstem. The margins are well-defined but scalloped. There is no evidence of gross midline shift or obstructive hydrocephalus at this level. **Key Diagnostic Features:** The CSF-like signal intensity and the tendency to envelop rather than displace local neurovascular structures are classic radiologic features suggestive of an intracranial epidermoid cyst. Differential considerations for CPA masses include arachnoid cyst, vestibular schwannoma, and meningioma.
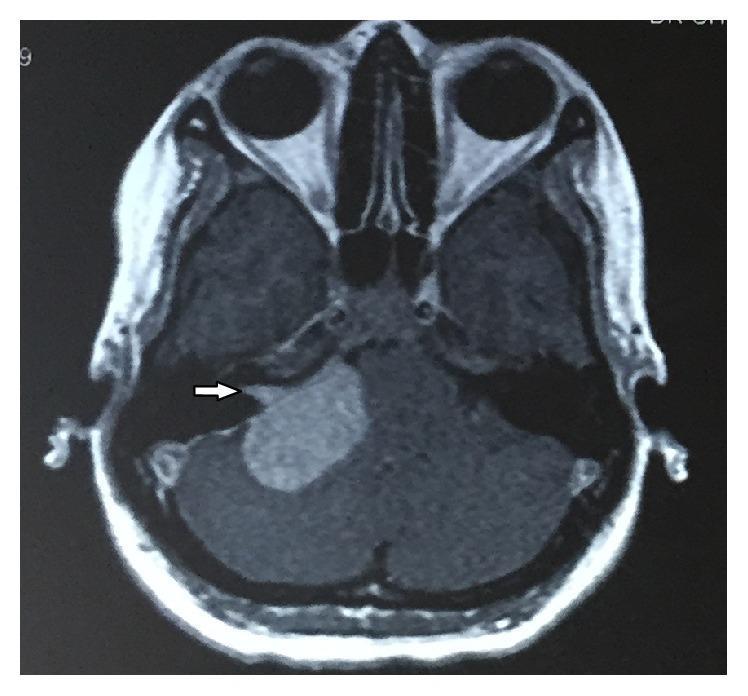
This axial magnetic resonance image (MRI) of the head shows a large, well-defined, ovoid extra-axial mass within the right cerebellopontine angle (CPA) cistern. The lesion demonstrates relatively homogeneous signal intensity and exerts a mild mass effect on the adjacent brainstem and cerebellum. A characteristic visual feature is the extension of the tumor into the right internal auditory canal (IAC), creating a triangular or 'shark fin' appearance (indicated by a white arrow). This morphology and location are classic diagnostic markers for a vestibular schwannoma (acoustic neuroma). The image illustrates the common radiological finding of subtle widening of the internal auditory canal caused by tumor progression. This material is suitable for medical education in neuroradiology, neurosurgery, and otolaryngology to identify CPA lesions and their involvement with cranial nerve pathways.
**Imaging Modality:** Magnetic Resonance Imaging (MRI), T1-weighted axial sequence. **Anatomical Region:** Posterior cranial fossa at the level of the cerebellopontine angle (CPA) and petrous temporal bone. **Observed Pathology:** There is a well-circumscribed, extra-axial soft tissue mass located in the right cerebellopontine angle cistern. The lesion appears mildly hypointense to isointense relative to the adjacent brain parenchyma on this T1-weighted image. **Characteristic Visual Features:** - **Location:** The mass is situated laterally to the pons and anterior to the cerebellum. - **Morphology:** The lesion demonstrates a broad-based attachment along the posterior aspect of the petrous temporal bone, suggestive of a dural-based origin. - **Mass Effect:** There is subtle compression and medial displacement of the adjacent brainstem (pons) and right cerebellar hemisphere. - **Key Differentiating Feature:** Notably, the mass is extrinsic to the internal auditory canal (IAC), which appears relatively spared compared to the typical presentation of a vestibular schwannoma. **Clinical Context/Differential:** The imaging features are highly suggestive of a CPA meningioma. Differential considerations for masses in this location include acoustic schwannoma, epidermoid cyst, and trigeminal neuroma.
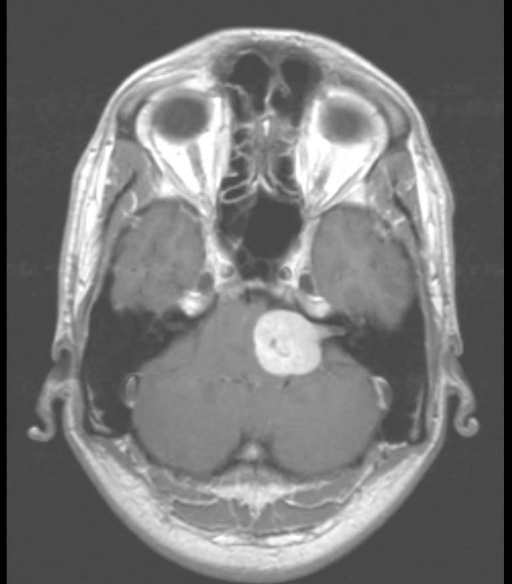
**Imaging Modality:** Contrast-enhanced T1-weighted Magnetic Resonance Imaging (MRI), axial section. **Anatomical Region:** Posterior cranial fossa, specifically the left cerebellopontine angle (CPA). **Observed Pathology:** A well-circumscribed, intensely enhancing extra-axial mass is located in the left cerebellopontine angle cistern. The lesion demonstrates a characteristic "ice cream cone" appearance, with a large globular component in the CPA cistern and a narrow extension (tail) into the widened internal auditory canal (IAC). **Characteristic Visual Features:** * **Enhancement:** Homogeneous and bright post-gadolinium enhancement. * **Mass Effect:** Significant compression and rightward displacement of the pons and medulla oblongata. * **Differentiating Features:** The extension into the internal auditory canal is highly suggestive of a vestibular schwannoma (acoustic neuroma) rather than a meningioma, which typically lacks IAC widening and often presents with a dural tail. **Clinical Context/Significance:** This imaging finding represents a large vestibular schwannoma (Stage III/IV based on size and brainstem compression). Such lesions are the most common primary tumors of the CPA and are critical to identify in patients presenting with unilateral sensorineural hearing loss, tinnitus, or vestibular dysfunction.
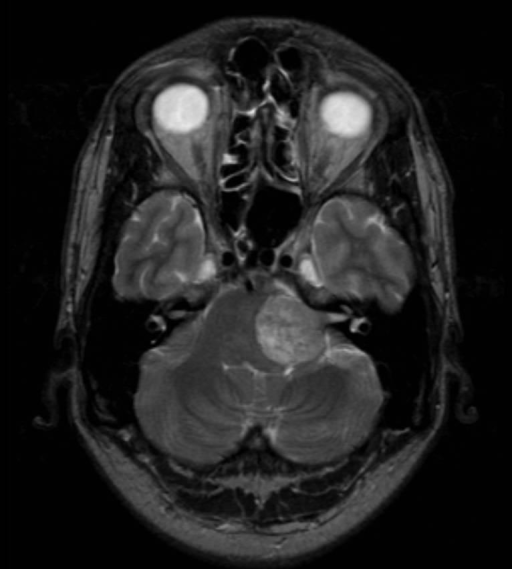
**Imaging Modality:** Magnetic Resonance Imaging (MRI), axial T2-weighted sequence. **Anatomical Region:** Posterior cranial fossa at the level of the cerebellopontine angle (CPA) and internal auditory canal (IAC). **Observed Pathology:** Large, well-circumscribed solid mass located in the left cerebellopontine angle, consistent with a vestibular schwannoma (acoustic neuroma). **Characteristic Visual Features:** - **Signal Intensity:** The lesion exhibits hyperintense T2 signal relative to the brain parenchyma, with a slightly heterogeneous internal texture. - **Morphology:** The mass demonstrates the classic "ice-cream cone" appearance, with a medial globular component occupying the CPA cistern and a lateral "stalk" extending into and widening the left internal auditory canal. - **Mass Effect:** There is significant compression and rightward displacement of the adjacent pons and medulla oblongata. The fourth ventricle is partially effaced. **Key Diagnostic Features:** The location at the CPA, involvement of the IAC, and characteristic morphology are primary diagnostic indicators distinguishing this from other CPA entities like meningioma or epidermoid cysts. The lesion is unilateral, which is typical for sporadic vestibular schwannoma.
vestibular schwannoma ice cream cone IAC widening MRI gadolinium T1 T2
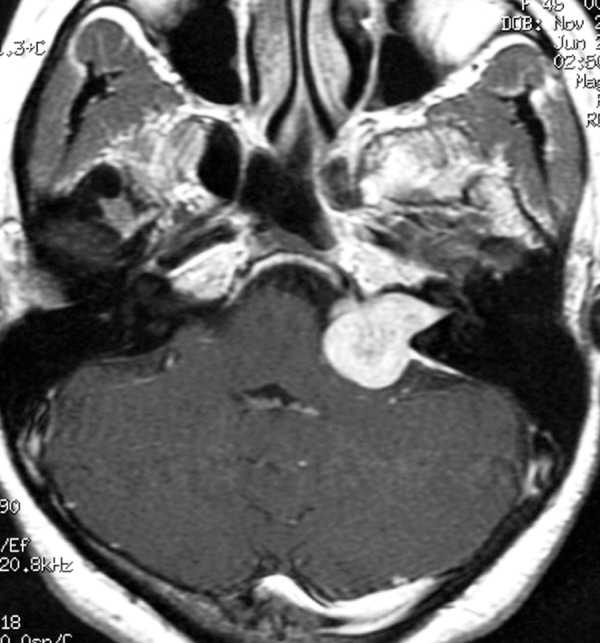
**Imaging Modality:** Axial T1-weighted Magnetic Resonance Imaging (MRI) with gadolinium contrast. **Anatomical Region:** Posterior cranial fossa, specifically the left cerebellopontine angle (CPA) and internal auditory canal (IAC). **Observed Pathology:** A well-circumscribed, intensely enhancing extra-axial mass is located in the left cerebellopontine angle. The lesion demonstrates the classic "ice cream cone" configuration, characterized by a bulbous component within the CPA cistern and a narrow extension into the widened left internal auditory canal. **Characteristic Visual Features:** * **Enhancement:** Homogeneous and robust post-contrast enhancement. * **Morphology:** Expansile growth causing focal widening of the porus acusticus. * **Mass Effect:** Minimal displacement of the adjacent brainstem and cerebellum without significant perilesional edema or ventricular effacement. * **Symmetry:** The contralateral (right) internal auditory canal and CPA cistern appear normal. **Diagnostic Entity:** The findings are highly characteristic of a vestibular schwannoma (acoustic neuroma). **Clinical Significance:** This image illustrates a typical presentation of a Grade II or III vestibular schwannoma (Koos classification) based on its extension into the cistern and widening of the bony canal.
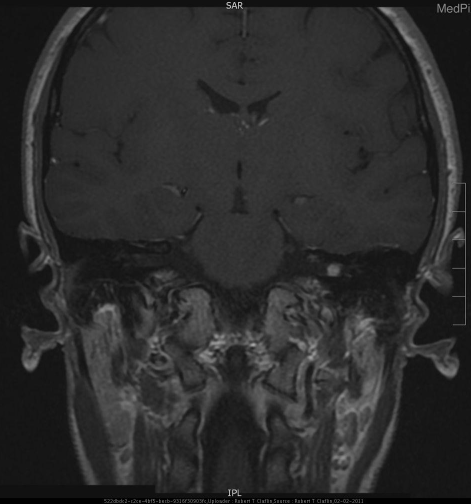
**Imaging Modality:** Gadolinium-enhanced Magnetic Resonance Imaging (MRI), coronal view. **Anatomical Region:** Posterior cranial fossa, specifically the cerebellopontine angle (CPA). **Observed Pathology:** A small, well-circumscribed, intensely enhancing focal mass is located in the left cerebellopontine angle. Based on clinical context, this lesion is a vestibular schwannoma. Notably, the mass appears primarily localized to the CPA without the classic "ice cream cone" appearance involving significant widening or extension into the internal auditory canal (IAC). **Characteristic Visual Features:** * **Signal Intensity:** High signal intensity (bright enhancement) following intravenous gadolinium administration on T1-weighted imaging. * **Morphology:** Ovoid, solid mass with sharply defined borders. * **Location:** Left-sided extrinsic intracranial mass adjacent to the brainstem and cerebellum. **Key Diagnostic Features:** The primary differential diagnosis for this CPA lesion includes meningioma and vestibular schwannoma. While the lack of IAC extension is atypical for a schwannoma, the intense, uniform enhancement is characteristic. This image demonstrates the utility of thin-slice enhanced MRI in detecting small, extra-axial neoplasms of the vestibulocochlear nerve (CN VIII).
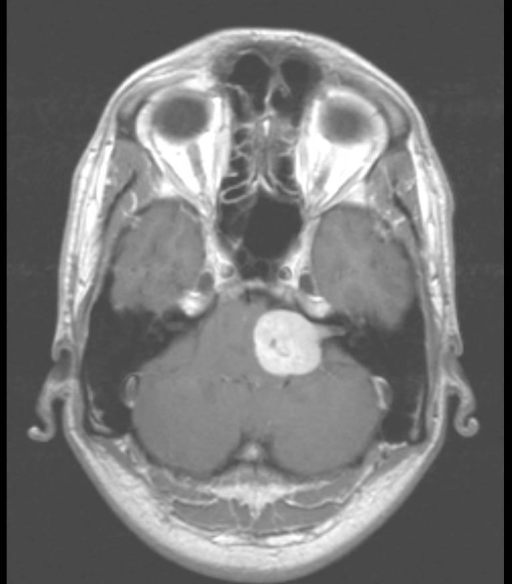
**Modality:** Magnetic Resonance Imaging (MRI), Axial T1-weighted post-contrast sequence. **Anatomic Region:** Posterior cranial fossa at the level of the cerebellopontine angle (CPA) and internal auditory canal (IAC). **Observation:** There is a well-circumscribed, intensely enhancing extra-axial mass located in the left cerebellopontine angle. The lesion exhibits the classic "ice-cream cone" configuration, characterized by a bulbous component within the CPA cistern and a narrow extension (the "cone") into the widened left internal auditory canal. **Characteristic Features:** The mass shows heterogeneous enhancement with internal areas of lower signal intensity, suggestive of cystic degeneration. It exerts significant mass effect on the adjacent brainstem (pons) and the left cerebellar hemisphere, with mild compression of the fourth ventricle. **Diagnostic Entity:** The findings are highly characteristic of a Vestibular Schwannoma (Acoustic Neuroma). **Key Differentiating Features:** The presence of the intracanalicular component and the widening of the IAC help distinguish this from other CPA masses, such as meningiomas (which typically lack IAC extension and may demonstrate a "dural tail") or epidermoid cysts (which generally do not enhance with gadolinium).
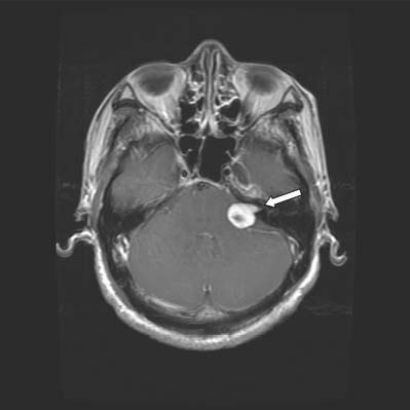
**Imaging Modality:** Gadolinium-enhanced axial T1-weighted Magnetic Resonance Imaging (MRI) of the head. **Anatomical Region:** Posterior fossa, specifically the left cerebellopontine angle (CPA) and internal auditory canal (IAC). **Observed Pathology:** A well-circumscribed, intensely enhancing soft tissue mass is situated in the left cerebellopontine angle. The lesion demonstrates a characteristic "ice cream cone" appearance, with a larger globular cisternal component and a narrower intracanalicular portion extending into the left internal auditory canal. **Characteristic Visual Features:** * **Enhancement:** Homogeneous and robust uptake of contrast agent. * **Morphology:** Ovoid mass with smooth margins. * **Mass Effect:** Minimal displacement of the adjacent pons and cerebellum without significant effacement of the fourth ventricle. * **Location:** Centered at the porus acusticus. **Diagnostic Features:** The location and morphology are highly characteristic of a vestibular schwannoma (acoustic neuroma). Key differentiating features include the widening of the internal auditory canal and the acute angles formed between the lesion and the petrous temporal bone, distinguishing it from a CPA meningioma.
CPA epidermoid cyst DWI restricted diffusion MRI CSF signal creeping
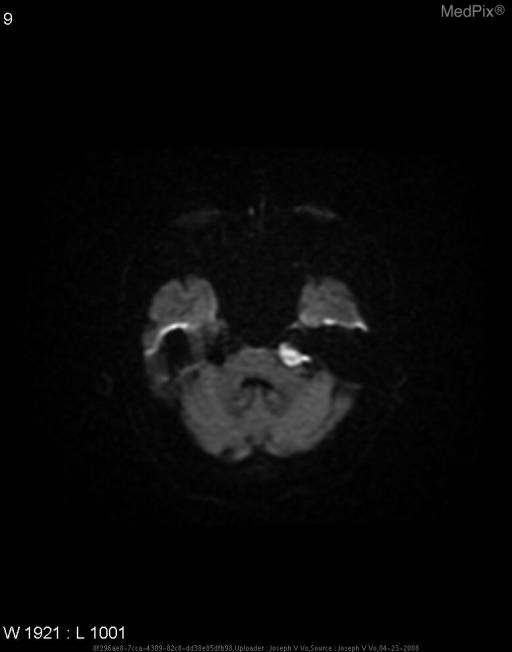
**Imaging Modality:** Diffusion-Weighted Imaging (DWI) Magnetic Resonance Imaging (MRI). **Anatomical Region:** Axial section of the brain at the level of the posterior fossa and skull base, specifically involving the left cerebellopontine angle (CPA) cistern. **Observed Pathology:** There is a well-circumscribed, focal area of marked hyperintensity (restricted diffusion) located in the left cerebellopontine angle. The lesion appears to exert mild mass effect on the adjacent brainstem and cerebellum. **Characteristic Visual Features:** The lesion demonstrates high signal intensity on this DWI sequence, which is a hallmark finding for an intracranial epidermoid cyst. The morphology is somewhat lobulated, consistent with the characteristic "creeping" growth pattern of epidermoids that fill and expand subarachnoid cisterns. **Key Diagnostic Features:** The intense hyperintensity on DWI is the primary differentiating feature used to distinguish an epidermoid tumor from an arachnoid cyst (which typically follows CSF signal and shows no diffusion restriction). This finding, combined with the anatomical location in the CPA cistern, is highly suggestive of an intracranial epidermoid tumor.
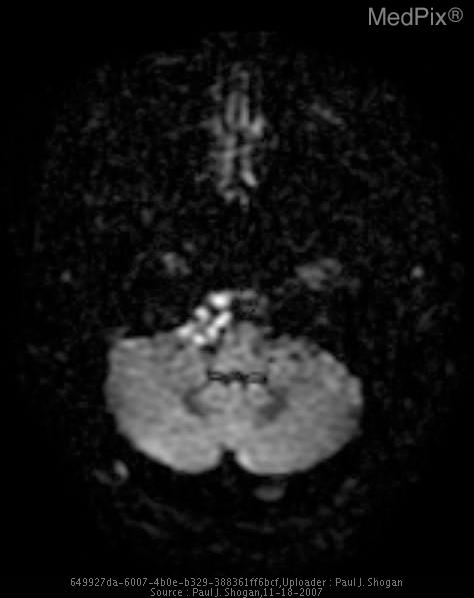
**Imaging Modality:** Magnetic Resonance Imaging (MRI), Diffusion-Weighted Imaging (DWI) sequence. **Anatomical Region:** Axial section of the posterior fossa, specifically the right cerebellopontine angle (CPA). **Observed Pathology:** Intracranial epidermoid cyst (tumor). **Characteristic Visual Features:** The image demonstrates a lobulated, extra-axial mass located within the right cerebellopontine angle cistern. A hallmark diagnostic feature is the intense hyperintensity (bright signal) on this diffusion-weighted sequence, indicating marked restricted diffusion. The lesion exhibits an irregular, "creeping" growth pattern, conforming to and filling the subarachnoid spaces and cisterns while exerting mild mass effect on the adjacent brainstem and cerebellar hemisphere. **Key Diagnostic Cues:** The strong hyperintensity on DWI is the definitive radiologic feature that distinguishes an epidermoid cyst from an arachnoid cyst, which would otherwise follow cerebrospinal fluid (CSF) signal and appear dark (hypointense) on DWI. This finding is characteristic of the solid, keratinous debris found within epidermoid tumors.
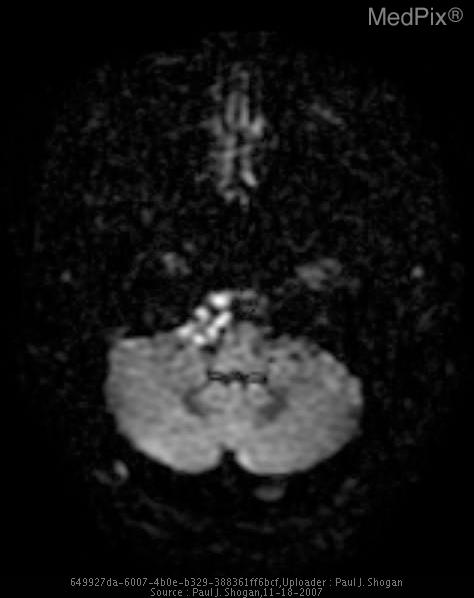
**Imaging Modality:** Magnetic Resonance Imaging (MRI), Axial Diffusion-Weighted Imaging (DWI). **Anatomical Region:** Posterior fossa, specifically the prepontine and cerebellopontine angle (CPA) cisterns. **Observed Pathology:** There is a lobulated, extra-axial mass located within the prepontine cistern, extending into the right CPA. The lesion demonstrates marked hyperintensity on DWI, indicating restricted diffusion. **Characteristic Visual Features:** The mass is characterized by high signal intensity on this DWI sequence, which is a hallmark of intracranial epidermoid cysts. It exhibits a "creeping" or "cauliflower-like" morphology, filling the basal cisterns and exerting mild mass effect on the adjacent brainstem (pons and medulla). Foci of lower signal within the hyperintense mass likely represent trapped cerebrospinal fluid (CSF) channels. **Key Diagnostic Features:** The combination of an extra-axial location in the CPA/prepontine cistern and restricted diffusion (high DWI signal) is highly specific for an intracranial epidermoid cyst, differentiating it from an arachnoid cyst, which would follow CSF signal and suppress on DWI.
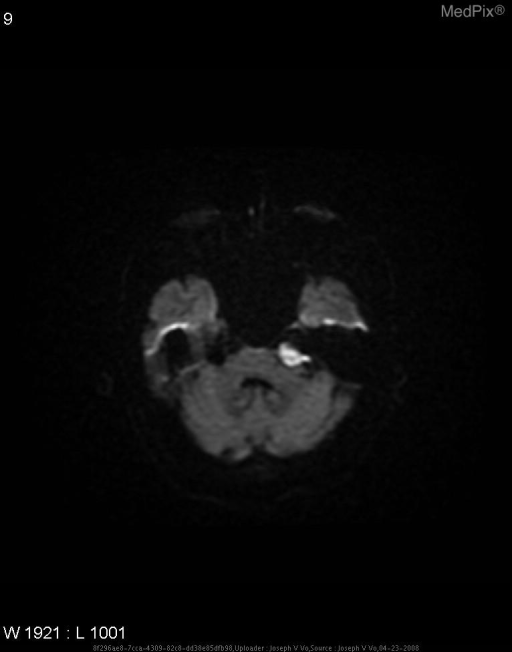
**Imaging Modality:** Magnetic Resonance Imaging (MRI), Diffusion-Weighted Imaging (DWI) sequence. **Anatomical Region:** Axial section of the posterior fossa at the level of the pons and cerebellopontine angle (CPA). **Observed Pathology:** There is a well-circumscribed, focal area of markedly increased signal intensity (hyperintensity) located in the left cerebellopontine angle cistern. **Characteristic Visual Features:** - **DWI Hyperintensity:** The lesion demonstrates prominent restricted diffusion, which is a pathognomonic feature of intracranial epidermoid cysts. - **Morphology:** The mass appears lobulated and conforms to the irregular contours of the subarachnoid space, a characteristic "creeping" growth pattern typical of these lesions. - **Location:** It is situated adjacent to the left aspect of the pons and the internal auditory canal. **Key Diagnostic Features:** The intense hyperintensity on DWI is the primary differentiating feature used to distinguish an epidermoid cyst from an arachnoid cyst, the latter of which would show signal suppression (hypointensity) similar to cerebrospinal fluid (CSF) on this sequence. **Clinical Context:** This finding is consistent with a CPA epidermoid cyst, often presenting clinically with cranial nerve deficits such as trigeminal neuralgia or vestibulocochlear symptoms.
CPA meningioma dural tail broad base petrous bone CT hyperostosis MRI homogeneous enhancement
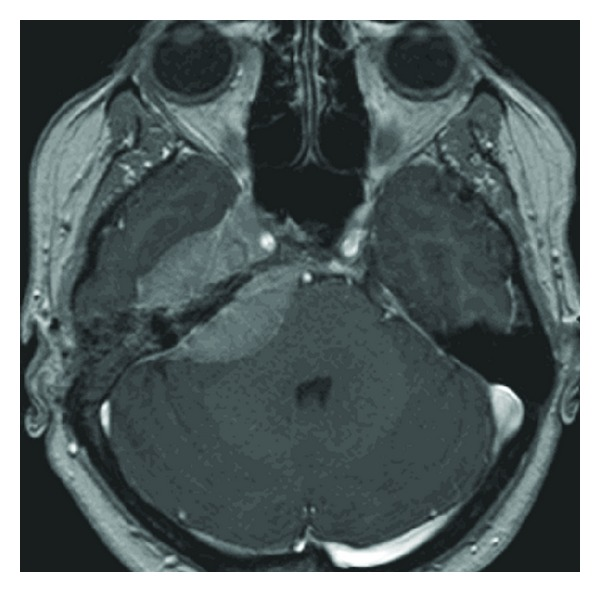
**Imaging Modality:** Axial T1-weighted magnetic resonance imaging (MRI) with gadolinium contrast enhancement. **Anatomical Region:** Cranial base, specifically the right petrous apex and cerebellopontine angle (CPA). **Observed Pathology:** A well-circumscribed, intensely enhancing extra-axial mass lesion consistent with a meningioma. The lesion is centered on the right petrous apex, extending into both the anterior and posterior compartments of the petrous temporal bone. **Characteristic Visual Features:** * **Enhancement Pattern:** Homogeneous and robust uptake of gadolinium contrast. * **Morphology:** Dural-based, biconvex mass exerting a mass effect on the adjacent brainstem and cerebellum. * **Dural Tail Sign:** Linear enhancement of the tapering dura mater extending from the edges of the lesion, a classic radiographic indicator of meningioma. * **Topography:** Involvement of the right petrous apex with proximity to the internal auditory canal and Meckel’s cave. **Key Diagnostic Features:** The extra-axial location, broad dural base, intense homogeneous enhancement, and presence of a dural tail are primary features distinguishing this lesion from other CPA masses such as vestibular schwannomas.
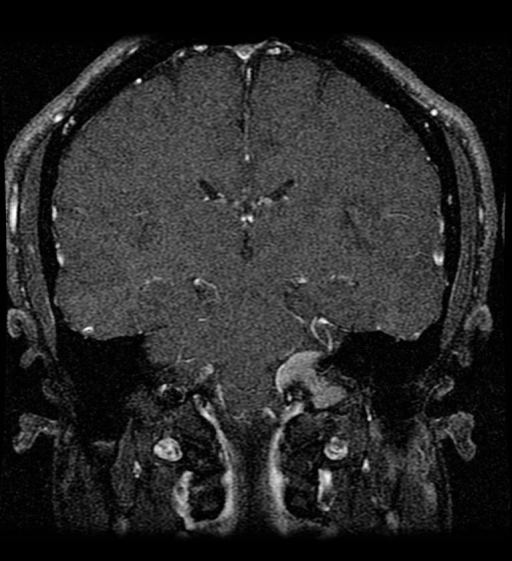
**Imaging Modality:** Contrast-enhanced Magnetic Resonance Imaging (MRI), coronal section. **Anatomical Region:** Skull base at the level of the left jugular foramen and cerebellopontine angle (CPA). **Observed Pathology:** A well-circumscribed, intensely and homogeneously enhancing extra-axial mass is located at the left jugular foramen. The lesion extends superiorly toward the CPA and demonstrates a broad-based attachment along the petrous temporal bone. **Characteristic Visual Features:** * **Enhancement Pattern:** The mass shows uniform contrast uptake, characteristic of a highly vascular or cellular meningioma or schwannoma. * **Morphology:** The lesion appears solid with smooth margins, exerting mild mass effect on the adjacent brainstem and cerebellum. * **Dural Tail Sign:** There is a linear thickening of the adjacent dura mater (dural tail), which is highly suggestive of a meningioma. * **Absence of Flow Voids:** The internal signal is relatively homogeneous without the prominent "salt and pepper" flow voids typically seen in paragangliomas (glomus jugulare). **Key Diagnostic Features:** The location within the jugular foramen and the presence of a dural tail are primary cues for differentiating between a jugular foramen meningioma and a schwannoma or paraganglioma.
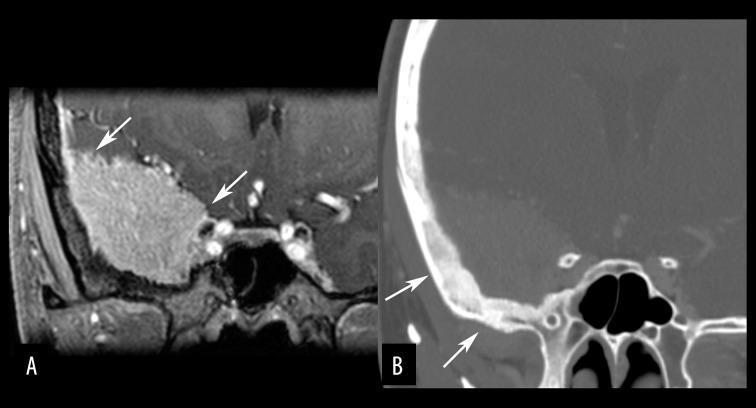
This composite diagnostic image features a skull base meningioma in a 29-year-old female, illustrating key radiological signs on MRI and CT. Image A is a coronal-reformatted, post-contrast T1-weighted MRI showing a well-circumscribed, homogeneously enhancing mass at the skull base with a broad dural attachment. Arrows highlight a 'dural tail sign,' characterized by linear thickening and enhancement of the adjacent dura mater. Image B is a coronal-reformatted bone window CT at the same level, which demonstrates significant hyperostosis (reactive bone thickening and increased density) of the underlying sphenoid bone (arrows) directly adjacent to the tumor. These findings are classic for meningioma, where dural tail enhancement suggests neoplastic or reactive dural infiltration, and hyperostosis reflects a common osteoblastic response of the skull base to the tumor. This visual set is essential for teaching the combined soft tissue and osseous manifestations of extra-axial skull base neoplasms in neuroradiology.
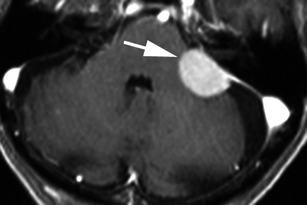
**Imaging Modality:** Post-contrast axial T1-weighted MRI of the brain. **Anatomical Region:** Posterior fossa, specifically the left cerebellopontine angle (CPA). **Observed Pathology:** A well-circumscribed, extra-axial mass is located within the left CPA (indicated by arrow). The lesion demonstrates intense, homogeneous contrast enhancement and exhibits a broad-based dural attachment along the petrous temporal bone. A linear enhancement extending from the lesion's margins, consistent with a "dural tail sign," is visible. **Characteristic Visual Features:** The mass is located adjacent to the left internal acoustic meatus (IAM) but remains extracanalicular, showing no significant extension into the meatus. It exerts mild mass effect on the adjacent cerebellar hemisphere and brainstem without visible edema on this sequence. **Diagnostic Differentiating Features:** The broad dural base, homogeneous enhancement, dural tail sign, and lack of internal acoustic canal widening are radiologic features characteristic of a grade I meningioma, distinguishing it from an acoustic neuroma (vestibular schwannoma).
CPA arachnoid cyst CSF signal no enhancement T2 bright DWI dark differential epidermoid
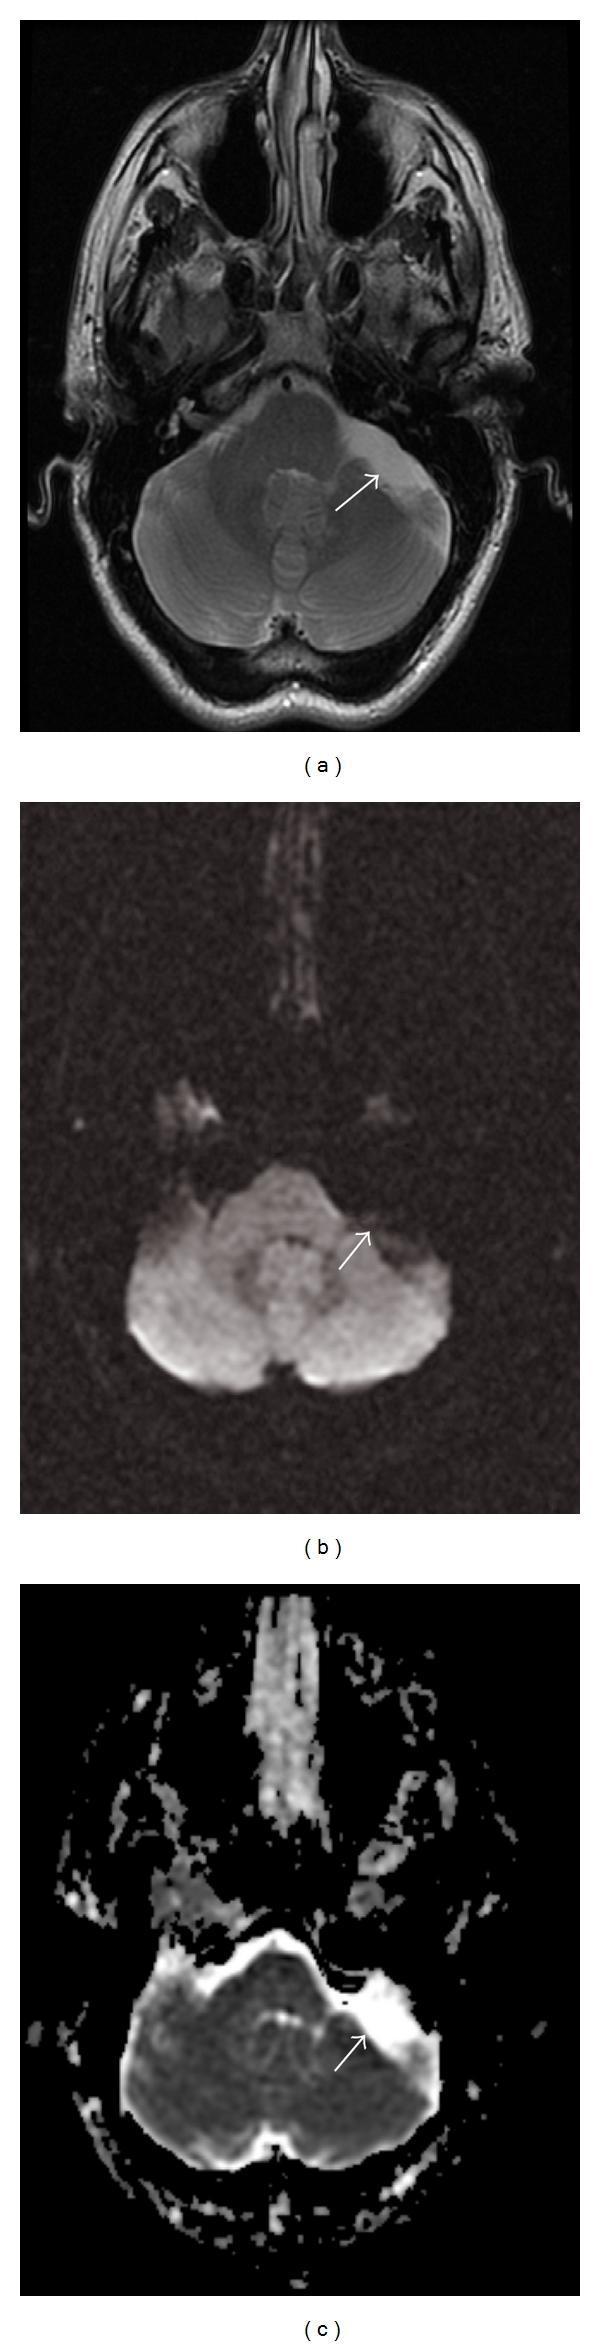
Diagnostic neuroradiology images showing a cerebellopontine angle (CPA) arachnoid cyst in a 32-year-old male. The composite includes three axial MRI sequences at the level of the posterior fossa: (a) Fast Spin Echo T2-weighted image demonstrating a well-circumscribed, homogeneous hyperintense mass in the left CPA, exerting mild mass effect on the adjacent cerebellum and pons; (b) Diffusion-Weighted Imaging (DWI) sequence showing the lesion as hypointense (dark); and (c) Apparent Diffusion Coefficient (ADC) map showing the lesion as hyperintense (bright). This combination of signal characteristics—specifically high T2 signal with facilitated diffusion (dark DWI, bright ADC)—is diagnostic of an arachnoid cyst containing cerebrospinal fluid and effectively differentiates it from an epidermoid cyst, which would typically demonstrate restricted diffusion (bright DWI, dark ADC). Key anatomical landmarks include the internal auditory canal, brainstem, and cerebellar hemispheres. The images serve as an educational example of using diffusion sequences to distinguish cystic intracranial lesions.
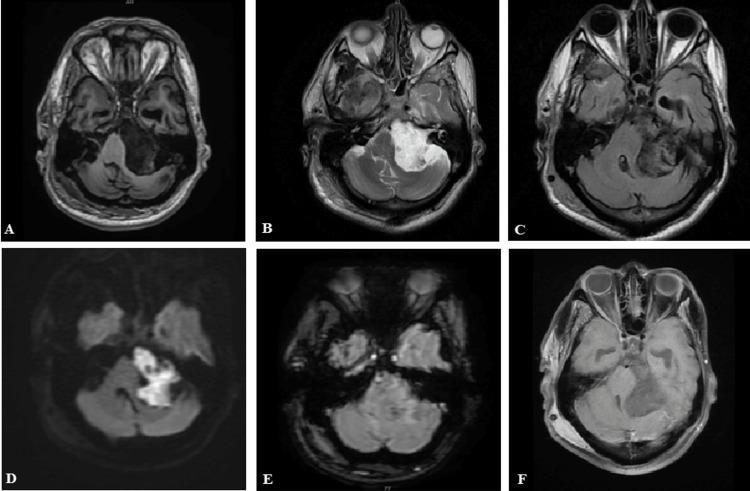
This composite diagnostic image consists of six axial brain MRI sequences (A-F) demonstrating a large, irregular lesion in the left cerebellopontine angle (CPA). (A) T1-weighted image shows the mass as hypointense to brain parenchyma. (B) T2-weighted image reveals marked hyperintensity, similar to cerebrospinal fluid (CSF). (C) FLAIR sequence shows heterogeneous signal with partial suppression, a key feature distinguishing it from an arachnoid cyst. (D) Diffusion-Weighted Imaging (DWI) demonstrates bright signal indicating marked diffusion restriction, characteristic of an epidermoid cyst. (E) Susceptibility-Weighted Imaging (SWAN) shows no evidence of internal hemorrhage or calcification (no blooming). (F) Post-contrast T1-weighted image shows a lack of internal or peripheral enhancement, confirming its non-vascular, cystic nature. The lesion exerts a significant mass effect, displacing the pons and adjacent cerebellar hemisphere. This panel is an educational example used to differentiate CPA masses based on signal characteristics, specifically identifying the hallmark diffusion restriction of intracranial epidermoid cysts.
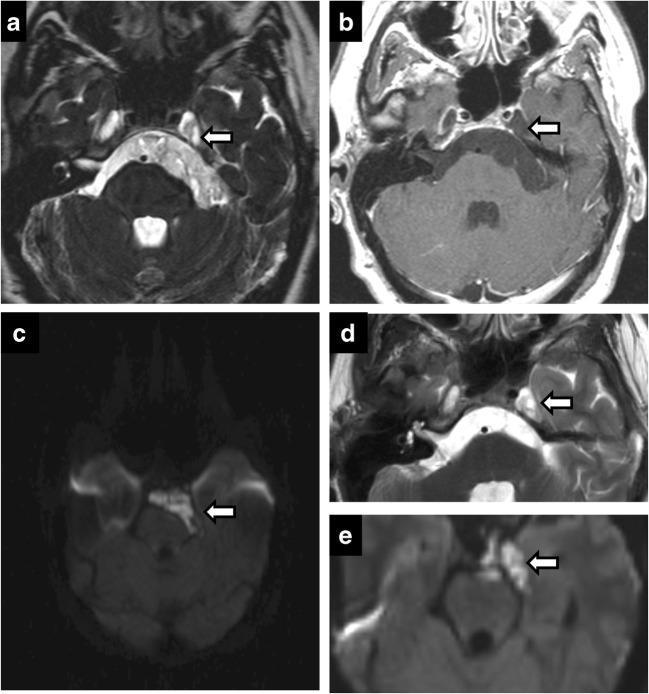
This set of neuroradiological images demonstrates an intracranial epidermoid cyst involving the left cerebellopontine angle (CPA) and Meckel's cave. (a) Axial T2-weighted MRI shows a lobulated, hyperintense mass expanding the left Meckel's cave and CPA cistern, causing mild mass effect on the adjacent brainstem. (b) Post-contrast T1-weighted MRI reveals the characteristic lack of internal enhancement within the lesion. (c) Diffusion-weighted imaging (DWI) displays classic restricted diffusion, appearing as a bright signal, which is diagnostic for an epidermoid cyst and distinguishes it from an arachnoid cyst. (d, e) Postoperative axial T2 and contrast-enhanced images show residual high-signal tissue within the left Meckel's cave, with focal areas of mild enhancement potentially representing postoperative inflammatory changes or small amounts of residual cyst wall. The case illustrates the typical multi-cisternal growth pattern and signal characteristics of epidermoid tumors in the skull base.
paraganglioma glomus jugulare jugular foramen salt pepper MRI CT
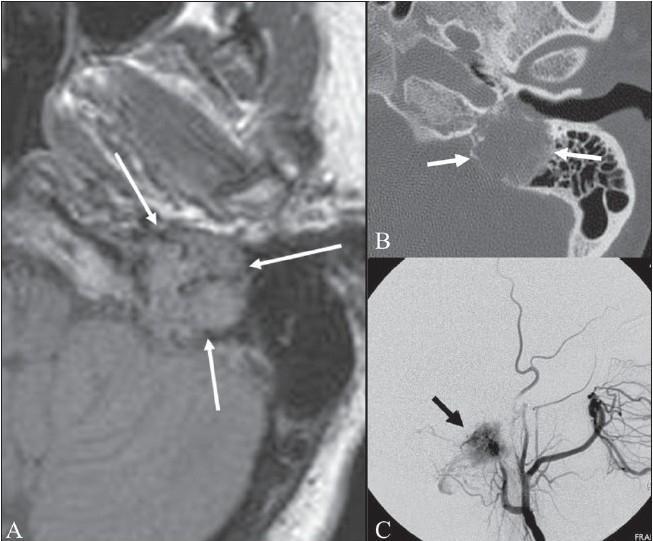
This composite educational image illustrates the diagnostic features of a glomus jugulare tumor (paraganglioma) within the left temporal bone through three imaging modalities. Panel A is an axial FLAIR MRI showing a heterogeneous, predominantly isointense mass in the jugular foramen region. It exhibits the characteristic 'salt and pepper sign,' where 'pepper' represents hypointense signal voids from high-flow vessels and 'salt' represents hyperintense foci from slow-flow vessels or hemorrhage. Panel B is an axial CT scan of the same anatomical region, highlighting the aggressive nature of the lesion through visible destruction and permeative erosion of the surrounding petrous temporal bone and jugular fossa (indicated by arrows). Panel C is an external carotid angiogram demonstrating a dense 'tumor blush' (black arrow), confirming the hypervascular nature of the mass. These multimodal findings—hypervascularity on angiography, bony destruction on CT, and the salt-and-pepper appearance on MRI—are pathognomonic for a glomus jugulare tumor. This content is intended for advanced medical education in neuroradiology and otolaryngology.
![Multi-modal diagnostic imaging set comprising [18F]FDOPA PET/CT and MRI, illustrating a complex glomus jugulare tumor (paraganglioma). Panels (a-d) present PET Maximum Intensity Projection (MIP) and fused PET/CT axial views showing intense radiotracer uptake centered at the left jugular foramen. The uptake demonstrates extensive cranial spread to the ipsilateral sigmoid sinus, condylar emissary vein, and along the cerebellar tentorium. Caudal extension is visible along the carotid sheath to the hyoid level. Panels (e-h) feature MRI axial T1 fat-suppressed contrast-enhanced and T2-weighted sequences. These images reveal a large, enhancing mass causing local bony destruction at the jugular foramen. Key diagnostic features include a 'salt-and-pepper' appearance on T1 and multiple internal flow voids on T2 images, characteristic of highly vascular paragangliomas. The MRI confirms encasement of the internal carotid artery and extension into the sigmoid sinus and condylar canal. This case illustrates the utility of functional molecular imaging paired with high-resolution structural MRI for the pre-operative mapping of neuroendocrine skull base tumors.](https://cdn.orris.care/cdss_images/pmc_clinical_VQA_f6376d55a895726def07995d54396ff9cda297cb85daef61ead75a01a959ab13.jpg)
Multi-modal diagnostic imaging set comprising [18F]FDOPA PET/CT and MRI, illustrating a complex glomus jugulare tumor (paraganglioma). Panels (a-d) present PET Maximum Intensity Projection (MIP) and fused PET/CT axial views showing intense radiotracer uptake centered at the left jugular foramen. The uptake demonstrates extensive cranial spread to the ipsilateral sigmoid sinus, condylar emissary vein, and along the cerebellar tentorium. Caudal extension is visible along the carotid sheath to the hyoid level. Panels (e-h) feature MRI axial T1 fat-suppressed contrast-enhanced and T2-weighted sequences. These images reveal a large, enhancing mass causing local bony destruction at the jugular foramen. Key diagnostic features include a 'salt-and-pepper' appearance on T1 and multiple internal flow voids on T2 images, characteristic of highly vascular paragangliomas. The MRI confirms encasement of the internal carotid artery and extension into the sigmoid sinus and condylar canal. This case illustrates the utility of functional molecular imaging paired with high-resolution structural MRI for the pre-operative mapping of neuroendocrine skull base tumors.
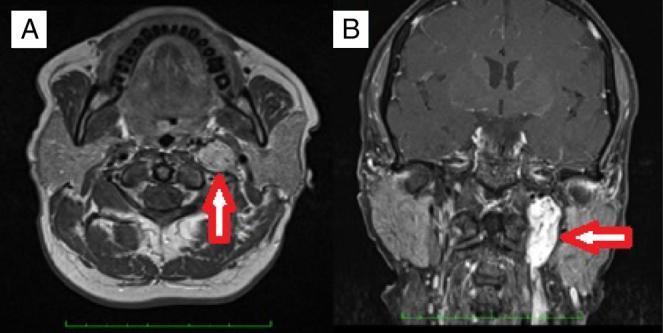
Diagnostic Magnetic Resonance Imaging (MRI) showing a left-sided Tympanojugular Paraganglioma (TJP) in two planes. Image A presents an axial T1-weighted sequence demonstrating a well-defined lesion in the region of the jugular foramen. The lesion exhibits a characteristic 'salt and pepper' appearance, consisting of punctate areas of high signal intensity (likely representing slow-flowing blood or hemorrhage) and low signal voids (representing high-flow vascular channels). Image B presents a coronal T1-weighted fat-suppressed sequence where the lesion demonstrates marked hyperintensity and vertical extension. The mass occupies the skull base and extends inferiorly into the upper neck along the carotid sheath. Key features include its hypervascular nature and its specific location at the jugular bulb, indicative of a glomus jugulare tumor. This imaging is representative of Head and Neck Radiology and Neuroradiology, targeting advanced medical education regarding temporal bone pathologies and neurovascular tumors.
Anatomy of the Cerebellopontine Angle and Lesions: Radiology
Part 1: Anatomy of the CPA Cistern
| Boundary | Structure |
|---|---|
| Medial | Lateral pons and medulla oblongata |
| Posterolateral | Anterior surface of the cerebellum |
| Lateral/floor | Posterior face of the petrous temporal bone |
| Superior | Tentorium cerebelli |
| Inferior | Jugular foramen region |
Key Structures Passing Through / Within the CPA Cistern
- CN V (trigeminal nerve) - enters Meckel's cave superiorly
- CN VI (abducens) - courses medially
- CN VII + VIII (facial and vestibulocochlear nerves) - traverse the CPA → enter the Internal Auditory Canal (IAC)
- CN IX, X, XI - exit inferiorly via the jugular foramen
- AICA (anterior inferior cerebellar artery) - loops into the IAC
- Labyrinthine artery - branch of AICA supplying the inner ear
The Internal Auditory Canal (IAC)
- A bony canal within the petrous temporal bone
- Length: ~8-10 mm; divided by the crista falciformis (horizontal) and Bill's bar (vertical) at the fundus
- Contains:
- CN VII (facial nerve) - anterosuperior compartment
- Superior vestibular nerve - posterosuperior compartment
- Cochlear nerve - anteroinferior compartment
- Inferior vestibular nerve - posteroinferior compartment
Part 2: Imaging Modalities for the CPA
MRI - Gold Standard
- Fine-cut contrast-enhanced MRI is the modality of choice
- Pre- and post-gadolinium T1, T2, FLAIR, DWI sequences
- High-resolution T2 (FIESTA/CISS/DRIVE) - depicts cranial nerves within CSF as dark against bright CSF - excellent for intracanalicular lesions without contrast
- Detects lesions as small as 2-3 mm
- Can evaluate all CPA structures from brainstem to parotid
CT / HRCT
- Role: Second-line; assesses bony changes (IAC widening, hyperostosis, erosion, calcification)
- CT cisternography: Injection of 3 mL air into subarachnoid space via LP - outlines medial contour of masses; detects tumors as small as 2-3 mm; used when MRI is unavailable or contraindicated
- IAC size assessment: Enlargement ≥2 mm or posterior canal wall shortening ≥3 mm vs contralateral side = significant
Cummings: "Both noncontrasted and contrasted CT scans have a poor sensitivity to identify lesions within the IAC and CPA... Fine cut MRI with contrast enhancement is the imaging modality of choice."
Part 3: Frequency Distribution of CPA Lesions
| Lesion | Frequency |
|---|---|
| Vestibular schwannoma (acoustic neuroma) | ~75% |
| Meningioma | ~10% |
| Epidermoid cyst | ~5% |
| Arachnoid cyst | ~1-2% |
| Facial nerve schwannoma | ~1% |
| Lipoma | Rare |
| Paraganglioma (glomus jugulare) | Rare |
| Metastasis | Rare |
| Other (AICA aneurysm, exophytic brainstem glioma, trigeminal schwannoma, dermoid, neurosarcoidosis) | Rare |
Part 4: Imaging Characteristics Table (Cummings Table 135.3)
| Lesion | T1WI | T2WI | T1WI + Contrast | Key Differentiating Feature |
|---|---|---|---|---|
| Vestibular schwannoma | Isointense to brain | Slightly hyperintense | Enhances | IAC widening; "ice cream cone"; acute angle with petrous bone |
| Meningioma | Isointense to brain | Hypo/hyperintense | Enhances | T2 signal varies with calcium; broad dural base; dural tail; obtuse angle; no IAC |
| Epidermoid cyst | Hypointense | Hyperintense | No enhancement | DWI bright (restricted diffusion); incomplete FLAIR suppression; "creeping" |
| Arachnoid cyst | Hypointense | Hyperintense | No enhancement | DWI dark (follows CSF); complete FLAIR suppression |
| Lipoma | Hyperintense | Hyperintense | No enhancement | Signal drops on fat-suppression sequences |
| Superficial siderosis | - | Hypointense rim | - | T2*/GRE/SWI: blooming "coating" of the brainstem/cranial nerves |
Part 5: Individual Lesions - Detailed Imaging
1. Vestibular Schwannoma (Acoustic Neuroma)
- Normal or enlarged IAC (≥2 mm vs contralateral)
- Smooth bony remodeling of the porus acusticus
- No calcification (unlike meningioma)
- Posterior canal wall shortening
- T1: Isointense to brain parenchyma
- T2: Mildly hyperintense; cystic components (15%) are markedly hyperintense
- T1+Gad: Uniform, intense enhancement (homogeneous in small tumors; heterogeneous in large/cystic)
- Morphology:
- "Ice cream cone" sign: globular CPA component (the "scoop") + narrow IAC component (the "cone")
- Acute angle with the posterior petrous bone (unlike meningioma)
- Centered over the porus acusticus
- DWI: No restriction (high ADC)
- May be entirely intracanalicular
Cummings: "Schwannomas are characteristically isointense to the brain on precontrast T1W MRI and mildly hyperintense on T2W MRI with uniform enhancement and centered in the CPA over the porus acusticus. They typically intersect the dura of the posterior fossa at an acute angle."
- Intralabyrinthine schwannoma: Enhancing mass following the basal turn of the cochlea on T1+Gad
- After surgery: Use fat-suppressed enhanced MRI to distinguish residual/recurrent tumor from fat graft
- DTI tractography: Maps displaced facial/cochlear nerve position relative to tumor for preoperative planning
2. Meningioma (Second Most Common, ~10%)
- May be isodense or hyperdense (calcification, hypercellularity)
- Hyperostosis of adjacent petrous bone (broad base with bony reaction)
- Calcification in ~20-25%
- Enhances with contrast
- Does not widen the IAC
- T1: Isointense to brain
- T2: Variable - iso-, hypo-, or hyperintense depending on calcium content and vascularity; fibrous/calcified subtypes are T2 hypointense
- T1+Gad: Intense, homogeneous enhancement
- Key distinguishing features from schwannoma:
- Dural tail sign (linear dural enhancement extending beyond tumor edge - highly suggestive though not specific)
- Broad/sessile base against petrous temporal bone
- Obtuse angle with petrous bone (vs acute angle of schwannoma)
- Eccentric to IAC - rarely extends into IAC
- No IAC widening
- Hyperostosis on CT
Cummings: "A 'dural tail' is considered highly suggestive of, although not specific for, meningiomas. Unlike vestibular schwannomas, meningiomas typically have a sessile growth pattern and will form an obtuse angle with the temporal bone."
3. Epidermoid Cyst (Third Most Common, ~5%)
- Hypoattenuating (similar to CSF density)
- Lobulated, irregular margins
- No calcification typically
- No enhancement
- T1: Hypointense (similar to CSF)
- T2: Hyperintense (similar to CSF) - may superficially appear like arachnoid cyst
- FLAIR: Incomplete suppression (does not fully suppress like CSF) - useful differential point
- T1+Gad: No enhancement
- DWI: Markedly hyperintense (restricted diffusion) - THE key differentiating feature from arachnoid cyst
- ADC: Low (confirms true restriction)
- MRS: Elevated aniline, glutamine/glutamate, choline; absent/reduced NAA and creatinine
Cummings: "Epidermoid cysts will show incomplete attenuation on FLAIR and diffusion restriction (bright) on DWI, whereas arachnoid cysts follow CSF on all sequences and do not diffusion restrict (dark)."
4. Arachnoid Cyst
- T1: Hypointense (CSF signal)
- T2: Hyperintense (CSF signal)
- FLAIR: Complete suppression (follows CSF exactly)
- T1+Gad: No enhancement
- DWI: Hypointense (dark) - NO diffusion restriction (key difference from epidermoid)
- ADC: High (facilitated diffusion)
5. Facial Nerve Schwannoma
- T1: Isointense, smooth expansile mass along facial nerve course
- T2: Hyperintense
- T1+Gad: Strong enhancement; "sausage-link" tubular appearance
- Key sign: Extension along the labyrinthine segment of CN VII (most sensitive sign)
- Eccentric to IAC (unlike vestibular schwannoma which is centered at porus acusticus)
- May be indistinguishable from vestibular schwannoma if limited to IAC
6. Lipoma
- T1: Bright (hyperintense) - pathognomonic
- T2: Hyperintense
- Fat saturation: Signal drops out - confirms fat content
- No enhancement
- Surrounds neurovascular structures of IAC (wraps around CN VII/VIII)
7. Paraganglioma (Glomus Jugulare/Tympanicum)
- Irregular, permeative/destructive bony erosion of jugular fossa (vs smooth scalloping of schwannoma)
- Irregular moth-eaten appearance
- T1 and T2: Heterogeneous mass with:
- "Pepper" = multiple punctate flow voids (high-velocity arterial/venous channels → signal void)
- "Salt" = scattered areas of T1 hyperintensity (slow-flow hemorrhage, subacute blood)
- T1+Gad: Intense enhancement (highly vascular)
- Angiography: Dense tumor blush; hypervascularity (preoperative embolization often performed)
8. Superficial Siderosis
- T2*/GRE/SWI: Characteristic hypointense (dark) rim coating the brainstem, cerebellum, and cranial nerves
- Can cause sensorineural hearing loss and ataxia
- Look for an underlying bleeding source (AVM, tumor, previous trauma/surgery)
Part 6: Key Differentiating Summary
| Feature | Schwannoma | Meningioma | Epidermoid | Arachnoid Cyst |
|---|---|---|---|---|
| IAC widening | Yes | No | No | No |
| Position vs IAC | Centered at porus | Eccentric | Eccentric | Variable |
| Angle with petrous | Acute | Obtuse | N/A | N/A |
| Dural tail | Absent | Present | Absent | Absent |
| Hyperostosis on CT | Absent | Present | Absent | Absent |
| Enhancement | Uniform | Homogeneous | None | None |
| DWI | Not restricted (dark) | Not restricted | Bright (restricted) | Dark (follows CSF) |
| FLAIR | Hyperintense | Variable | Incomplete suppression | Complete suppression |
| Growth pattern | Expansile, displacing | Sessile, broad base | "Creeping," encasing | Smooth, pushing |
| T2 signal | Mildly hyperintense | Hypo/iso (if calcified) | Hyperintense | Hyperintense |
Imaging Approach: Practical Algorithm
Posterior fossa mass at CPA/IAC
|
┌─────┴──────┐
Enhances? No enhancement
| |
┌──┴────────┐ T2 bright?
Centered Broad |
at IAC? base? ┌────┴───────┐
| | DWI DWI
↓ ↓ bright? dark?
Schwannoma Meningioma | |
(ice cream (dural Epidermoid Arachnoid
cone; acute tail; (FLAIR cyst (CSF
angle) obtuse incomplete) all seqs)
angle)