Explain me 10 common heart disease with ecg changes and ecg images of those diseases
Reading File
Finding Sources
Searching the Web
ECG changes 10 common heart diseases atrial fibrillation MI heart block with ECG images
Finding Sources
Finding Sources
Reading Web Page
https://mesimedical.com/insights/frequently-diagnosed-condit…
Finding Sources
Searching the Web
ECG images STEMI heart block WPW LVH pericarditis ventricular tachycardia fibrillation site:litfl.com OR site:ecgwaves.com
Reading File
Reading Web Page
https://ecgwaves.com/topic/stemi-st-elevation-myocardial-inf…
Loading Image
Finding Sources
Searching the Web
ECG atrial fibrillation complete heart block WPW ventricular tachycardia fibrillation images ecgwaves litfl
Reading File
Loading Image
Loading Image
Finding Sources
Reading File
Finding Sources
Loading Image
Finding Sources
Finding Sources
Finding Sources
Loading Image
Searching the Web
ECG example images pericarditis LVH pulmonary embolism hyperkalemia long QT syndrome free use
Loading Image
Loading Image
Loading Image
Searching the Web
ECG pericarditis diffuse ST elevation saddle-shaped image site:litfl.com OR site:ecgwaves.com OR site:ecgguru.com
Loading Image
Loading Image
Here is a comprehensive guide to 10 common heart diseases with their ECG changes and images.
10 Common Heart Diseases: ECG Changes & Images
1. ST-Elevation Myocardial Infarction (STEMI)
What it is: Complete occlusion of a coronary artery causing transmural (full-thickness) myocardial ischemia and necrosis.
ECG Changes:
- Hyperacute T waves - the earliest change, tall and broad T waves (minutes after occlusion)
- ST segment elevation in the leads overlying the infarct zone (measured at J-point, ≥1mm in limb leads, ≥2mm in precordial leads)
- Reciprocal ST depression in leads opposite the infarct
- Pathological Q waves develop over hours to days (>40ms wide, >25% of R wave height) - represent electrically silent dead myocardium
- T wave inversion in the subacute phase
Localization by leads:
- Anterior MI: V1-V4 (LAD occlusion)
- Inferior MI: II, III, aVF (RCA occlusion)
- Lateral MI: I, aVL, V5-V6 (LCx occlusion)
- Posterior MI: tall R waves in V1-V2 with ST depression
Pathophysiology: Three mechanisms cause ST elevation - rapid repolarization, decreased resting membrane potential, and delayed depolarization of infarcted cells all drive current toward overlying electrodes. (Ganong's Review of Medical Physiology)

2. Atrial Fibrillation (AF)
What it is: The most common sustained arrhythmia, characterized by chaotic electrical activity in the atria at 300-600 impulses/min.
ECG Changes:
- Absent P waves - replaced by fibrillatory (f) waves (chaotic, irregular baseline)
- Irregularly irregular R-R intervals (the hallmark finding)
- Ventricular rate typically 100-180 bpm in uncontrolled AF
- QRS complexes are usually narrow (unless aberrant conduction)
- No discernible isoelectric baseline between QRS complexes
Key mechanism: Dilated atria provide the substrate - long conduction pathways plus slow conduction predispose to multiple chaotic re-entry circuits. (Guyton and Hall Textbook of Medical Physiology)
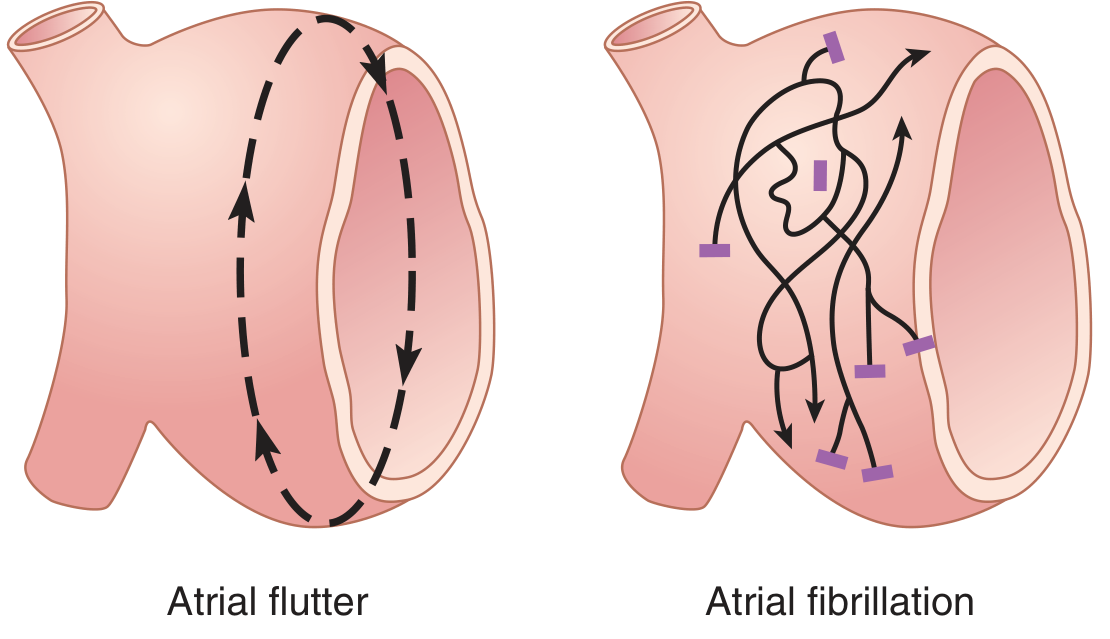
Figure: Impulse pathways in atrial flutter (organized re-entry loop, left) vs atrial fibrillation (chaotic multi-wavelet re-entry, right) - Guyton & Hall Textbook of Medical Physiology
3. Complete (Third-Degree) AV Heart Block
What it is: Complete failure of conduction between atria and ventricles - atria and ventricles beat independently.
ECG Changes:
- P waves present at normal sinus rate (e.g. 75 bpm), firing regularly
- QRS complexes are present but at a slower, independent escape rate (40-60 bpm if junctional; 20-40 bpm if ventricular)
- AV dissociation - P waves bear no relationship to QRS complexes (P-R interval varies constantly)
- Wide QRS if the escape rhythm is ventricular; narrow QRS if junctional
- More P waves than QRS complexes
Clinical significance: Can cause syncope (Stokes-Adams attacks) and sudden death. Requires pacemaker implantation.
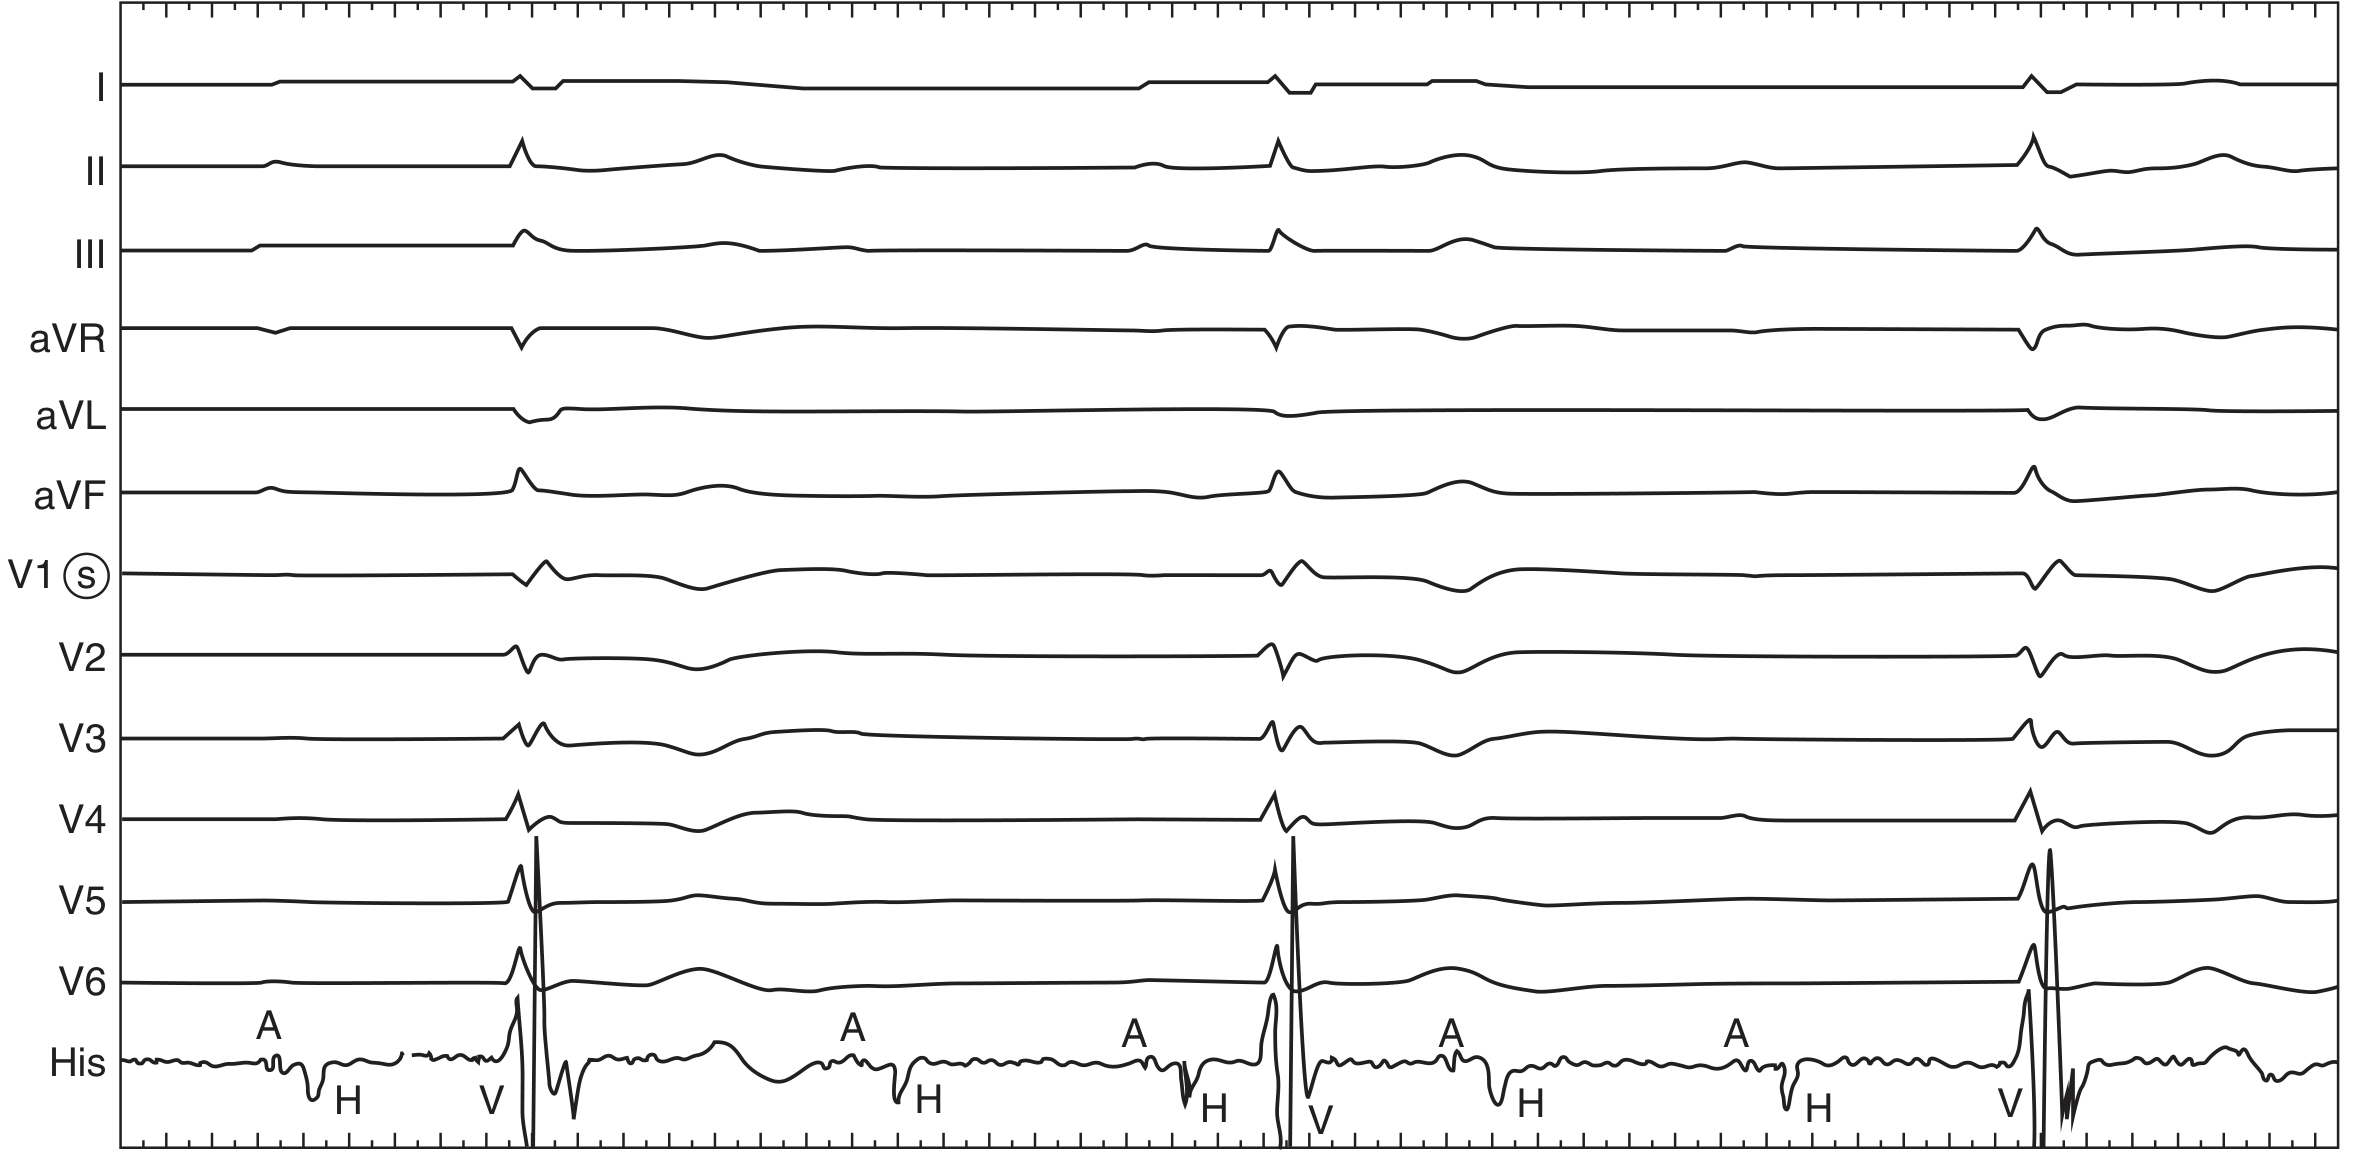
Figure: Complete heart block. Surface leads show independent atrial (A) and ventricular (V) activity with His-bundle (H) recordings confirming total AV dissociation - Fuster & Hurst's The Heart, 15th Edition
4. Ventricular Tachycardia (VT)
What it is: A rapid tachyarrhythmia (>100 bpm, usually 110-250 bpm) arising from ventricular ectopic foci or re-entry circuits. Most commonly occurs with ischemic heart disease.
ECG Changes:
- Wide QRS complexes (>120ms) - the defining feature
- Rate >100 bpm, usually 110-250 bpm
- Regular rhythm (monomorphic VT)
- AV dissociation - P waves visible but dissociated from QRS complexes
- Fusion beats and capture beats - pathognomonic of VT
- Positive QRS concordance in precordial leads (all V1-V6 upright) suggests VT
Distinguish from SVT with aberrancy: AV dissociation, fusion/capture beats, extreme axis deviation, QRS morphology criteria (Brugada algorithm) all point to VT.
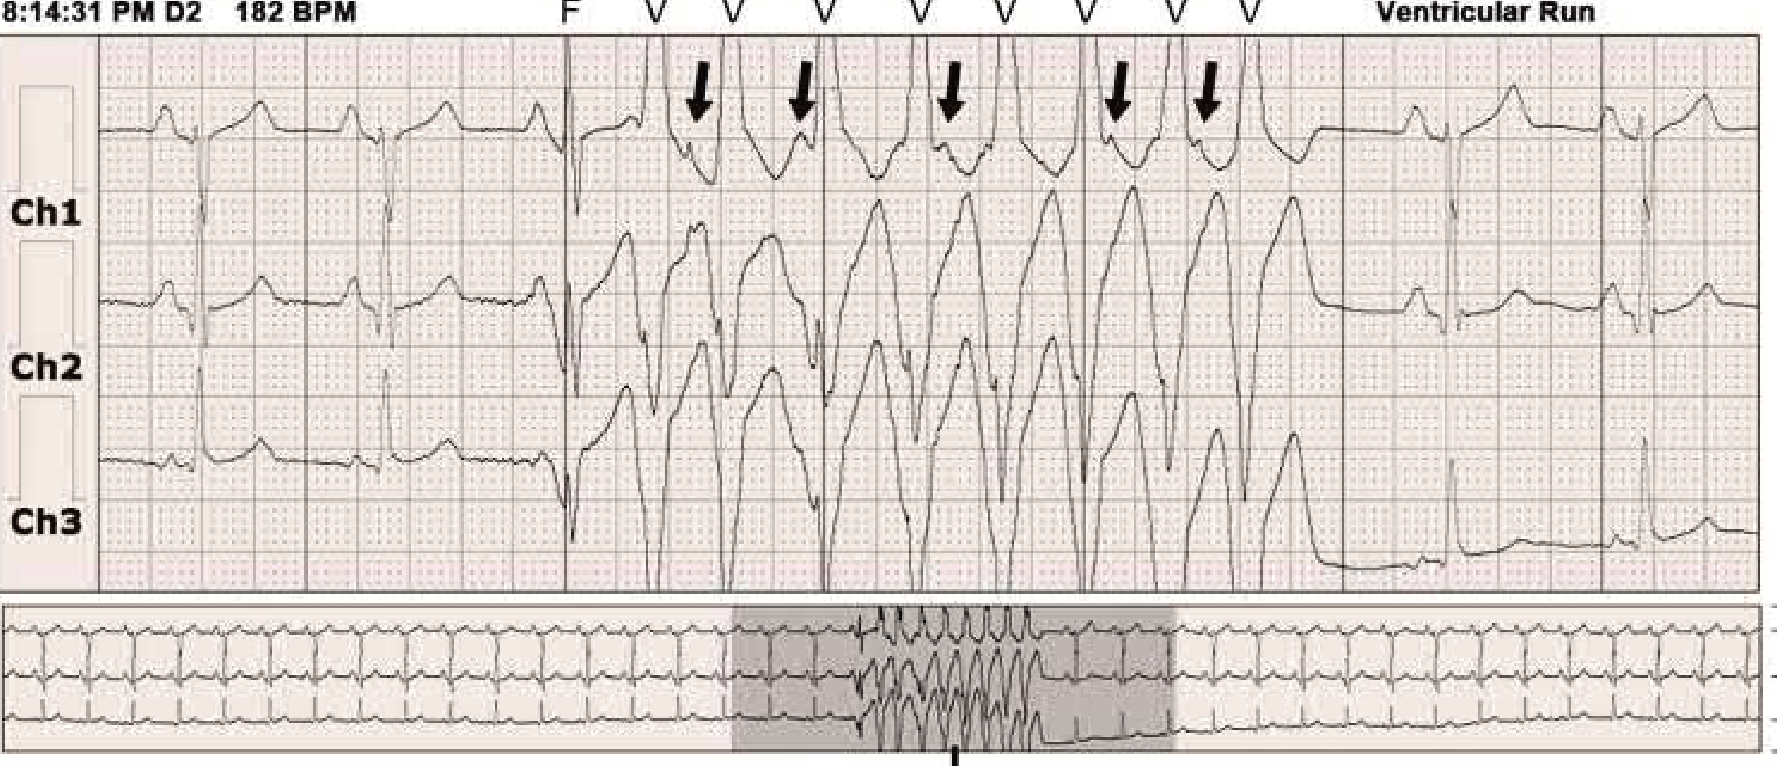
Figure: Holter recording showing sinus rhythm transitioning to a ventricular run (labeled VTACH) with wide complex tachycardia - Braunwald's Heart Disease
5. Ventricular Fibrillation (VF)
What it is: Completely disorganized electrical activity in the ventricles - the ventricles quiver rather than contract. This is a cardiac arrest rhythm with no pulse.
ECG Changes:
- No discernible P waves, QRS complexes, or T waves
- Chaotic, irregular undulations of varying amplitude and frequency
- Coarse VF (large amplitude waves) - more likely to respond to defibrillation
- Fine VF (small amplitude waves) - suggests prolonged arrest, worse prognosis
- Must be distinguished from artifact (which leaves an underlying regular rhythm)
Management: Immediate unsynchronized defibrillation. CPR if defibrillation delayed >1 minute - hand pumping can sustain enough coronary flow to allow subsequent defibrillation success. (Guyton & Hall)
ECG appearance: rapid, completely irregular, chaotic waveforms with no organized cardiac activity - see image above (Panel D from Braunwald shows polymorphic/chaotic VT transitioning toward VF)
6. Wolff-Parkinson-White (WPW) Syndrome
What it is: A pre-excitation syndrome caused by an accessory bypass tract (Bundle of Kent) connecting atria to ventricles, bypassing the AV node.
ECG Changes (in sinus rhythm):
- Short PR interval (<120ms) - atrial impulse reaches ventricles early via the bypass tract
- Delta wave - slurred upstroke of the QRS (initial slow conduction through the bypass tract)
- Wide QRS complex (>120ms) - due to fusion of normal and pre-excited conduction
- ST-T changes secondary to abnormal depolarization sequence
- Pseudo-Q waves / pseudo-infarction pattern in some leads
During AF/flutter: The bypass tract can conduct at very rapid rates (200-300 bpm) producing a dangerous wide-complex, irregular tachycardia that can degenerate into VF. AV-nodal blocking drugs (digoxin, verapamil) are contraindicated in this setting.
Key ECG triad: Short PR + Delta wave + Wide QRS (Pfenninger and Fowler's Procedures for Primary Care)
7. Pericarditis
What it is: Inflammation of the pericardium caused by viral infection (most common), bacterial, autoimmune, or post-MI (Dressler's syndrome).
ECG Changes (evolve through 4 stages):
- Stage 1 (acute): Diffuse, concave ("saddle-shaped") ST elevation in most leads EXCEPT aVR and V1 (where ST is depressed). PR depression in multiple leads (PR elevation in aVR). This differentiates it from STEMI (which has focal ST elevation with reciprocal depression)
- Stage 2: ST normalizes, T waves flatten
- Stage 3: Diffuse T wave inversion
- Stage 4: ECG normalizes (may take weeks)
Key differentiating features from STEMI:
- Diffuse (not focal) ST elevation
- Concave (not convex) ST morphology
- PR depression (highly specific for pericarditis)
- No reciprocal ST depression (except aVR)
- No pathological Q waves
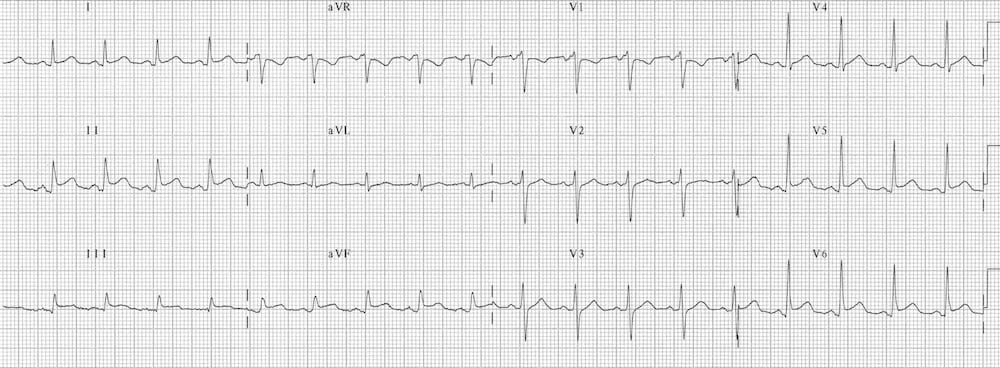
Figure: Classic pericarditis ECG showing diffuse concave ST elevation and PR segment depression - LITFL ECG Library
8. Left Ventricular Hypertrophy (LVH)
What it is: Thickening of the left ventricular myocardium due to chronic pressure overload (hypertension, aortic stenosis) or volume overload. Increases risk of heart failure, arrhythmia, and sudden death.
ECG Changes (Voltage criteria):
- Sokolow-Lyon criteria: S in V1 + R in V5 or V6 ≥35mm
- Cornell criteria: R in aVL + S in V3 ≥28mm (men), ≥20mm (women)
- Tall R waves in lateral leads (I, aVL, V5, V6)
- Deep S waves in right precordial leads (V1, V2)
- Left axis deviation
- "LV strain pattern": ST depression and asymmetric T wave inversion in lateral leads (I, aVL, V5, V6) - indicates high-voltage + repolarization abnormality
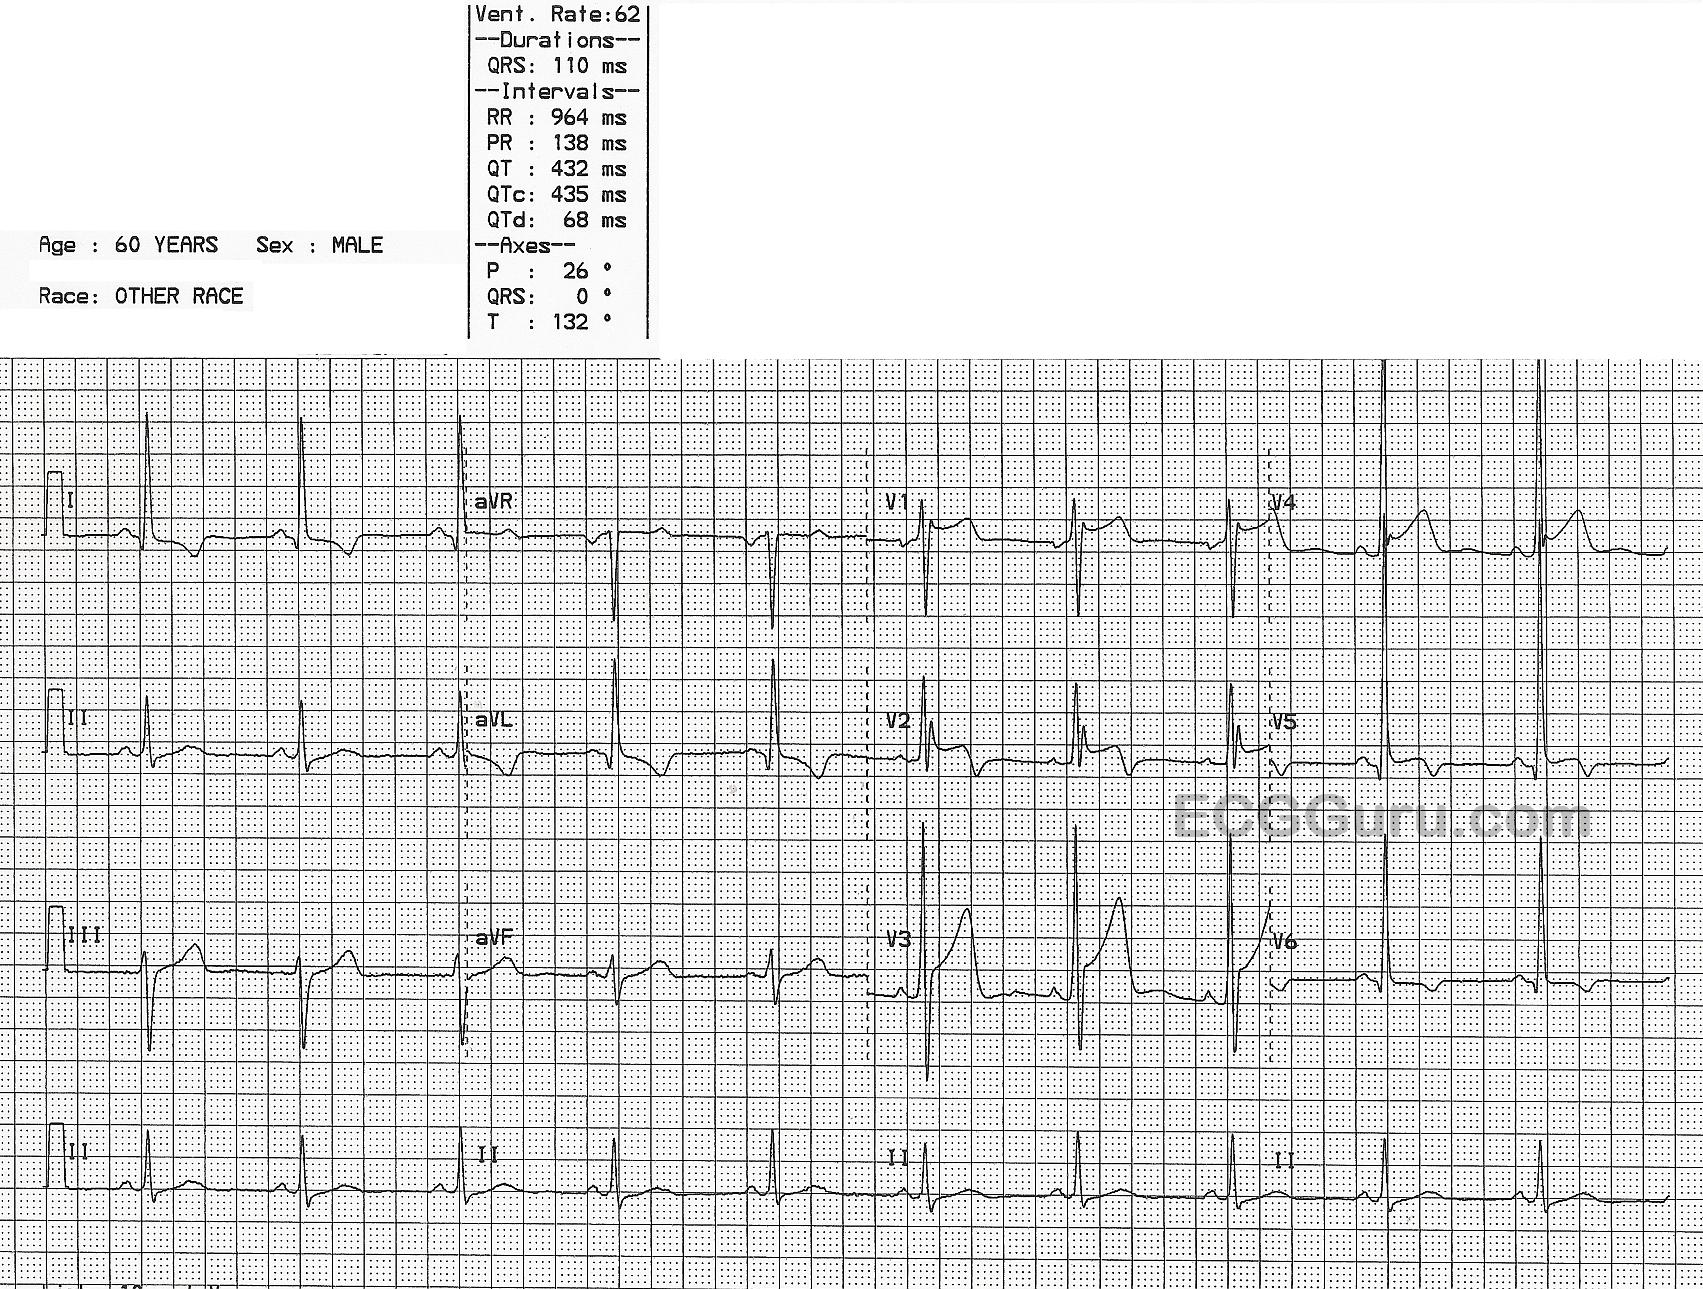
Figure: ECG showing LVH with tall precordial R-wave voltages. Note QRS axis 0° and widened QRS of 110ms - ECGGuru.com
9. Atrial Flutter
What it is: An organized macrore-entrant circuit in the right atrium, typically circulating at 300 bpm (range 250-350 bpm).
ECG Changes:
- Sawtooth flutter waves (F waves) at 250-350 bpm - best seen in II, III, aVF, V1
- Regular flutter waves with no isoelectric baseline between them (classic "sawtooth" or "picket fence" pattern)
- Fixed AV conduction ratio: Most commonly 2:1 (ventricular rate ~150 bpm), 3:1, or 4:1
- QRS complexes are narrow unless aberrant conduction
- A ventricular rate of exactly 150 bpm should always raise suspicion for atrial flutter with 2:1 block
- Unlike AF, the rhythm is regular (at a given conduction ratio)
Clinical note: Flutter waves can be "hidden" inside QRS or T waves at 2:1 block - vagal maneuvers or adenosine will slow AV conduction and unmask the flutter waves.
10. Pulmonary Embolism (PE)
What it is: Obstruction of the pulmonary arterial tree by thrombus, causing acute right heart strain and pressure overload.
ECG Changes:
- Sinus tachycardia - the most common finding (present in >40%)
- S1Q3T3 pattern - S wave in lead I, Q wave and T wave inversion in lead III (classic but seen in only ~20%)
- Right bundle branch block (RBBB) - new incomplete or complete RBBB
- Right axis deviation
- T wave inversions in V1-V4 (right ventricular strain pattern) - the most common repolarization abnormality in large PE
- P pulmonale - tall peaked P waves in II reflecting right atrial enlargement
- Low voltage or electrical alternans if concurrent pericardial effusion/tamponade
Important caveat: The ECG in PE is frequently normal or shows only sinus tachycardia. A normal ECG does NOT rule out PE. D-dimer and CT-PA are the diagnostic cornerstones.
Summary Table
| Condition | Key ECG Finding | Rhythm | QRS Width |
|---|---|---|---|
| STEMI | ST elevation + Q waves | Usually sinus | Narrow (unless LBBB) |
| Atrial Fibrillation | Absent P waves, irregularly irregular | Irregular | Narrow |
| Complete Heart Block | AV dissociation, more P than QRS | Slow escape | Wide (ventricular) |
| Ventricular Tachycardia | Wide complex tachycardia, AV dissociation | Regular, fast | Wide (>120ms) |
| Ventricular Fibrillation | Chaotic, no organized activity | Chaotic | None |
| WPW | Short PR + delta wave | Sinus (or tachyarrhythmia) | Wide |
| Pericarditis | Diffuse concave ST elevation + PR depression | Sinus | Narrow |
| LVH | High voltage (SV1 + RV5 ≥35mm) + strain | Sinus | Narrow-wide |
| Atrial Flutter | Sawtooth F waves at 300 bpm | Regular | Narrow |
| Pulmonary Embolism | Sinus tachycardia + S1Q3T3 + RBBB | Fast sinus | Narrow or RBBB |
Sources: Braunwald's Heart Disease (11th Ed.), Guyton & Hall Textbook of Medical Physiology, Ganong's Review of Medical Physiology, Fuster & Hurst's The Heart (15th Ed.), Harrison's Principles of Internal Medicine (22nd Ed.), Washington Manual of Medical Therapeutics, LITFL ECG Library, ECGwaves.com.
This is a shared conversation. Sign in to Orris to start your own chat.