

evaulate and mark
endochondral ossification growth plate zones histology H&E
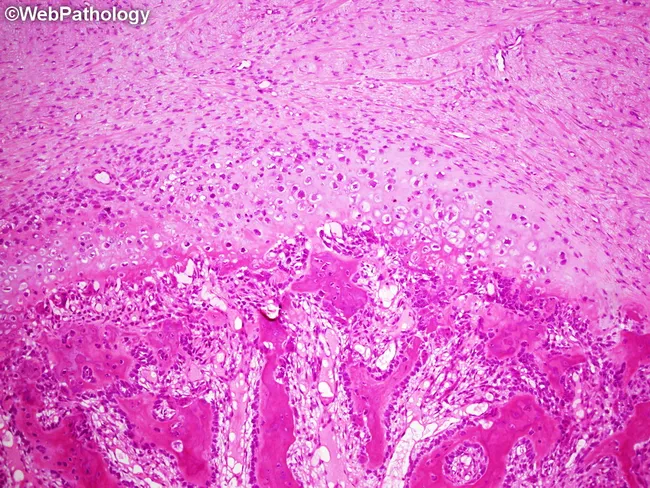
Subungual exostosis histology showing an osteochondral proliferation arising from the distal phalanx and extending beneath the nail bed. The specimen is an excisional/biopsy material stained with Hematoxylin and Eosin (H&E). Low-power examination reveals a zoned architecture with superficial fibrous and fibroblastic stroma merging into cartilaginous metaplasia, consistent with a developing cartilaginous cap. Deeper in the specimen, irregular woven bone trabeculae form by endochondral ossification and are rimmed by plump osteoblasts. The intertrabecular spaces are filled with vascular connective tissue, reflecting active remodeling. In early maturation zones, proliferating cellular fibroblasts blend with cartilaginous tissue; as maturation proceeds, the cartilaginous cap thickens and couples with osseous formation to yield an osteochondral core. Mitotic activity may be relatively high in proliferative regions, yet there are no atypical mitoses or cytologic atypia. The lesion thus demonstrates both fibrocartilaginous callus features and an osteochondroma-like cartilaginous cap with a bony stalk. Clinically, these histologic features support a benign, self-limited exostosis of the distal phalanx, typically presenting under the nail with nail deformity or tenderness. Distinction from malignant periungual tumors relies on preserved architecture, absence of invasion, and lack of cytologic atypia.
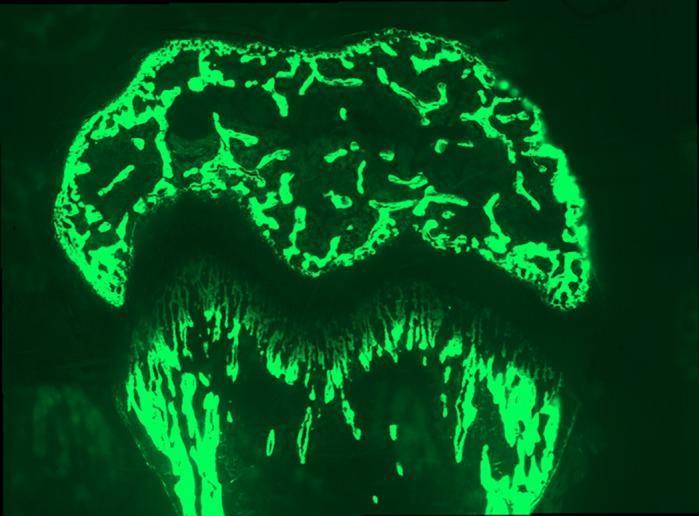
This diagnostic fluorescence microscopy image illustrates the dynamic process of bone mineralization and growth plate architecture using a calcein label. The image is divided into two distinct anatomical regions representing active ossification zones. The superior portion demonstrates a complex, trabecular network within the epiphysis, characterized by bright green fluorochrome labeling of mineralizing bone surfaces. This region shows a non-linear, sponge-like arrangement of interconnected trabeculae. The inferior portion corresponds to the metaphysis, specifically the zone of provisional calcification. Here, the calcein labeling follows a highly organized, vertical, and pillar-like orientation, reflecting the longitudinal growth pattern of long bones. The labeling density in this lower region is highest at the chondro-osseous junction and tapers off distally. This visual is used in orthopedic pathology and histology to study endochondral ossification, longitudinal bone growth rates, and the metabolic activity of osteoblasts during mineral deposition. It serves as an educational tool for understanding the structural transition from cartilaginous templates to mineralized bone.
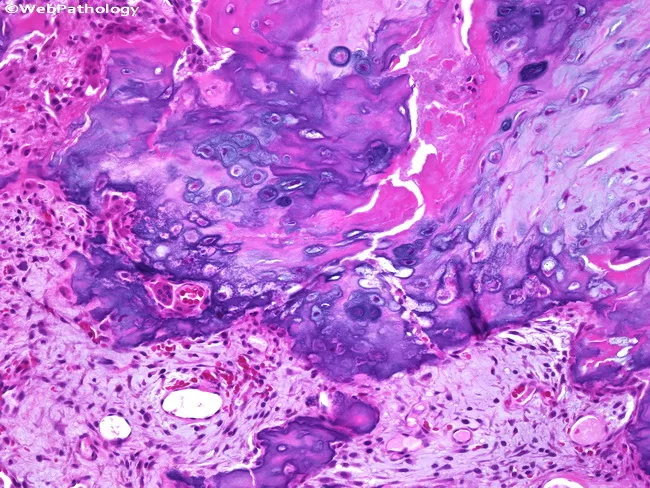
Imaging modality: Light microscopy of a hematoxylin and eosin (H&E) stained histopathology section derived from a periosteal bone lesion. Primary subject: bizarre parosteal osteochondromatous proliferation (BPOP) with irregular endochondral ossification and a cartilaginous/bony matrix on the periosteal surface. Anatomical location: periosteum of cortical bone; commonly involved long bones and especially digits; tissue consists of osteochondral components with cartilage cap and bone trabeculae. Visual features include disorganized cartilage islands, irregular ossification patterns, and a conspicuous blue tinctorial matrix on H&E, reflecting mucopolysaccharide-rich cartilage matrix; chondrocyte clusters with mild atypia may be present; interface with fibrous periosteum demonstrates a non-destructive, non-infiltrative growth. Pathology reveals disorganized osteochondral proliferation rather than malignant invasion. Diagnostic significance centers on recognizing BPOP histology to distinguish from osteochondroma and parosteal osteosarcoma; irregular ossification and blue-cartilage matrix are characteristic clues. Potential clinical use cases encompass diagnostic pathology consultations, educational histology resources, and research comparisons of periosteal osteochondral lesions; this pattern informs surgical planning, prognosis, and follow-up for recurrence risk.
Histology Slide Evaluation
Stain
Diagnosis
Zones Identified (Lower-Left → Upper-Right)
| Zone | Location in Image | Key Features |
|---|---|---|
| Zone of Reserve Cartilage | Lower-left (deep blue/purple) | Small, round chondrocytes in lacunae; sparse cell density; strongly basophilic matrix rich in sulfated glycosaminoglycans; no active proliferation |
| Zone of Proliferation | Lower-mid transition | Chondrocytes organizing into longitudinal columns ("stacked coins"); slightly larger cells; matrix still predominantly basophilic |
| Zone of Hypertrophy | Mid zone | Markedly enlarged (10-20x) chondrocytes with pale, vacuolated cytoplasm (glycogen washed out during processing); matrix compressed into linear bands between columns |
| Zone of Calcified Cartilage | Mid-upper transition | Degenerating hypertrophic chondrocytes; matrix becoming calcified and basophilic (serves as scaffold); preparation for vascular invasion |
| Zone of Resorption / Primary Spongiosa | Upper-right (pink/eosinophilic) | Mixed spicules - basophilic calcified cartilage cores overlaid with eosinophilic osteoid/woven bone; osteoblasts lining spicule surfaces; vascular marrow tissue filling intertrabecular spaces |
Marking Rubric
| Feature | Present? | Score |
|---|---|---|
| Correct stain identification (H&E) | Yes | ✓ |
| Diagnosis: Endochondral ossification / growth plate | Yes | ✓ |
| Zone of reserve cartilage identified | Yes | ✓ |
| Zone of proliferation with columnar arrangement | Yes | ✓ |
| Zone of hypertrophy with enlarged pale chondrocytes | Yes | ✓ |
| Zone of calcified cartilage | Yes | ✓ |
| Zone of resorption / primary spongiosa with mixed spicules | Yes | ✓ |
| Bicolor pattern explained (basophilic cartilage + eosinophilic bone) | Yes | ✓ |
Key Teaching Points
- Basophilic (blue-purple) matrix in the lower-left = sulfated proteoglycans of hyaline cartilage (chondroitin sulfate binds hematoxylin)
- Eosinophilic (pink) matrix in upper-right = osteoid/woven bone (collagen binds eosin)
- Mixed spicules at the chondro-osseous junction are the hallmark: a basophilic calcified cartilage core with a pink osteoid coating deposited by osteoblasts
- VEGF secreted by hypertrophic chondrocytes drives vascular invasion initiating the zone of resorption
- This process continues until epiphyseal fusion (growth plate closure) in early adulthood
Differential Considerations
- Normal growth plate vs. Rickets: In rickets (vitamin D deficiency), the zone of hypertrophy is markedly widened and disorganized; calcification fails to occur - the appearance here is normal
- Osteochondroma: Would show a cartilaginous cap transitioning to bone but without organized columnar zoning
- The organized, zonal architecture here confirms physiologic endochondral ossification
Create a labeled diagram highlighting the five zones
A detailed labeled histology diagram of the epiphyseal growth plate showing all five zones of endochondral ossification. The diagram is oriented vertically with a clear gradient from top to bottom. At the top is the epiphysis side and at the bottom is the diaphysis/bone marrow side. Each zone is clearly demarcated by a horizontal dashed line and labeled with an arrow pointing to it on the left side. Zone 1 (top) - Zone of Reserve Cartilage: small, round chondrocytes scattered individually in lacunae, deep blue-purple hyaline cartilage matrix, sparse cells, no organization. Zone 2 - Zone of Proliferation: chondrocytes arranged in distinct longitudinal columns (stacked coins appearance), cells slightly larger, matrix still basophilic blue-purple. Zone 3 - Zone of Hypertrophy: very large, swollen chondrocytes with pale vacuolated cytoplasm, still in columns but much bigger, matrix compressed into thin bands between cell columns. Zone 4 - Zone of Calcified Cartilage: hypertrophic cells degenerating, matrix heavily calcified and darkly stained, some ghost cells visible, matrix mineralized. Zone 5 (bottom) - Zone of Resorption / Primary Spongiosa: pink eosinophilic woven bone deposited on basophilic calcified cartilage cores forming mixed spicules, osteoblasts lining the spicules, vascular marrow spaces between trabeculae, transition to pink bone marrow cavity. The diagram uses realistic H&E staining colors: blue-purple for cartilage matrix, pink for bone and osteoid, pale/white for cell cytoplasm. Labels on the right side list the functional significance of each zone. Title at the top reads "Epiphyseal Growth Plate - Five Zones of Endochondral Ossification". Clean scientific illustration style with white background.
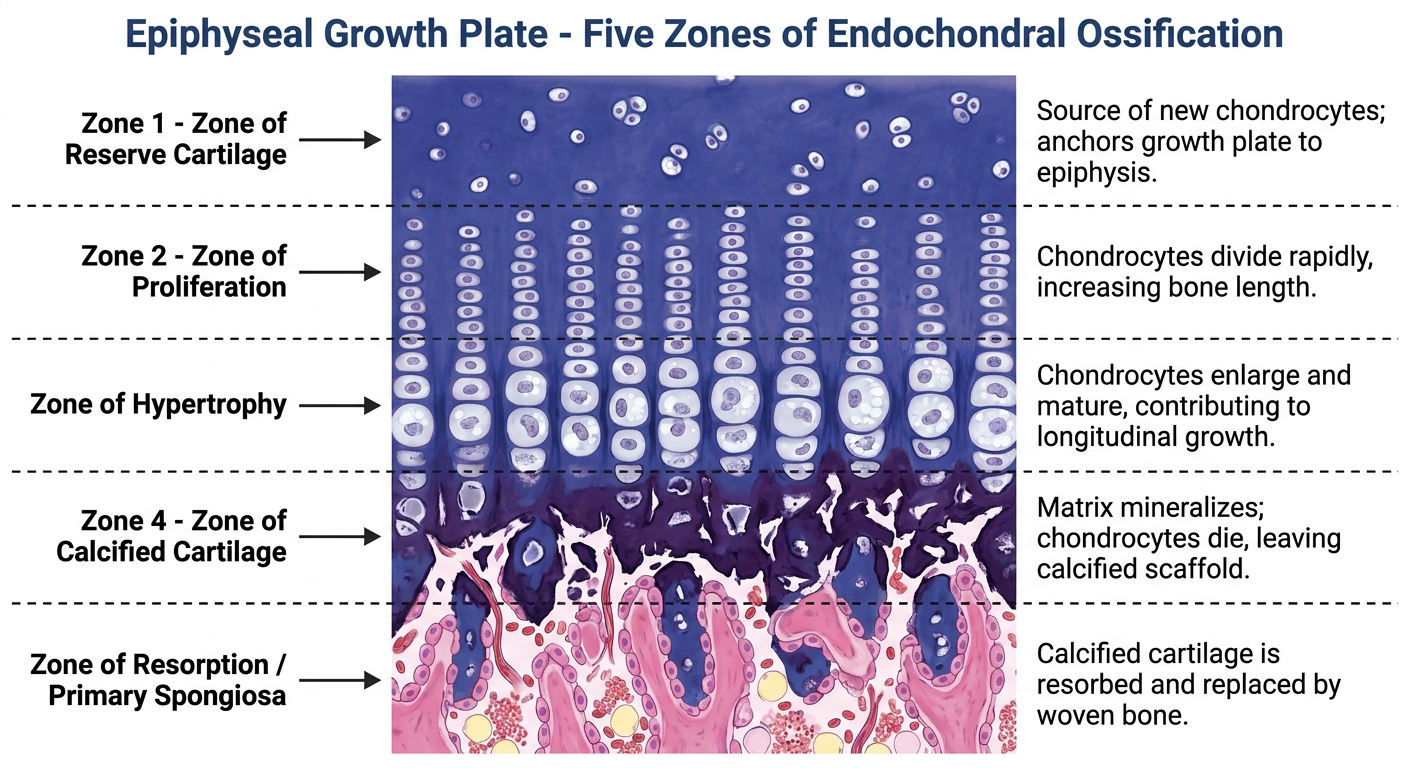
| # | Zone | Key Feature |
|---|---|---|
| 1 | Reserve Cartilage | Small scattered chondrocytes, no proliferation |
| 2 | Proliferation | Chondrocytes stack into columns ("coin stacks") |
| 3 | Hypertrophy | Cells enlarge 10-20x, pale vacuolated cytoplasm |
| 4 | Calcified Cartilage | Matrix mineralizes, cells degenerate (VEGF released) |
| 5 | Resorption / Primary Spongiosa | Mixed spicules form - osteoblasts deposit pink osteoid on blue calcified cartilage cores |

make it into flowchart
A clean, vertical scientific flowchart titled "Endochondral Ossification: Five Zones of the Epiphyseal Growth Plate". The flowchart flows from top (EPIPHYSIS) to bottom (DIAPHYSIS / BONE MARROW). Each zone is a large rounded rectangle box connected by a bold downward arrow. Box 1 (light blue-purple): "1. ZONE OF RESERVE CARTILAGE" with bullet points: "• Small, resting chondrocytes in lacunae", "• No active proliferation", "• Rich basophilic hyaline matrix", "• Serve as stem-cell reservoir" Arrow labeled: "Chondrocytes activated → begin dividing" Box 2 (medium blue-purple): "2. ZONE OF PROLIFERATION" with bullet points: "• Chondrocytes divide rapidly", "• Cells flatten and stack into longitudinal columns", "• 'Coin stack' arrangement", "• Active collagen type II & XI secretion" Arrow labeled: "Cell division stops → hypertrophy begins" Box 3 (pale lavender): "3. ZONE OF HYPERTROPHY" with bullet points: "• Chondrocytes enlarge 10–20×", "• Pale vacuolated cytoplasm (glycogen)", "• Type X collagen secreted", "• VEGF released → signals vascular invasion" Arrow labeled: "Matrix mineralizes → cells degenerate" Box 4 (grey-blue): "4. ZONE OF CALCIFIED CARTILAGE" with bullet points: "• Matrix impregnated with calcium salts", "• Chondrocytes undergo apoptosis", "• Calcified matrix serves as ossification scaffold", "• Boundary: 'tidemark' visible" Arrow labeled: "Blood vessels & osteoprogenitors invade" Box 5 (pink-red): "5. ZONE OF RESORPTION (Primary Spongiosa)" with bullet points: "• Vascular invasion from marrow", "• Osteoblasts deposit osteoid on calcified cartilage spicules", "• 'Mixed spicules': blue calcified cartilage core + pink bone", "• Osteoclasts remodel trabeculae" At the bottom: a pink box labeled "BONE MARROW CAVITY (Diaphysis)" On the left side a vertical double-headed arrow labeled "Direction of bone growth". Clean white background, professional medical illustration style, color coded boxes.
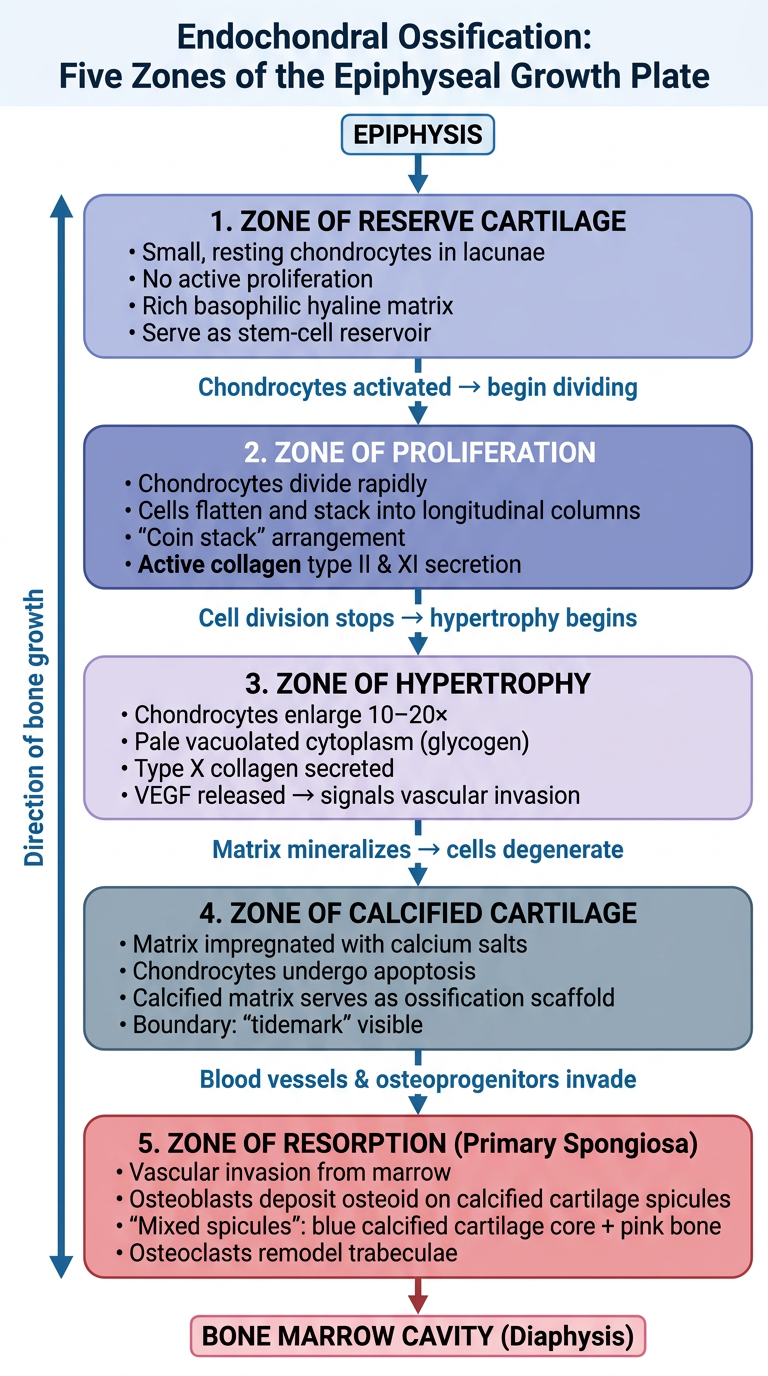
- Reserve Cartilage → chondrocytes activated to divide
- Proliferation → cell division stops, hypertrophy begins
- Hypertrophy → matrix mineralizes, cells degenerate (VEGF released)
- Calcified Cartilage → blood vessels and osteoprogenitors invade
- Resorption / Primary Spongiosa → osteoblasts lay down bone on cartilage spicules → Bone Marrow Cavity
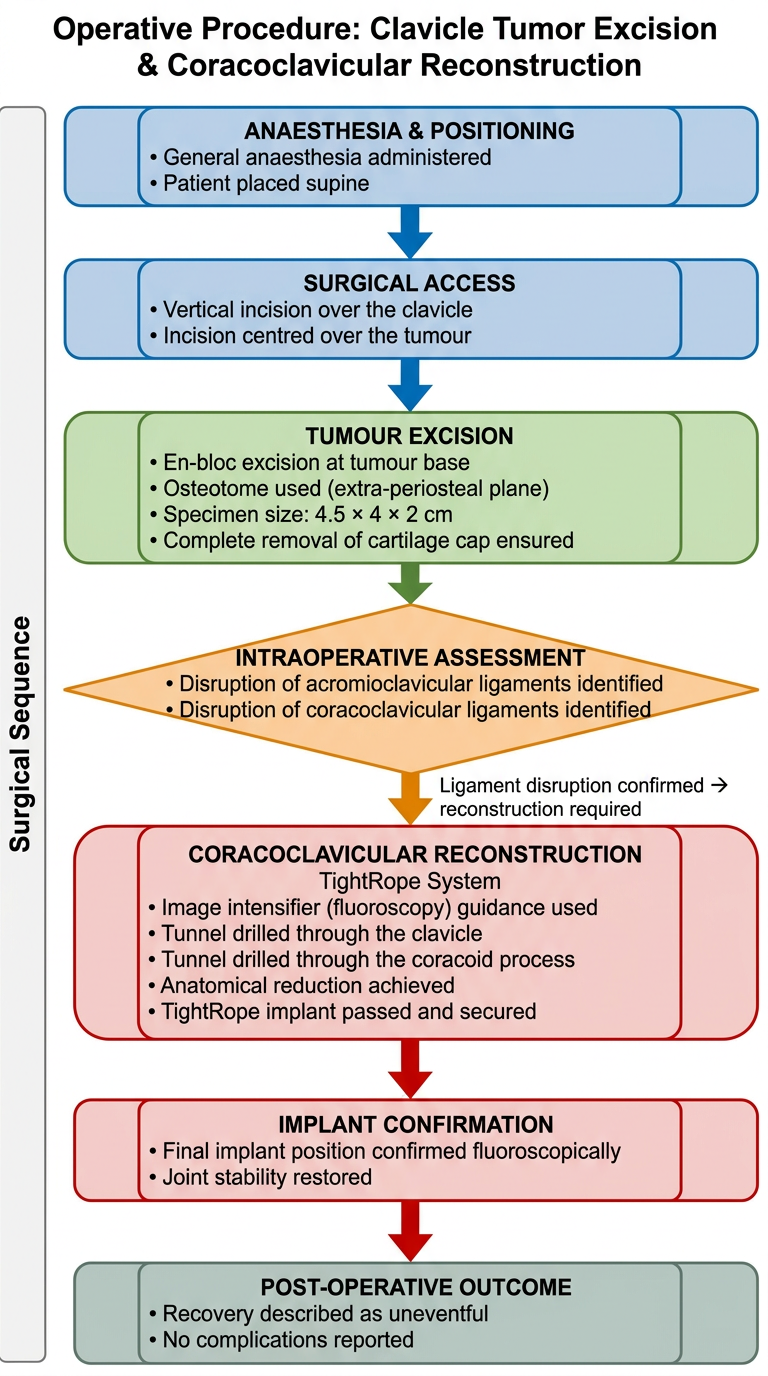
Under general anesthesia, supine position, vertical incision made over the clavicle centred over tumor. Tumor was removed via en-bloc excision at its base using an osteotome (Extra periosteal) and measured 4.5 x 4 x 2 cm. Complete removal of the cartilage cap was ensured. Following the excision, an assessment revealed disruption of acromioclavicular and coracoclavicular ligaments. Consequently, a coracoclavicular reconstruction was performed using a tight rope system. Under image intensifier guidance, tunnels were created in both the clavicle and the coracoid process to facilitate anatomical reduction and fixation was secured with tight rope to restore joint stability, and the final position of the implant was confirmed fluoroscopically. The patient’s post-operative recovery was described as uneventful. Make it in flowchart mode
A clean professional vertical surgical procedure flowchart titled "Operative Procedure: Clavicle Tumor Excision & Coracoclavicular Reconstruction". White background, medical illustration style, each step in a rounded rectangle box connected by bold downward arrows. Color coded: blue for pre-operative/setup steps, green for tumor excision steps, orange for assessment/finding steps, red for reconstruction steps, and grey-green for post-operative. Box 1 (blue): "ANAESTHESIA & POSITIONING" bullet points: "• General anaesthesia administered", "• Patient placed supine" Arrow down Box 2 (blue): "SURGICAL ACCESS" bullet points: "• Vertical incision over the clavicle", "• Incision centred over the tumour" Arrow down Box 3 (green): "TUMOUR EXCISION" bullet points: "• En-bloc excision at tumour base", "• Osteotome used (extra-periosteal plane)", "• Specimen size: 4.5 × 4 × 2 cm", "• Complete removal of cartilage cap ensured" Arrow down Box 4 (orange, diamond decision shape): "INTRAOPERATIVE ASSESSMENT" bullet points: "• Disruption of acromioclavicular ligaments identified", "• Disruption of coracoclavicular ligaments identified" Arrow down labeled "Ligament disruption confirmed → reconstruction required" Box 5 (red): "CORACOCLAVICULAR RECONSTRUCTION" subtitle: "TightRope System" bullet points: "• Image intensifier (fluoroscopy) guidance used", "• Tunnel drilled through the clavicle", "• Tunnel drilled through the coracoid process", "• Anatomical reduction achieved", "• TightRope implant passed and secured" Arrow down Box 6 (red): "IMPLANT CONFIRMATION" bullet points: "• Final implant position confirmed fluoroscopically", "• Joint stability restored" Arrow down Box 7 (light green): "POST-OPERATIVE OUTCOME" bullet points: "• Recovery described as uneventful", "• No complications reported" On the left side of the flowchart a vertical label reading "Surgical Sequence". Professional clean typography, adequate spacing between boxes, bold arrow connectors.
| Step | Phase | Key Action |
|---|---|---|
| 1 | Pre-op | GA + supine positioning |
| 2 | Access | Vertical incision over clavicle/tumor |
| 3 | Excision | En-bloc removal, 4.5×4×2 cm, cartilage cap cleared |
| 4 | Assessment | AC & CC ligament disruption identified |
| 5 | Reconstruction | TightRope system - tunnels in clavicle + coracoid under fluoroscopy |
| 6 | Confirmation | Implant position verified fluoroscopically |
| 7 | Post-op | Uneventful recovery |
make the flowchart such that i can fit it in the surgical procedure part in the ppt