
Prepare a presentation on investigation of thyroid at mbbs level
thyroid function tests TSH T3 T4 interpretation
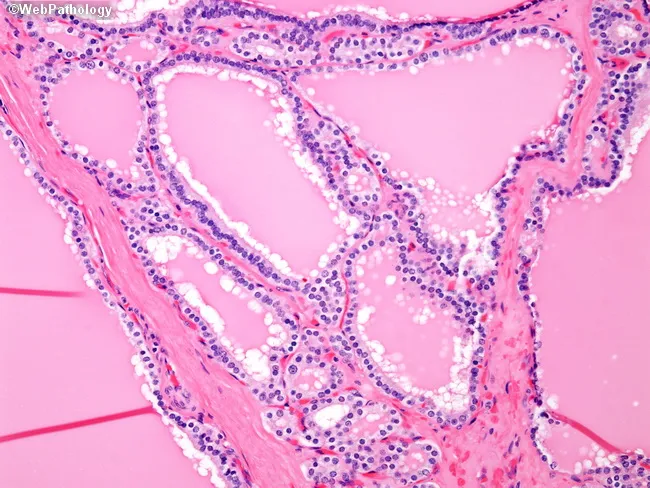
Imaging modality: Light microscopy of thyroid tissue stained with Hematoxylin and Eosin (H&E), magnification approximately 200x. Anatomic source: thyroid gland in the neck with diffuse follicular architecture preserved. Visual features: enlarged follicles containing pale, eosinophilic colloid with scalloped margins; tall, hyperplastic follicular epithelium and mild to moderate papillary infolding are evident. The colloid scalloping results from ongoing colloid resorption driven by thyrocyte hyperactivity. Overall, the gland demonstrates diffuse goiter with uniform follicular hyperplasia and increased vascularity. Pathologic interpretation: autoimmune hyperthyroidism consistent with Graves disease; stimulation by thyroid-stimulating immunoglobulins leads to TSH receptor activation and increased thyroid hormone production (T3/T4). Clinical significance: histologic picture supports autoimmune etiology and helps differentiate Graves disease from other causes of thyrotoxicosis, such as toxic multinodular goiter or thyroiditis; the absence of focal adenomas supports a diffuse process. Normal variants: none relevant. Differential considerations: toxic multinodular goiter (nodular, irregular follicles), subacute thyroiditis (inflammatory infiltrate). Clinical correlation: correlate with serum TSH, free T4, T3, anti-TSH receptor antibodies, and clinical symptoms (weight loss, heat intolerance, weakness, ophthalmopathy). This image is valuable for educational teaching, histopathology references, and research on autoimmune thyroid disease. Correlative imaging data and molecular studies can enhance diagnostic precision.
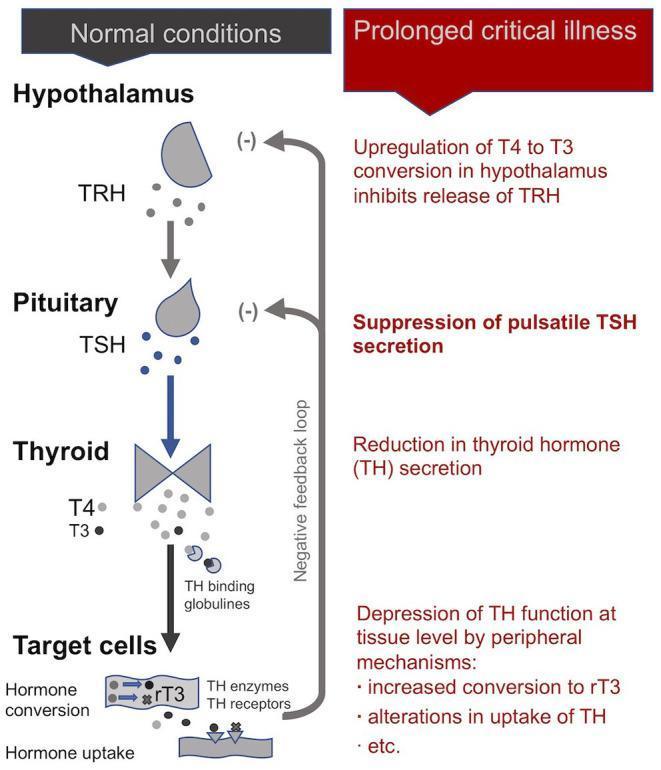
This pathophysiology diagram illustrates the Hypothalamic-Pituitary-Thyroid (HPT) axis, comparing normal physiological conditions with the alterations observed during prolonged critical illness. The 'Normal conditions' section shows the standard cascade: the Hypothalamus secretes TRH, which stimulates the Pituitary to release TSH, leading the Thyroid gland to produce T4 and T3. These hormones reach target cells via TH binding globulins for hormone conversion and uptake, with a negative feedback loop inhibiting TRH and TSH secretion. In contrast, the 'Prolonged critical illness' section details the central and peripheral suppression of the axis. Key pathological features include: upregulation of T4 to T3 conversion in the hypothalamus (inhibiting TRH release), suppression of pulsatile TSH secretion by the pituitary, reduced thyroid hormone secretion, and depression of thyroid function at the tissue level. Peripheral mechanisms shown include increased conversion to inactive rT3 and altered hormone uptake. This comparison illustrates the endocrine maladaptation typical of Non-Thyroidal Illness Syndrome (NTIS) in intensive care settings.
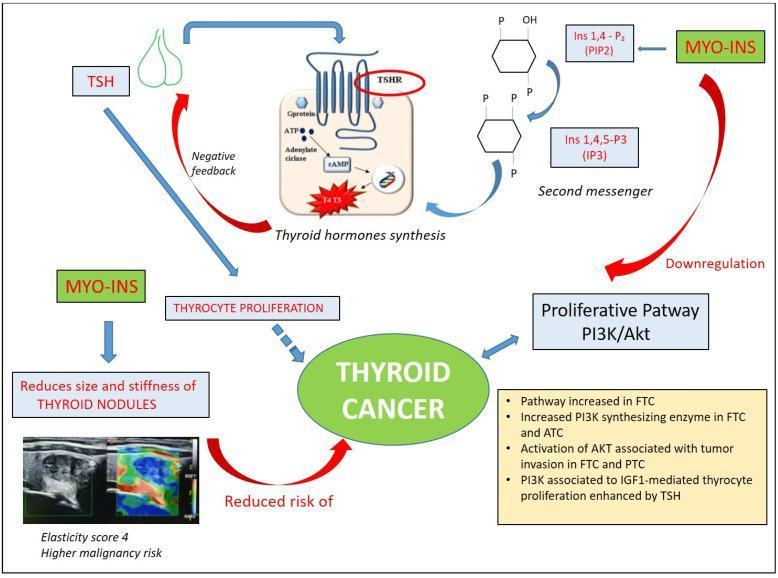
This pathophysiology diagram illustrates the regulatory role of Myo-inositol (MYO-INS) in thyroid function and its protective mechanisms against thyroid cancer. The diagram maps two primary pathways: first, MYO-INS serves as a precursor to phosphoinositide second messengers (PIP2 and IP3), which facilitate thyroid hormone synthesis. Increased T3 and T4 levels then exert negative feedback on TSH secretion, thereby inhibiting TSH-driven thyrocyte proliferation. Second, MYO-INS is shown to downregulate the PI3K/Akt proliferative pathway, which is typically overactive in follicular (FTC), anaplastic (ATC), and papillary thyroid cancer (PTC). A clinical component includes ultrasound elastography images showing a thyroid nodule with high stiffness (Elasticity score 4); the diagram indicates that MYO-INS reduces the size and stiffness of such nodules, ultimately leading to a reduced risk of thyroid cancer. Key molecular elements include TSHR signaling, cAMP, and IGF1-mediated proliferation, highlighting the transition from benign nodules to malignancy.

A comparison panel of diagnostic images illustrating molecular and anatomical pituitary imaging in a patient with a TSH-secreting microadenoma (thyrotropinoma). The content displays two rows representing 'Pre-SRL' (somatostatin receptor ligand) and 'Post-SRL' treatment states, featuring coronal T1 spin-echo (SE) MRI, T1 SE with Gadolinium, volumetric fast spoiled gradient recalled echo (FSPGR) MRI, and 11C-methionine PET coregistered with FSPGR MRI (Met-PET/MRCR). While anatomical MRI sequences (T1, +Gad, FSPGR) appear unremarkable and show no structural changes between treatment states, the functional Met-PET/MRCR reveals a distinct, focal radiotracer uptake (intense red/yellow signal) just to the left of the infundibulum insertion. Following SRL therapy, there is a dramatic diminution in radiotracer intensity (shifting to blue), correlating with normalized thyroid function tests (Free T4, Free T3, and TSH values shown in adjacent tables). This comparison highlights the utility of functional PET imaging in localizing occult microadenomas that are not detectable via standard structural MRI.
thyroid ultrasound nodule goiter scan
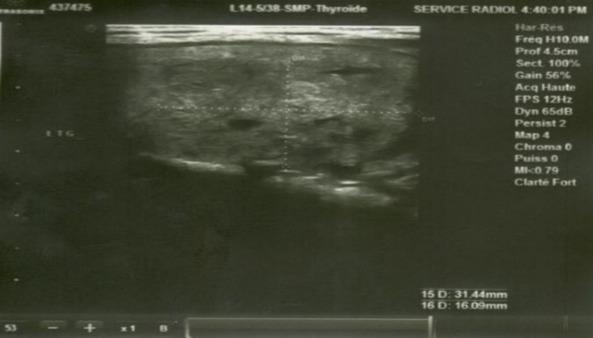
Diagnostic Image: This ultrasound scan of the cervical region captures a thyroid gland exhibiting characteristics of a multinodular goiter. The thyroid parenchyma is markedly heterogeneous, containing multiple nodules of varying echogenicity. A prominent hypoechoic nodule in the left lobe is shown, measuring approximately 13x16 mm. This specific nodule presents with blurred, ill-defined margins and internal punctate hyperechoic foci suggestive of microcalcifications. The overall sonographic appearance is classified as TI-RADS 4B, indicating a high suspicion for malignancy and requiring further evaluation such as fine-needle aspiration. The clinical context involves a patient with suspected Multiple Endocrine Neoplasia (MEN) type 2, given the coexistence of thyroid nodules and a pheochromocytoma. This imaging is critical for endocrinology and radiology students to recognize suspicious sonographic features (hypoechogenicity, irregular borders, microcalcifications) in thyroid pathology.
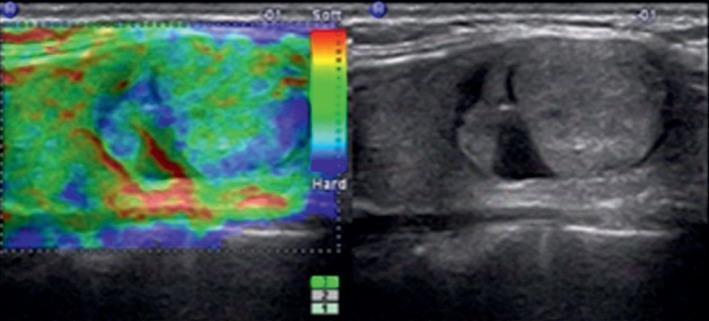
A dual-panel diagnostic ultrasound image of a 20 mm left thyroid nodule. The right panel displays a transverse B-mode (grayscale) ultrasound scan showing an isoechoic, well-circumscribed nodule with a smooth margin and a wider-than-tall orientation. The nodule lacks macro- or microcalcifications and possesses a mixed solid-cystic appearance. The left panel shows the corresponding real-time elastography (RTE) color map superimposed on the grayscale image. The elastography map utilizes a spectrum from red (soft) to blue (hard), with the nodule exhibiting a mosaic pattern of green and blue, indicating soft to intermediate tissue elasticity. This is quantitatively represented by an elasticity score (ES) of 2. These combined features align with a Thyroid Imaging Reporting and Data System (TI-RADS) category 3 classification, clinically consistent with a benign lesion such as nodular goiter.
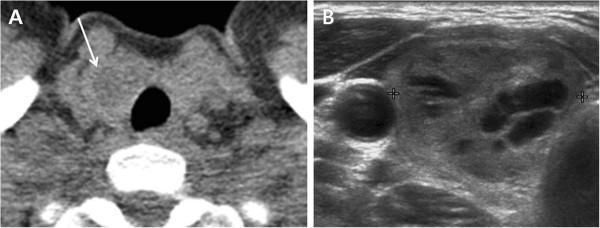
This dual-panel diagnostic image displays a comparison between Computed Tomography (CT) and Ultrasound (US) findings in a 49-year-old patient with an adenomatous goiter. Image A is an axial Low-Dose Helical CT (LDCT) scan of the neck at the level of the thyroid gland. An arrow identifies a 21 mm hypodense nodule within the right thyroid lobe; the lesion appears relatively uniform in density compared to the adjacent thyroid parenchyma and lacks internal calcification. Image B is a transverse grayscale ultrasound of the same right thyroid lobe, where calipers demarcate the nodule. The ultrasound reveals a heterogeneous, mixed solid and cystic composition, characterized by hypoechoic (fluid-filled) areas interspersed with isoechoic solid components. The image set illustrates the correlation between incidental thyroid nodules (ITNs) found on routine CT screening and their subsequent characterization via targeted ultrasonography, a common workflow in endocrinology and radiology for differentiating benign adenomatous changes from potentially malignant lesions.
thyroid scintigraphy radioiodine scan hot cold nodule
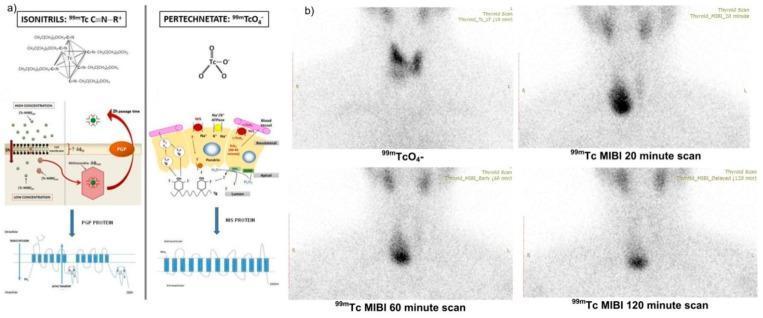
This composite educational image illustrates the pathophysiology and diagnostic imaging of thyroid nodules using dual-tracer scintigraphy. Panel (a) contains diagrams of the molecular structures of Isonitrils (99mTc-MIBI) and Pertechnetate (99mTcO4−) alongside cellular models showing their uptake mechanisms: pertechnetate via the Sodium/Iodide Symporter (NIS) and MIBI through mitochondrial trapping and P-glycoprotein (PGP) efflux. Panel (b) presents clinical nuclear medicine scans of a 42-year-old female. The 99mTcO4− scan shows a 'cold' nodule in the right thyroid lobe with significantly decreased radiotracer uptake compared to the normal left lobe. Sequential 99mTc-MIBI scans at 20, 60, and 120 minutes demonstrate 'mismatch' physiology: the nodule appears 'hot' with intense, progressive radiotracer retention and reduced efflux over time. This mismatch pattern (pertechnetate-cold/MIBI-hot with delayed retention) is a high-risk indicator for malignancy, such as Hurthle cell or papillary thyroid carcinoma, reflecting active mitochondrial metabolism and potential PGP pump dysfunction.
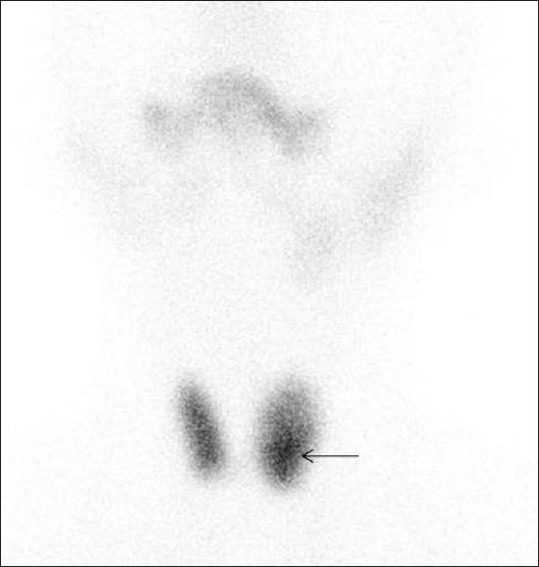
**Imaging Modality:** Technetium-99m (Tc-99m) pertechnetate thyroid scintigraphy. **Anatomical Region:** Anterior view of the neck and upper thorax, visualizing the thyroid gland and salivary glands (submandibular and parotid glands). **Observed Pathology:** The scan reveals a hyperfunctioning ("hot") nodule located in the lower pole of the left thyroid lobe (indicated by an arrow). This area demonstrates focal, intense radiotracer uptake compared to the surrounding thyroid parenchyma. **Characteristic Visual Features:** * **Hypermetabolic Activity:** Increased tracer concentration in the left lower pole, characteristic of an autonomous or hyperfunctioning follicular lesion. * **Tracer Distribution:** Normal physiological uptake is visible in the salivary glands and the right thyroid lobe. * **Nodule Morphology:** The hot nodule appears somewhat ill-defined and occupies a significant portion of the left lobe's inferior aspect. **Clinical Significance:** A solitary "hot" nodule on Tc-99m scintigraphy typically suggests a benign etiology, such as a toxic adenoma or a hyperfunctioning follicular adenoma. The presence of focal radiopharmaceutical accumulation helps differentiate this from a "cold" nodule, which carries a higher risk of malignancy.
fine needle aspiration cytology thyroid FNAC
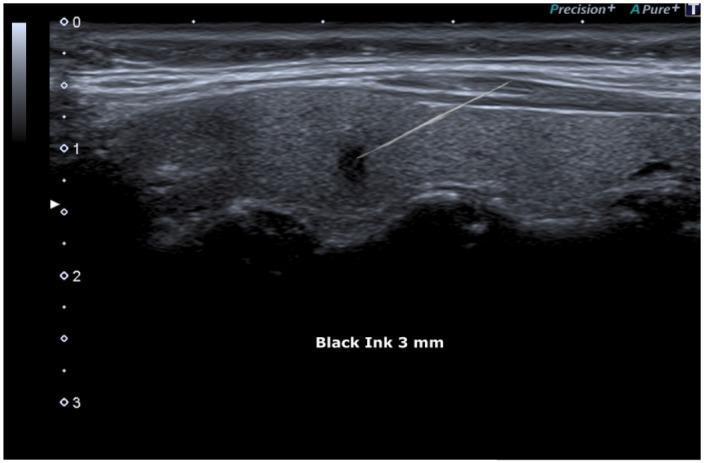
A diagnostic ultrasound image of the thyroid gland demonstrating an ultrasound-guided fine needle aspiration cytology (FNAC) procedure. The image reveals a large, predominantly isoechoic to mildly heterogeneous parenchymal mass containing a distinct, small, focal hypoechoic micro-focus. A highly echogenic, thin linear structure representing a biopsy needle is visualized in a diagonal orientation, entering from the upper right. The distal tip of the needle is precisely positioned within the center of the dark hypoechoic lesion. Superficial to the target mass, anatomical layers of subcutaneous tissue and muscle are visible as striated, horizontal echogenic bands. Depth markers are present on the left axis, and the annotation 'Black Ink 3 mm' likely refers to the size of the micro-focus or marking for surgical orientation. This image illustrates the real-time clinical application of ultrasonography in identifying and sampling suspicious thyroid nodules, specifically those suggestive of papillary thyroid carcinoma (TIR5/Bethesda VI).
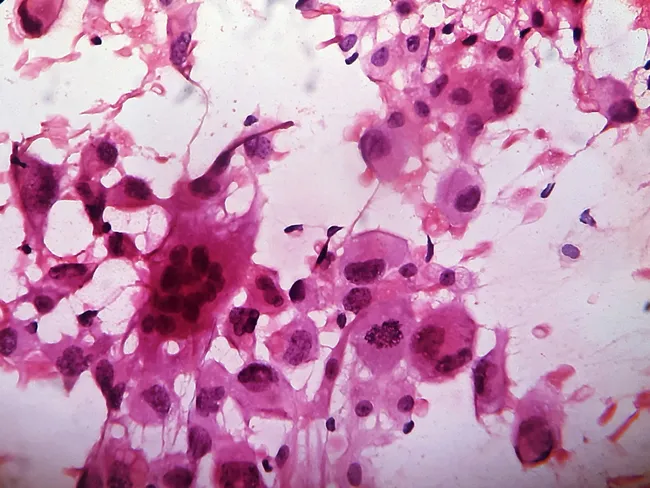
Fine-needle aspiration cytology (FNAC) of a midline anterior neck mass yields a highly cellular smear composed of pleomorphic malignant cells with markedly enlarged, hyperchromatic nuclei, conspicuous nucleoli, and occasional intranuclear inclusions. The tumor cells are variably polygonal to bizarre in shape, often arranged singly or in discohesive clusters, with frequent mitotic figures. Intermixed within the cellular background are numerous osteoclast-like giant cells containing multiple nuclei, creating a characteristic giant cell-rich pattern. Background material shows scant colloid and occasional necrotic debris, consistent with an anaplastic process in the thyroid. The overall cytomorphology is compatible with Anaplastic Thyroid Carcinoma (ATC), a rare, highly aggressive thyroid malignancy; the giant cell-rich variant represents one morphologic spectrum. Immunocytochemical profiling is typically required to confirm thyroid origin and exclude mimics such as lymphoma or metastatic sarcoma. Clinically, ATC presents in elderly patients as a rapidly enlarging neck mass with potential airway compromise and vocal changes; the prognosis remains dismal despite therapy. This image thus documents a high-grade undifferentiated thyroid neoplasm with giant cell differentiation, emphasizing the diagnostic challenge and need for ancillary studies, including thyroid lineage markers (TTF-1, PAX8) and proliferation indices, to support an accurate diagnosis and guide urgent multidisciplinary management for optimal patient care.
mkdir -p /tmp/workspace/thyroid-pptx && ls /tmp/workspace/
~/thyroid-pptx/build_pptx.py
import subprocess, json, base64
from io import BytesIO
from pptx import Presentation
from pptx.util import Inches, Pt, Emu
from pptx.dml.color import RGBColor
from pptx.enum.text import PP_ALIGN, MSO_ANCHOR
from pptx.util import Inches, Pt
import requests

# ── Colour palette ────────────────────────────────────────────────────────────
TEAL_DARK   = RGBColor(0x00, 0x6E, 0x7F)   # header bars
TEAL_MID    = RGBColor(0x00, 0x99, 0xAA)   # accent
TEAL_LIGHT  = RGBColor(0xE0, 0xF5, 0xF8)   # content bg
WHITE       = RGBColor(0xFF, 0xFF, 0xFF)
DARK_TEXT   = RGBColor(0x1A, 0x1A, 0x2E)
GOLD        = RGBColor(0xF5, 0xA6, 0x23)
LIGHT_GRAY  = RGBColor(0xF4, 0xF6, 0xF9)

def hex_to_rgb(h):
    h = h.lstrip('#')
    return RGBColor(int(h[0:2],16), int(h[2:4],16), int(h[4:6],16))

prs = Presentation()
prs.slide_width  = Inches(13.333)
prs.slide_height = Inches(7.5)
blank = prs.slide_layouts[6]

def add_rect(slide, x, y, w, h, fill_rgb, alpha=None):
    shape = slide.shapes.add_shape(1, Inches(x), Inches(y), Inches(w), Inches(h))
    shape.line.fill.background()
    shape.fill.solid()
    shape.fill.fore_color.rgb = fill_rgb
    return shape

def add_text(slide, text, x, y, w, h, size=18, bold=False, color=DARK_TEXT,
             align=PP_ALIGN.LEFT, wrap=True, italic=False, valign=MSO_ANCHOR.TOP):
    tb = slide.shapes.add_textbox(Inches(x), Inches(y), Inches(w), Inches(h))
    tf = tb.text_frame
    tf.word_wrap = wrap
    tf.vertical_anchor = valign
    tf.margin_left = Pt(2)
    tf.margin_right = Pt(2)
    tf.margin_top = Pt(2)
    tf.margin_bottom = Pt(2)
    p = tf.paragraphs[0]
    p.alignment = align
    run = p.add_run()
    run.text = text
    run.font.size = Pt(size)
    run.font.bold = bold
    run.font.italic = italic
    run.font.color.rgb = color
    return tb

def add_bullet_box(slide, items, x, y, w, h, size=15, bullet_color=TEAL_MID, text_color=DARK_TEXT, spacing=1.2):
    from pptx.oxml.ns import qn
    from lxml import etree
    tb = slide.shapes.add_textbox(Inches(x), Inches(y), Inches(w), Inches(h))
    tf = tb.text_frame
    tf.word_wrap = True
    tf.margin_left = Pt(4)
    tf.margin_right = Pt(4)
    tf.margin_top = Pt(2)
    tf.margin_bottom = Pt(2)
    for i, item in enumerate(items):
        if i == 0:
            p = tf.paragraphs[0]
        else:
            p = tf.add_paragraph()
        p.alignment = PP_ALIGN.LEFT
        p.space_before = Pt(4)
        run = p.add_run()
        run.text = f"• {item}"
        run.font.size = Pt(size)
        run.font.color.rgb = text_color
    return tb

def download_image(url):
    try:
        r = requests.get(url, timeout=15)
        if r.status_code == 200:
            return BytesIO(r.content)
    except:
        pass
    return None

def add_image_from_url(slide, url, x, y, w, h):
    img_data = download_image(url)
    if img_data:
        slide.shapes.add_picture(img_data, Inches(x), Inches(y), Inches(w), Inches(h))
        return True
    return False

# ─────────────────────────────────────────────────────────────────────────────
# SLIDE 1 — TITLE SLIDE
# ─────────────────────────────────────────────────────────────────────────────
slide = prs.slides.add_slide(blank)

# Full background
add_rect(slide, 0, 0, 13.333, 7.5, TEAL_DARK)
# Lighter accent band
add_rect(slide, 0, 2.5, 13.333, 3.2, TEAL_MID)
# Bottom strip
add_rect(slide, 0, 6.5, 13.333, 1.0, hex_to_rgb('#004D5B'))

# Title
add_text(slide, "INVESTIGATION OF THYROID", 0.5, 0.3, 12.3, 1.4,
         size=42, bold=True, color=WHITE, align=PP_ALIGN.CENTER)
add_text(slide, "A Comprehensive Guide for MBBS Students", 0.5, 1.6, 12.3, 0.7,
         size=22, color=GOLD, align=PP_ALIGN.CENTER, italic=True)
# Divider line shape
shape = slide.shapes.add_shape(1, Inches(3.5), Inches(2.35), Inches(6.3), Inches(0.05))
shape.fill.solid(); shape.fill.fore_color.rgb = GOLD
shape.line.fill.background()

# Content area text
add_text(slide, "Topics Covered:", 1.0, 2.7, 11.3, 0.5, size=18, bold=True, color=WHITE, align=PP_ALIGN.CENTER)
topics = "Thyroid Physiology  •  Biochemical Tests (TSH, T3, T4)  •  Antibody Tests\nImaging (USG, Scintigraphy, CT/MRI)  •  FNAC  •  Clinical Interpretation"
add_text(slide, topics, 1.0, 3.2, 11.3, 1.2, size=16, color=TEAL_LIGHT, align=PP_ALIGN.CENTER)

add_text(slide, "Based on Scott-Brown's Otorhinolaryngology & Pye's Surgical Handicraft", 0.5, 6.6, 12.3, 0.6,
         size=12, color=GOLD, align=PP_ALIGN.CENTER, italic=True)

# ─────────────────────────────────────────────────────────────────────────────
# SLIDE 2 — THYROID PHYSIOLOGY & HPT AXIS
# ─────────────────────────────────────────────────────────────────────────────
slide = prs.slides.add_slide(blank)
add_rect(slide, 0, 0, 13.333, 7.5, LIGHT_GRAY)
add_rect(slide, 0, 0, 13.333, 1.1, TEAL_DARK)
add_text(slide, "THYROID PHYSIOLOGY — HPT Axis & Hormone Synthesis", 0.3, 0.15, 12.7, 0.8,
         size=26, bold=True, color=WHITE, align=PP_ALIGN.LEFT)

# Left column
add_rect(slide, 0.3, 1.25, 5.8, 5.9, WHITE)
add_text(slide, "Hypothalamic-Pituitary-Thyroid (HPT) Axis", 0.4, 1.3, 5.6, 0.5,
         size=16, bold=True, color=TEAL_DARK)
hpt_points = [
    "Hypothalamus → TRH (Thyrotropin-Releasing Hormone)",
    "Anterior Pituitary → TSH (Thyroid-Stimulating Hormone)",
    "Thyroid gland → T3 (Triiodothyronine) + T4 (Thyroxine)",
    "Negative feedback: T3/T4 inhibit TRH & TSH",
    "TSH shows log-linear inverse relation to FT4",
    "TSH is the MOST SENSITIVE test for thyroid dysfunction"
]
add_bullet_box(slide, hpt_points, 0.4, 1.85, 5.6, 3.5, size=14)

add_text(slide, "Normal Reference Ranges", 0.4, 5.4, 5.6, 0.4, size=15, bold=True, color=TEAL_DARK)
add_bullet_box(slide, [
    "TSH: 0.4 – 4.5 mIU/L",
    "Free T4 (FT4): 9 – 25 pmol/L",
    "Free T3 (FT3): 3.5 – 7.8 pmol/L",
    "Total T4: 60 – 160 nmol/L",
    "Total T3: 1.2 – 2.9 nmol/L"
], 0.4, 5.85, 5.6, 1.3, size=13, text_color=DARK_TEXT)

# Right column — image
add_rect(slide, 6.4, 1.25, 6.6, 5.9, WHITE)
add_text(slide, "HPT Axis — Normal vs Critical Illness", 6.5, 1.3, 6.4, 0.5,
         size=15, bold=True, color=TEAL_DARK)
added = add_image_from_url(slide,
    "https://cdn.orris.care/cdss_images/pmc_clinical_VQA_00f638808512b7f8be8d91134e573dbda3092b285ba987b05f18a41a9e261bd6.jpg",
    6.5, 1.85, 6.2, 5.0)
if not added:
    add_text(slide, "[HPT Axis Diagram]", 6.5, 1.85, 6.2, 5.0, size=14, color=TEAL_MID, align=PP_ALIGN.CENTER)

# ─────────────────────────────────────────────────────────────────────────────
# SLIDE 3 — TSH: THE FIRST-LINE TEST
# ─────────────────────────────────────────────────────────────────────────────
slide = prs.slides.add_slide(blank)
add_rect(slide, 0, 0, 13.333, 7.5, LIGHT_GRAY)
add_rect(slide, 0, 0, 13.333, 1.1, TEAL_DARK)
add_text(slide, "TSH — The First-Line Test for Thyroid Dysfunction", 0.3, 0.15, 12.7, 0.8,
         size=26, bold=True, color=WHITE)

# TSH box
add_rect(slide, 0.3, 1.25, 8.0, 5.9, WHITE)
add_text(slide, "Why TSH is the Best Screening Test", 0.5, 1.3, 7.6, 0.5, size=16, bold=True, color=TEAL_DARK)
add_bullet_box(slide, [
    "Sandwich immunoassay using two monoclonal antibodies",
    "Detects TSH levels as low as 0.01 mIU/L (3rd generation)",
    "Log-linear inverse relationship with FT4 → highly sensitive",
    "Best single test to detect primary thyroid dysfunction",
    "TSH alone sufficient as first-line; measure FT4 only if TSH abnormal"
], 0.5, 1.85, 7.6, 2.0, size=14)

add_text(slide, "Factors That Affect TSH Levels (Box 60.1)", 0.5, 3.9, 7.6, 0.45, size=15, bold=True, color=TEAL_DARK)
add_bullet_box(slide, [
    "Inversely proportional to FT3/FT4 levels",
    "Non-thyroidal illness & psychiatric disorders → TSH ↓",
    "Pregnancy (1st trimester): hCG effect → TSH ↓",
    "Pituitary/hypothalamic disease → TSH ↓",
    "Drugs: dopamine, somatostatin, high-dose glucocorticoids → TSH ↓",
    "Assay artefacts: heterophilic antibody interference"
], 0.5, 4.4, 7.6, 2.5, size=13)

# Side box
add_rect(slide, 8.6, 1.25, 4.4, 2.8, TEAL_MID)
add_text(slide, "TSH Interpretation", 8.7, 1.3, 4.2, 0.45, size=15, bold=True, color=WHITE)
interp = [
    ("↑ TSH + ↓ FT4", "Primary Hypothyroidism"),
    ("↑ TSH + Normal FT4", "Subclinical Hypothyroidism"),
    ("↓ TSH + ↑ FT4", "Primary Hyperthyroidism"),
    ("↓ TSH + Normal FT4", "Subclinical Hyperthyroidism"),
    ("↓ TSH + ↓ FT4", "Secondary Hypothyroidism"),
]
y = 1.85
for lab, dx in interp:
    add_text(slide, f"• {lab}:", 8.7, y, 2.1, 0.38, size=11.5, bold=True, color=WHITE)
    add_text(slide, dx, 10.7, y, 2.2, 0.38, size=11.5, color=WHITE)
    y += 0.42

add_rect(slide, 8.6, 4.25, 4.4, 2.9, hex_to_rgb('#E8F8FB'))
add_text(slide, "Key Clinical Points", 8.7, 4.3, 4.2, 0.45, size=14, bold=True, color=TEAL_DARK)
add_bullet_box(slide, [
    "Measure TSH 2 months after any dose change",
    "Annual TSH monitoring once stable",
    "In secondary hypothyroidism: use FT4 (not TSH) to monitor",
    "Target FT4: upper third of reference range"
], 8.7, 4.8, 4.2, 2.2, size=12)

# ─────────────────────────────────────────────────────────────────────────────
# SLIDE 4 — FT3 & FT4 MEASUREMENTS
# ─────────────────────────────────────────────────────────────────────────────
slide = prs.slides.add_slide(blank)
add_rect(slide, 0, 0, 13.333, 7.5, LIGHT_GRAY)
add_rect(slide, 0, 0, 13.333, 1.1, TEAL_DARK)
add_text(slide, "Measurement of Free T3 & Free T4", 0.3, 0.15, 12.7, 0.8,
         size=26, bold=True, color=WHITE)

# Left box — FT4
add_rect(slide, 0.3, 1.25, 6.0, 5.9, WHITE)
add_text(slide, "Free T4 (FT4)", 0.5, 1.3, 5.6, 0.5, size=18, bold=True, color=TEAL_DARK)
add_bullet_box(slide, [
    "Over 99% of T3 & T4 is bound (to TBG, albumin, pre-albumin)",
    "Only FREE fraction is biologically active",
    "Measured by immunoassay — eliminates binding protein artefacts",
    "Primary test when TSH is abnormal",
    "Used to monitor levothyroxine in secondary hypothyroidism",
    "Anomalous results if inconsistent with TSH → measure TOTAL T4"
], 0.5, 1.85, 5.6, 2.8, size=14)

add_text(slide, "Factors Affecting FT3/FT4 (Box 60.2)", 0.5, 4.75, 5.6, 0.45, size=14, bold=True, color=TEAL_DARK)
add_bullet_box(slide, [
    "Non-thyroidal illness → ↓ FT3 (sick euthyroid syndrome)",
    "NSAIDs, furosemide, phenytoin, carbamazepine, heparin",
    "Oestrogens → ↑ TBG → ↑ total T4 (but FT4 normal)"
], 0.5, 5.25, 5.6, 1.8, size=13)

# Right box — FT3
add_rect(slide, 6.6, 1.25, 6.4, 5.9, WHITE)
add_text(slide, "Free T3 (FT3) — When to Measure", 6.8, 1.3, 6.0, 0.5, size=18, bold=True, color=TEAL_DARK)

add_rect(slide, 6.7, 1.9, 6.1, 0.5, TEAL_MID)
add_text(slide, "INDICATED in:", 6.8, 1.92, 5.8, 0.4, size=14, bold=True, color=WHITE)
add_bullet_box(slide, [
    "T3-toxicosis: TSH suppressed + FT4 still NORMAL (earliest thyrotoxicosis)",
    "Patient on propylthiouracil (PTU) — impairs T4 → T3 conversion",
    "Patient on amiodarone — impairs T4 → T3 conversion",
    "Confirms overt thyrotoxicosis when FT4 borderline"
], 6.8, 2.45, 6.0, 2.1, size=14)

add_rect(slide, 6.7, 4.6, 6.1, 0.5, RGBColor(0xC0, 0x39, 0x2B))
add_text(slide, "NOT INDICATED in:", 6.8, 4.62, 5.8, 0.4, size=14, bold=True, color=WHITE)
add_bullet_box(slide, [
    "Diagnosis of hypothyroidism",
    "FT3 remains normal until very late in hypothyroidism",
    "Despite ↓ FT4 and ↑ TSH, FT3 can still be normal"
], 6.8, 5.15, 6.0, 1.8, size=14, text_color=RGBColor(0x7B, 0x24, 0x1C))

# ─────────────────────────────────────────────────────────────────────────────
# SLIDE 5 — THYROID ANTIBODIES
# ─────────────────────────────────────────────────────────────────────────────
slide = prs.slides.add_slide(blank)
add_rect(slide, 0, 0, 13.333, 7.5, LIGHT_GRAY)
add_rect(slide, 0, 0, 13.333, 1.1, TEAL_DARK)
add_text(slide, "Thyroid Antibody Tests", 0.3, 0.15, 12.7, 0.8, size=26, bold=True, color=WHITE)

# Three columns
col_data = [
    {
        "title": "Anti-TPO Antibodies",
        "subtitle": "(Anti-Thyroid Peroxidase)",
        "points": [
            "Most sensitive antibody test",
            "Positive in >90% Hashimoto's thyroiditis",
            "Positive in 70-80% Graves' disease",
            "Indicates autoimmune thyroid disease",
            "High titre → risk of hypothyroidism",
            "Used in subclinical hypothyroidism workup"
        ],
        "color": TEAL_DARK
    },
    {
        "title": "Anti-Tg Antibodies",
        "subtitle": "(Anti-Thyroglobulin)",
        "points": [
            "Less specific than Anti-TPO",
            "Positive in Hashimoto's thyroiditis",
            "Interferes with thyroglobulin measurement",
            "Important in differentiated thyroid cancer follow-up",
            "High titres can give false-low Tg levels",
            "Order alongside Tg in cancer surveillance"
        ],
        "color": TEAL_MID
    },
    {
        "title": "TRAb / TSH-RAb",
        "subtitle": "(TSH Receptor Antibodies)",
        "points": [
            "Pathognomonic for Graves' disease",
            "Stimulating type (TSAb) → hyperthyroidism",
            "Blocking type → hypothyroidism (rare)",
            "Predicts neonatal thyrotoxicosis in pregnancy",
            "Guides decision on anti-thyroid drug withdrawal",
            "High titre = relapse risk after stopping ATD"
        ],
        "color": hex_to_rgb('#2E86AB')
    }
]

x_starts = [0.3, 4.6, 8.9]
for i, col in enumerate(col_data):
    x = x_starts[i]
    add_rect(slide, x, 1.25, 4.0, 5.9, WHITE)
    add_rect(slide, x, 1.25, 4.0, 0.8, col["color"])
    add_text(slide, col["title"], x+0.15, 1.3, 3.7, 0.42, size=16, bold=True, color=WHITE)
    add_text(slide, col["subtitle"], x+0.15, 1.72, 3.7, 0.28, size=11, color=TEAL_LIGHT, italic=True)
    add_bullet_box(slide, col["points"], x+0.15, 2.15, 3.7, 4.7, size=13)

# ─────────────────────────────────────────────────────────────────────────────
# SLIDE 6 — OTHER BIOCHEMICAL TESTS
# ─────────────────────────────────────────────────────────────────────────────
slide = prs.slides.add_slide(blank)
add_rect(slide, 0, 0, 13.333, 7.5, LIGHT_GRAY)
add_rect(slide, 0, 0, 13.333, 1.1, TEAL_DARK)
add_text(slide, "Other Biochemical & Special Tests", 0.3, 0.15, 12.7, 0.8, size=26, bold=True, color=WHITE)

# Row 1
boxes = [
    {"title": "Serum Thyroglobulin (Tg)", "pts": [
        "Produced only by thyroid follicular cells",
        "NOT useful for initial diagnosis",
        "Tumour marker in differentiated thyroid ca",
        "Post-thyroidectomy: undetectable Tg = remission",
        "Rising Tg → recurrence/metastasis",
        "Interfered by anti-Tg antibodies"
    ]},
    {"title": "Serum Calcitonin", "pts": [
        "Produced by parafollicular C-cells",
        "Elevated in medullary thyroid carcinoma (MTC)",
        "Useful for diagnosis & post-op monitoring of MTC",
        "Screen in MEN 2A/2B families",
        "Pentagastrin stimulation test used historically"
    ]},
    {"title": "TRH Stimulation Test", "pts": [
        "IV TRH given → TSH measured at 20 & 60 min",
        "Normal: TSH rises ≥2 mIU/L",
        "Blunted/absent rise → hyperthyroidism",
        "Exaggerated rise → primary hypothyroidism",
        "Largely replaced by sensitive TSH assays",
        "Still used when TSH is borderline"
    ]},
    {"title": "Other Biochemical Markers", "pts": [
        "Serum calcium: ↑ in 15-20% thyrotoxicosis",
        "Liver enzymes: may be elevated in thyrotoxicosis",
        "Cholesterol: ↑ in hypothyroidism",
        "Anaemia: may occur in both hypo & hyperthyroidism",
        "CPK: elevated in hypothyroid myopathy",
        "Prolactin: elevated in severe hypothyroidism"
    ]},
]

positions = [(0.3, 1.25), (3.55, 1.25), (6.8, 1.25), (10.05, 1.25)]
for i, (box, (x, y)) in enumerate(zip(boxes, positions)):
    add_rect(slide, x, y, 3.0, 5.9, WHITE)
    add_rect(slide, x, y, 3.0, 0.55, TEAL_MID)
    add_text(slide, box["title"], x+0.1, y+0.05, 2.8, 0.45, size=13, bold=True, color=WHITE)
    add_bullet_box(slide, box["pts"], x+0.1, y+0.65, 2.8, 5.0, size=12)

# ─────────────────────────────────────────────────────────────────────────────
# SLIDE 7 — THYROID ULTRASOUND
# ─────────────────────────────────────────────────────────────────────────────
slide = prs.slides.add_slide(blank)
add_rect(slide, 0, 0, 13.333, 7.5, LIGHT_GRAY)
add_rect(slide, 0, 0, 13.333, 1.1, TEAL_DARK)
add_text(slide, "Thyroid Ultrasonography (USG)", 0.3, 0.15, 12.7, 0.8, size=26, bold=True, color=WHITE)

add_rect(slide, 0.3, 1.25, 5.8, 5.9, WHITE)
add_text(slide, "Technique & Clinical Uses", 0.5, 1.3, 5.4, 0.5, size=16, bold=True, color=TEAL_DARK)
add_bullet_box(slide, [
    "High-frequency (7.5–15 MHz) B-mode imaging",
    "FIRST-LINE imaging for thyroid nodules",
    "Distinguishes solid vs cystic lesions",
    "Detects multifocal disease when only single swelling apparent clinically",
    "Guides FNAC — increases accuracy of biopsy",
    "Assesses vascularity (Doppler): diffuse ↑ flow in Graves' disease",
    "Measures thyroid volume (goitre assessment)"
], 0.5, 1.9, 5.4, 3.4, size=14)

add_text(slide, "TI-RADS Features (Suspicious for Malignancy)", 0.5, 5.35, 5.4, 0.45, size=14, bold=True, color=TEAL_DARK)
add_bullet_box(slide, [
    "Hypoechoic solid nodule",
    "Microcalcifications (punctate echogenic foci)",
    "Irregular/ill-defined margins",
    "Taller-than-wide orientation",
    "Incomplete peripheral rim of calcification"
], 0.5, 5.85, 5.4, 1.5, size=13)

# Right — image
add_rect(slide, 6.4, 1.25, 6.6, 5.9, WHITE)
add_text(slide, "Ultrasound — Thyroid Nodule (TI-RADS 4B)", 6.5, 1.3, 6.3, 0.5,
         size=14, bold=True, color=TEAL_DARK)
add_image_from_url(slide,
    "https://cdn.orris.care/cdss_images/pmc_clinical_VQA_5a9ae0a22ec899ef678f79affb868337f139abbed0676fd858f93a10c19ab3c0.jpg",
    6.5, 1.85, 6.2, 4.9)
add_image_from_url(slide,
    "https://cdn.orris.care/cdss_images/pmc_clinical_VQA_5a9ae0a22ec899ef678f79affb868337f139abbed0676fd858f93a10c19ab3c0.jpg",
    6.5, 1.85, 6.2, 4.9)

# Try primary URL
img1 = download_image("https://cdn.orris.care/cdss_images/pmc_clinical_VQA_5a9ae0a22ec899ef678f78effb868337f139abbed0676fd858f93a10c19ab3c0.jpg")
if img1:
    slide.shapes.add_picture(img1, Inches(6.5), Inches(1.85), Inches(6.2), Inches(4.9))
else:
    add_text(slide, "[Thyroid Ultrasound Image]", 6.5, 1.85, 6.2, 4.9, size=14, color=TEAL_MID, align=PP_ALIGN.CENTER)

# ─────────────────────────────────────────────────────────────────────────────
# SLIDE 8 — THYROID SCINTIGRAPHY
# ─────────────────────────────────────────────────────────────────────────────
slide = prs.slides.add_slide(blank)
add_rect(slide, 0, 0, 13.333, 7.5, LIGHT_GRAY)
add_rect(slide, 0, 0, 13.333, 1.1, TEAL_DARK)
add_text(slide, "Thyroid Scintigraphy (Radionuclide Scan)", 0.3, 0.15, 12.7, 0.8,
         size=26, bold=True, color=WHITE)

# Left
add_rect(slide, 0.3, 1.25, 6.2, 5.9, WHITE)
add_text(slide, "Isotopes Used", 0.5, 1.3, 5.8, 0.45, size=16, bold=True, color=TEAL_DARK)
add_bullet_box(slide, [
    "99mTc-Pertechnetate — most common, low radiation, rapid imaging",
    "131I-Radioiodine — functional imaging, also used for therapy",
    "123I — less radiation than 131I, better imaging"
], 0.5, 1.8, 5.8, 1.2, size=14)

add_text(slide, "Information Provided", 0.5, 3.05, 5.8, 0.4, size=15, bold=True, color=TEAL_DARK)
add_bullet_box(slide, [
    "Measures avidity of isotope uptake (gland function)",
    "Pattern of uptake: diffuse / focal / suppressed"
], 0.5, 3.5, 5.8, 0.9, size=14)

add_text(slide, "Hot vs Cold Nodule", 0.5, 4.5, 5.8, 0.45, size=15, bold=True, color=TEAL_DARK)

# Table-like boxes
add_rect(slide, 0.5, 5.0, 2.7, 0.45, TEAL_MID)
add_text(slide, "HOT Nodule", 0.55, 5.02, 2.6, 0.4, size=13, bold=True, color=WHITE, align=PP_ALIGN.CENTER)
add_rect(slide, 3.3, 5.0, 2.9, 0.45, RGBColor(0xC0, 0x39, 0x2B))
add_text(slide, "COLD Nodule", 3.35, 5.02, 2.8, 0.4, size=13, bold=True, color=WHITE, align=PP_ALIGN.CENTER)

add_bullet_box(slide, [
    "↑ tracer uptake",
    "Autonomous function",
    "Toxic adenoma",
    "Almost always BENIGN"
], 0.5, 5.5, 2.7, 1.6, size=12)
add_bullet_box(slide, [
    "↓ tracer uptake",
    "Non-functioning tissue",
    "Cyst, adenoma, carcinoma, thyroiditis",
    "Up to 10% are MALIGNANT"
], 3.3, 5.5, 2.9, 1.6, size=12)

# Right — image
add_rect(slide, 6.8, 1.25, 6.2, 5.9, WHITE)
add_text(slide, "99mTc Pertechnetate Scan — Hot Nodule (Left Lobe)", 6.9, 1.3, 6.0, 0.5,
         size=13, bold=True, color=TEAL_DARK)
img2 = download_image("https://cdn.orris.care/cdss_images/roco_radiology_ROCO_16747_1766646999875.png")
if img2:
    slide.shapes.add_picture(img2, Inches(6.9), Inches(1.85), Inches(5.9), Inches(5.1))
else:
    add_text(slide, "[Thyroid Scintigraphy Scan]", 6.9, 1.85, 5.9, 5.1, size=14, color=TEAL_MID, align=PP_ALIGN.CENTER)

# ─────────────────────────────────────────────────────────────────────────────
# SLIDE 9 — FNAC
# ─────────────────────────────────────────────────────────────────────────────
slide = prs.slides.add_slide(blank)
add_rect(slide, 0, 0, 13.333, 7.5, LIGHT_GRAY)
add_rect(slide, 0, 0, 13.333, 1.1, TEAL_DARK)
add_text(slide, "Fine Needle Aspiration Cytology (FNAC)", 0.3, 0.15, 12.7, 0.8,
         size=26, bold=True, color=WHITE)

add_rect(slide, 0.3, 1.25, 5.8, 5.9, WHITE)
add_text(slide, "Indications & Technique", 0.5, 1.3, 5.4, 0.45, size=16, bold=True, color=TEAL_DARK)
add_bullet_box(slide, [
    "Gold standard to evaluate thyroid nodule for malignancy",
    "Indications: solitary nodule, suspicious USG features, cold nodule on scan",
    "23-25 gauge needle; USG-guided for accuracy",
    "Material smeared, fixed and stained (Pap or H&E)",
    "Sample adequacy: ≥6 groups of follicular cells per slide"
], 0.5, 1.8, 5.4, 2.2, size=14)

add_text(slide, "Bethesda Classification", 0.5, 4.05, 5.4, 0.45, size=15, bold=True, color=TEAL_DARK)
bethesda = [
    ("I", "Non-diagnostic / Unsatisfactory", "Repeat FNAC"),
    ("II", "Benign", "Clinical follow-up"),
    ("III", "Atypia of Undetermined Significance", "Repeat FNAC / molecular"),
    ("IV", "Follicular Neoplasm", "Diagnostic lobectomy"),
    ("V", "Suspicious for Malignancy", "Near-total thyroidectomy"),
    ("VI", "Malignant", "Total thyroidectomy"),
]
y = 4.55
for cat, desc, mgmt in bethesda:
    add_rect(slide, 0.5, y, 0.4, 0.38, TEAL_DARK)
    add_text(slide, cat, 0.5, y+0.01, 0.4, 0.36, size=11, bold=True, color=WHITE, align=PP_ALIGN.CENTER)
    add_text(slide, desc, 0.95, y, 3.0, 0.38, size=11, color=DARK_TEXT)
    add_text(slide, mgmt, 3.98, y, 2.0, 0.38, size=10, color=TEAL_MID, italic=True)
    y += 0.4

# Right — images
add_rect(slide, 6.4, 1.25, 6.6, 5.9, WHITE)
add_text(slide, "USG-Guided FNAC + Cytology", 6.5, 1.3, 6.3, 0.45, size=14, bold=True, color=TEAL_DARK)
img3 = download_image("https://cdn.orris.care/cdss_images/pmc_clinical_VQA_64be58c7c920c7ef8e3955f9bcd00af39833566458ef67badeaa037940faf9ee.jpg")
if img3:
    slide.shapes.add_picture(img3, Inches(6.5), Inches(1.85), Inches(6.2), Inches(2.7))
img4 = download_image("https://cdn.orris.care/cdss_images/Pathology_1760052506580_9aaa2ee8-a930-4ed3-8a86-7ff26ed89543.jpg")
if img4:
    slide.shapes.add_picture(img4, Inches(6.5), Inches(4.65), Inches(6.2), Inches(2.35))

# ─────────────────────────────────────────────────────────────────────────────
# SLIDE 10 — CT, MRI & OTHER IMAGING
# ─────────────────────────────────────────────────────────────────────────────
slide = prs.slides.add_slide(blank)
add_rect(slide, 0, 0, 13.333, 7.5, LIGHT_GRAY)
add_rect(slide, 0, 0, 13.333, 1.1, TEAL_DARK)
add_text(slide, "CT Scan, MRI & Other Investigations", 0.3, 0.15, 12.7, 0.8,
         size=26, bold=True, color=WHITE)

panels = [
    {"title": "CT Scan of Neck", "color": TEAL_DARK, "pts": [
        "Not first-line for thyroid evaluation",
        "Best for: retrosternal goitre extent",
        "Assesses tracheal compression/deviation",
        "Lymph node mapping before surgery",
        "Detects calcification (dystrophic/psammomatous)",
        "Contrast may be delayed if ¹³¹I planned (iodine load)"
    ]},
    {"title": "MRI of Neck", "color": TEAL_MID, "pts": [
        "Superior soft tissue contrast vs CT",
        "No ionizing radiation",
        "Invasive thyroid cancer: vessel/nerve involvement",
        "Better characterization of retrosternal extension",
        "MRI-guided biopsy in difficult locations",
        "Not routine for nodule evaluation"
    ]},
    {"title": "PET-CT (FDG)", "color": hex_to_rgb('#8E44AD'), "pts": [
        "18F-FDG for poorly differentiated thyroid ca",
        "Used when RAI scan negative but Tg rising",
        "Identifies dedifferentiated/aggressive metastases",
        "Incidental thyroid uptake on PET → FNAC recommended",
        "Not routine in initial workup"
    ]},
    {"title": "Chest X-Ray / Barium Swallow", "color": hex_to_rgb('#2E86AB'), "pts": [
        "CXR: tracheal deviation, calcification in goitre",
        "Retrosternal extension on CXR (AP + Lateral)",
        "Barium swallow: oesophageal compression",
        "Useful when advanced imaging not available",
        "Historical role now largely replaced by CT"
    ]},
]

xs = [0.3, 3.55, 6.8, 10.05]
for i, (panel, x) in enumerate(zip(panels, xs)):
    add_rect(slide, x, 1.25, 3.0, 5.9, WHITE)
    add_rect(slide, x, 1.25, 3.0, 0.6, panel["color"])
    add_text(slide, panel["title"], x+0.1, 1.3, 2.8, 0.5, size=14, bold=True, color=WHITE)
    add_bullet_box(slide, panel["pts"], x+0.1, 1.95, 2.8, 5.0, size=12)

# ─────────────────────────────────────────────────────────────────────────────
# SLIDE 11 — CLINICAL APPROACH / ALGORITHM
# ─────────────────────────────────────────────────────────────────────────────
slide = prs.slides.add_slide(blank)
add_rect(slide, 0, 0, 13.333, 7.5, LIGHT_GRAY)
add_rect(slide, 0, 0, 13.333, 1.1, TEAL_DARK)
add_text(slide, "Clinical Approach to Thyroid Investigation", 0.3, 0.15, 12.7, 0.8,
         size=26, bold=True, color=WHITE)

# Algorithm box
add_rect(slide, 0.3, 1.25, 12.7, 5.9, WHITE)
add_text(slide, "STEP-WISE APPROACH", 0.5, 1.35, 12.3, 0.45, size=17, bold=True,
         color=TEAL_DARK, align=PP_ALIGN.CENTER)

steps = [
    ("STEP 1", "History & Physical Examination",
     "Symptoms of hyper/hypothyroidism, goitre, nodule, family history, medications, prior neck radiation"),
    ("STEP 2", "First-Line Biochemical: TSH",
     "Normal TSH → unlikely primary thyroid disease | Abnormal TSH → proceed to Step 3"),
    ("STEP 3", "Second-Line: FT4 ± FT3",
     "FT4 confirms degree of dysfunction | FT3 only if T3-toxicosis suspected or on PTU/amiodarone"),
    ("STEP 4", "Antibody Testing",
     "Autoimmune suspected → Anti-TPO, Anti-Tg, TRAb | Graves' disease: TRAb | Hashimoto: Anti-TPO"),
    ("STEP 5", "Imaging: Ultrasound",
     "All palpable nodules → USG | Characterize nodule (TI-RADS) | Guide FNAC if needed"),
    ("STEP 6", "Scintigraphy / FNAC",
     "Thyrotoxicosis with nodule → Scan first | Cold nodule → FNAC | TI-RADS 4/5 → FNAC regardless"),
    ("STEP 7", "Advanced Imaging / Molecular Testing",
     "CT/MRI for retrosternal goitre, malignant invasion | Bethesda III-IV: consider molecular markers"),
]

y = 1.9
colors = [TEAL_DARK, TEAL_MID, hex_to_rgb('#2E86AB'), hex_to_rgb('#8E44AD'),
          hex_to_rgb('#16A085'), hex_to_rgb('#D35400'), hex_to_rgb('#C0392B')]
for i, (step, title, detail) in enumerate(steps):
    add_rect(slide, 0.5, y, 1.1, 0.62, colors[i])
    add_text(slide, step, 0.52, y+0.05, 1.06, 0.52, size=11, bold=True, color=WHITE, align=PP_ALIGN.CENTER)
    add_rect(slide, 1.65, y, 3.3, 0.62, RGBColor(0xF0, 0xF8, 0xFA))
    add_text(slide, title, 1.72, y+0.05, 3.1, 0.52, size=12, bold=True, color=TEAL_DARK)
    add_text(slide, detail, 5.1, y+0.07, 7.8, 0.52, size=11.5, color=DARK_TEXT)
    y += 0.73

# ─────────────────────────────────────────────────────────────────────────────
# SLIDE 12 — SPECIAL SITUATIONS
# ─────────────────────────────────────────────────────────────────────────────
slide = prs.slides.add_slide(blank)
add_rect(slide, 0, 0, 13.333, 7.5, LIGHT_GRAY)
add_rect(slide, 0, 0, 13.333, 1.1, TEAL_DARK)
add_text(slide, "Special Clinical Situations", 0.3, 0.15, 12.7, 0.8, size=26, bold=True, color=WHITE)

situations = [
    {"title": "Pregnancy", "color": hex_to_rgb('#16A085'), "pts": [
        "Use trimester-specific TSH ranges",
        "1st trimester TSH: 0.1–2.5 mIU/L",
        "2nd trimester TSH: 0.2–3.0 mIU/L",
        "3rd trimester TSH: 0.3–3.0 mIU/L",
        "hCG stimulates thyroid → lower TSH in 1st trimester",
        "Screen all women planning pregnancy",
        "High TRAb in mother → neonatal thyrotoxicosis risk"
    ]},
    {"title": "Non-Thyroidal Illness (Sick Euthyroid)", "color": hex_to_rgb('#D35400'), "pts": [
        "Systemic illness → ↓ T3 (reduced T4→T3 conversion)",
        "FT4 may be low or normal",
        "TSH typically low but may be inappropriately normal",
        "Do NOT treat unless overt dysfunction confirmed",
        "Repeat TFTs after recovery from acute illness",
        "Low rT3 helps distinguish from true hypothyroidism"
    ]},
    {"title": "Thyroid Cancer Monitoring", "color": hex_to_rgb('#8E44AD'), "pts": [
        "Post-thyroidectomy: Thyroglobulin (Tg) as tumour marker",
        "Tg undetectable = remission; rising = recurrence",
        "Anti-Tg antibodies interfere → monitor trends",
        "TSH suppression therapy in high-risk DTC",
        "131I whole body scan after withdrawal or rhTSH",
        "Annual neck USG for surveillance"
    ]},
    {"title": "Subclinical Thyroid Disease", "color": hex_to_rgb('#2C3E50'), "pts": [
        "Subclinical Hypothyroidism: ↑TSH + normal FT4",
        "Treat if TSH >10, symptoms, or pregnancy",
        "Subclinical Hyperthyroidism: ↓TSH + normal FT3/FT4",
        "Treat if TSH <0.1, cardiac disease, osteoporosis risk",
        "Repeat TFTs in 3–6 months before treating",
        "Identify underlying cause before therapy"
    ]},
]

xs = [0.3, 3.55, 6.8, 10.05]
for panel, x in zip(situations, xs):
    add_rect(slide, x, 1.25, 3.0, 5.9, WHITE)
    add_rect(slide, x, 1.25, 3.0, 0.6, panel["color"])
    add_text(slide, panel["title"], x+0.1, 1.3, 2.8, 0.5, size=13, bold=True, color=WHITE)
    add_bullet_box(slide, panel["pts"], x+0.1, 1.95, 2.8, 5.0, size=12)

# ─────────────────────────────────────────────────────────────────────────────
# SLIDE 13 — SUMMARY TABLE
# ─────────────────────────────────────────────────────────────────────────────
slide = prs.slides.add_slide(blank)
add_rect(slide, 0, 0, 13.333, 7.5, LIGHT_GRAY)
add_rect(slide, 0, 0, 13.333, 1.1, TEAL_DARK)
add_text(slide, "Summary: Investigation of Thyroid at a Glance", 0.3, 0.15, 12.7, 0.8,
         size=26, bold=True, color=WHITE)

add_rect(slide, 0.3, 1.25, 12.7, 5.9, WHITE)

# Table header
headers = ["Investigation", "What It Measures", "Key Use", "MBBS Pearl"]
col_ws = [2.5, 3.2, 3.5, 3.2]
xs = [0.4, 2.95, 6.2, 9.75]
header_y = 1.35
for hdr, x, w in zip(headers, xs, col_ws):
    add_rect(slide, x, header_y, w-0.05, 0.45, TEAL_DARK)
    add_text(slide, hdr, x+0.05, header_y+0.04, w-0.15, 0.37, size=13, bold=True,
             color=WHITE, align=PP_ALIGN.CENTER)

rows = [
    ("TSH", "Pituitary response to thyroid hormones", "Best single screening test", "First test to order"),
    ("Free T4", "Active thyroxine level", "Confirm & quantify dysfunction", "Measure if TSH abnormal"),
    ("Free T3", "Active triiodothyronine", "Diagnose T3-toxicosis", "Not for hypothyroidism Dx"),
    ("Anti-TPO", "Thyroid autoimmunity", "Hashimoto's / Graves' diagnosis", "Most sensitive Ab test"),
    ("TRAb", "TSH receptor antibodies", "Confirm Graves' disease", "Neonatal risk predictor"),
    ("Thyroglobulin", "Residual thyroid tissue", "Post-thyroid ca monitoring", "Tumour marker only"),
    ("USG", "Nodule morphology", "First imaging for nodules", "Guide FNAC"),
    ("Scintigraphy", "Uptake & function", "Hot vs cold nodule", "Cold = up to 10% malignant"),
    ("FNAC", "Cytology", "Definitive nodule assessment", "Bethesda system"),
    ("CT/MRI", "Anatomy & extent", "Retrosternal/invasive disease", "Not routine for nodules"),
]

row_colors = [LIGHT_GRAY, WHITE]
y = 1.85
for i, row in enumerate(rows):
    bg = row_colors[i % 2]
    for j, (cell, x, w) in enumerate(zip(row, xs, col_ws)):
        add_rect(slide, x, y, w-0.05, 0.48, bg)
        add_text(slide, cell, x+0.05, y+0.04, w-0.15, 0.40,
                 size=11.5, bold=(j==0), color=DARK_TEXT if j>0 else TEAL_DARK)
    y += 0.49

# ─────────────────────────────────────────────────────────────────────────────
# SLIDE 14 — THANK YOU / REFERENCES
# ─────────────────────────────────────────────────────────────────────────────
slide = prs.slides.add_slide(blank)
add_rect(slide, 0, 0, 13.333, 7.5, TEAL_DARK)
add_rect(slide, 0, 2.6, 13.333, 2.5, TEAL_MID)
add_rect(slide, 0, 6.5, 13.333, 1.0, hex_to_rgb('#004D5B'))

add_text(slide, "Thank You", 0.5, 0.5, 12.3, 1.4, size=52, bold=True,
         color=WHITE, align=PP_ALIGN.CENTER)
add_text(slide, "Key Takeaways", 0.5, 2.7, 12.3, 0.5, size=20, bold=True,
         color=WHITE, align=PP_ALIGN.CENTER)
takeaways = "TSH is the most sensitive first-line test  •  Always confirm abnormal TSH with FT4  •  FT3 only for T3-toxicosis\n" \
            "Anti-TPO for autoimmune thyroid disease  •  USG is first-line imaging  •  FNAC = Bethesda system\n" \
            "Cold nodule: up to 10% malignancy risk  •  Tg is a tumour marker post-thyroidectomy"
add_text(slide, takeaways, 0.5, 3.25, 12.3, 1.3, size=15, color=WHITE, align=PP_ALIGN.CENTER)

add_text(slide, "References", 0.5, 4.75, 12.3, 0.4, size=16, bold=True,
         color=GOLD, align=PP_ALIGN.LEFT)
refs = [
    "1. Scott-Brown's Otorhinolaryngology Head & Neck Surgery, Vol 1 — Chapter 60: Investigation of Thyroid",
    "2. Pye's Surgical Handicraft, 22nd Ed — Chapter 22: Thyroid",
    "3. Harper's Illustrated Biochemistry, 32nd Ed — Thyroid Function Tests",
    "4. Goodman & Gilman's Pharmacological Basis of Therapeutics — Thyroid & Anti-thyroid Drugs",
]
y = 5.25
for ref in refs:
    add_text(slide, ref, 0.6, y, 12.0, 0.35, size=11, color=TEAL_LIGHT, italic=True)
    y += 0.35

# ─────────────────────────────────────────────────────────────────────────────
# SAVE
# ─────────────────────────────────────────────────────────────────────────────
out_path = "/tmp/workspace/thyroid-pptx/Investigation_of_Thyroid_MBBS.pptx"
prs.save(out_path)
print(f"Saved: {out_path}")
print(f"Slides: {len(prs.slides)}")
cd /tmp/workspace/thyroid-pptx && python build_pptx.py 2>&1
~/thyroid-pptx/build_pptx.py
Successfully replaced 1 instance(s) of the string in '/tmp/workspace/thyroid-pptx/build_pptx.py'
cd /tmp/workspace/thyroid-pptx && python build_pptx.py 2>&1
python -c " from pptx import Presentation prs = Presentation('/tmp/workspace/thyroid-pptx/Investigation_of_Thyroid_MBBS.pptx') for i, slide in enumerate(prs.slides, 1): texts = [] for shape in slide.shapes: if shape.has_text_frame: t = shape.text_frame.text.strip() if t and len(t) > 3: texts.append(t[:60]) print(f'Slide {i}: {texts[0] if texts else \"(no text)\"}') import os size = os.path.getsize('/tmp/workspace/thyroid-pptx/Investigation_of_Thyroid_MBBS.pptx') print(f'File size: {size/1024:.1f} KB') "
Investigation of Thyroid MBBS
Presentation · PPTX
What's Inside (14 Slides)
| # | Slide Title | Content Highlights |
|---|---|---|
| 1 | Title Slide | Professional teal/gold design |
| 2 | Thyroid Physiology — HPT Axis | TRH→TSH→T3/T4 feedback loop, normal reference ranges, HPT axis diagram |
| 3 | TSH — First-Line Test | Immunoassay principles, factors affecting TSH, interpretation table (↑/↓ TSH + FT4 combos) |
| 4 | Free T3 & Free T4 | Protein binding concept, when to measure FT3 (T3-toxicosis, PTU, amiodarone), drugs affecting levels |
| 5 | Thyroid Antibodies | Anti-TPO, Anti-Tg, TRAb — role in Graves', Hashimoto's, neonatal risk |
| 6 | Other Biochemical Tests | Thyroglobulin, Calcitonin (MTC), TRH stimulation test, misc markers (cholesterol, CPK) |
| 7 | Ultrasonography | TI-RADS features, solid vs cystic, USG-guided FNAC - with ultrasound nodule image |
| 8 | Scintigraphy | 99mTc vs 131I, hot vs cold nodule table, malignancy risk - with actual scan image |
| 9 | FNAC | Bethesda 6-category classification with management per category - with needle biopsy images |
| 10 | CT / MRI / PET-CT | Role of each modality, retrosternal goitre, contrast iodine consideration |
| 11 | Clinical Algorithm | 7-step stepwise approach from history to advanced imaging |
| 12 | Special Situations | Pregnancy TSH ranges, sick euthyroid syndrome, cancer monitoring, subclinical disease |
| 13 | Summary Table | All investigations at a glance — what it measures, key use, MBBS pearl |
| 14 | Thank You + References | Key takeaways + textbook references (Scott-Brown's, Pye's, Harper's, Goodman & Gilman's) |