
nerve supply of Lowe rlimb
nerve supply lower limb lumbar sacral plexus diagram
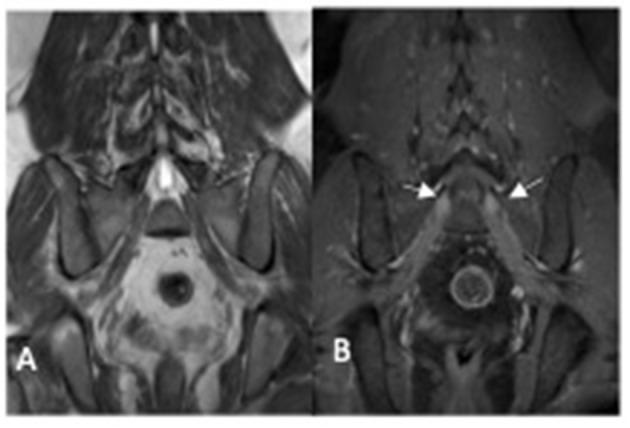
This diagnostic image pair displays coronal T1-weighted MRI scans of the lumbosacral plexus. Image A is a non-contrast study, and Image B is a post-contrast study. The anatomical region focuses on the lower lumbar spine, sacrum, and pelvis. In image A, the exiting sacral nerve roots appear as relatively hypo-intense (darker) structures compared to the surrounding pelvic musculature and fat. In image B, the same nerve roots (indicated by white arrows) demonstrate marked gadolinium enhancement and visible hypertrophy. This combination of nerve root enlargement and post-contrast enhancement is a key radiological finding in chronic inflammatory or hereditary polyneuropathies, such as Charcot-Marie-Tooth disease. The images clearly illustrate the contrast between normal spinal canal structures and pathologic lumbosacral plexus involvement, emphasizing the diagnostic utility of post-contrast T1 sequences in identifying breakdown of the blood-nerve barrier or inflammatory infiltration in neural tissues.
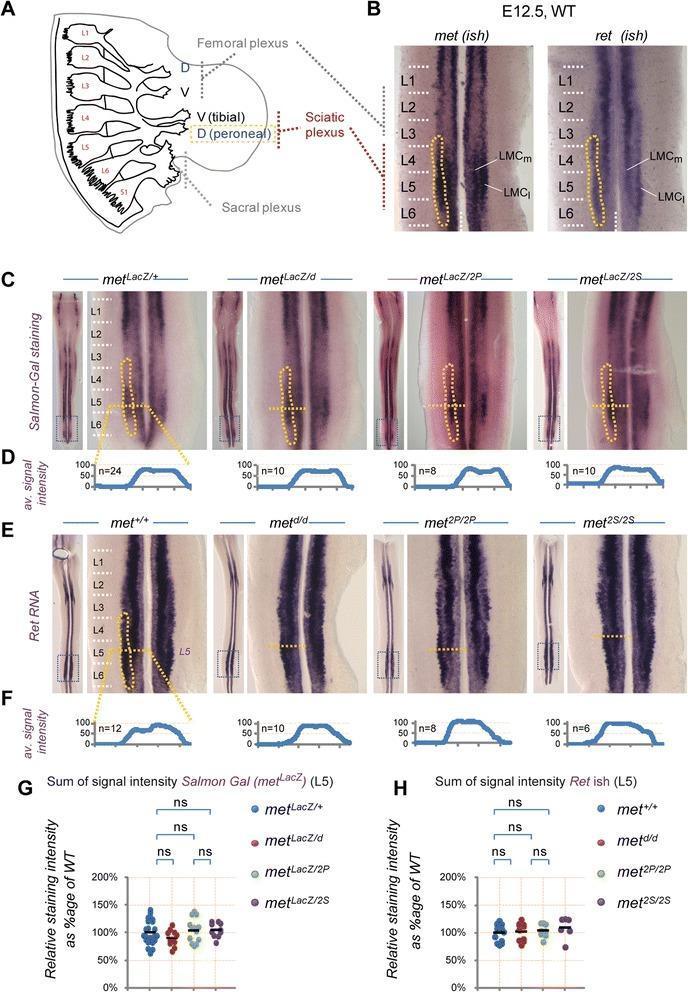
This composite educational graphic illustrates the molecular and anatomical patterning of lumbar motor neurons (MNs) in mouse embryos. Panel A is an anatomical diagram showing a lateral view of the lumbar spinal nerves (L1-L6) and the formation of the femoral, sciatic, and sacral plexuses. It specifically details the tibial (ventral) and peroneal (dorsal) nerve origins from the sciatic plexus. Panels B, C, and E display experimental results from In Situ Hybridization (ISH) and Salmon-Gal staining, visualizing the expression of Met and Ret markers in E12.5 spinal cords across wild-type (WT) and various Met-signaling mutants (metLacZ/d, met2P/2P, met2S/2S). These panels focus on the lateral motor column (LMC) pools, particularly peroneal MNs located between segments L3 and L6. Panels D and F provide quantitative average signal intensity plots for these expression patterns at the L5 level. Panels G and H contain statistical scatter plots comparing the sum of signal intensities between genotypes, demonstrating that despite signaling mutations, total MN populations remain comparable at this developmental stage (E12.5) before the onset of muscle-dependent cell death.
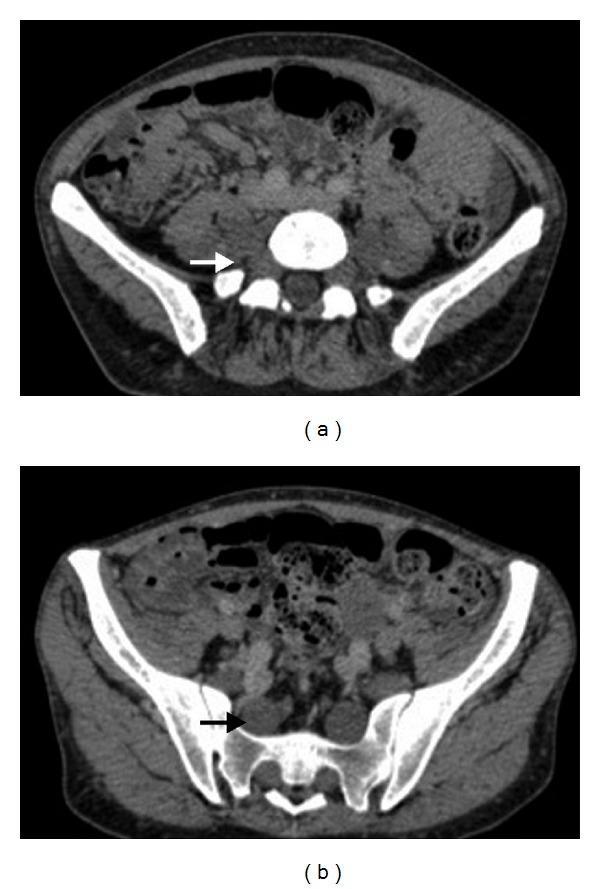
Two axial CT images of the pelvic and lower lumbar region in a 34-year-old patient demonstrate classic manifestations of Neurofibromatosis Type 1 (NF1). The images show bilateral, multi-segmental plexiform neurofibromas involving the lumbar and sacral nerve roots. These neurofibromas appear as irregular, ill-defined masses of soft tissue density that follow the course of the lumbosacral plexus. Key findings include marked enlargement and thickening of the nerve roots as they exit the neural foramina, with subsequent infiltration and displacement of adjacent soft tissues. Arrows highlight specific areas of nerve root expansion and the loss of normal perineural fat planes. The bony anatomy of the sacrum and iliac wings is visible, providing anatomical landmarks for the location of these peripheral nervous system tumors. The presentation is highly characteristic of the 'bag of worms' morphology associated with plexiform neurofibromas in the setting of NF1.
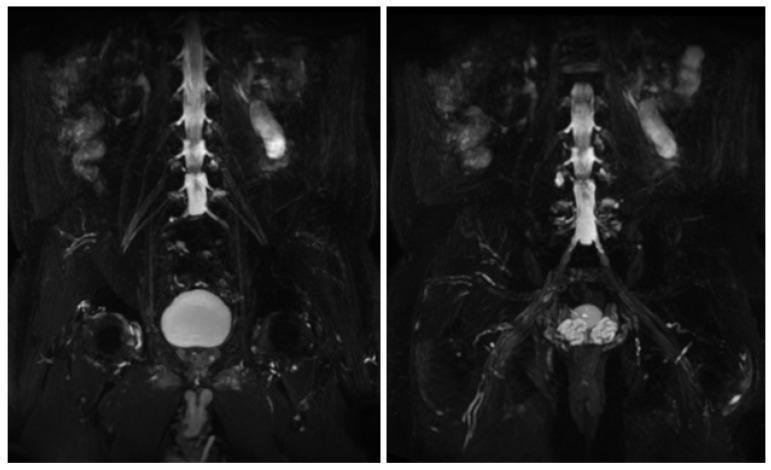
Diagnostic Image: This figure presents two coronal Maximum Intensity Projection (MIP) reconstructions from a 3D T2-weighted MRI sequence (likely a 3D CUBE or similar high-resolution neurography sequence) focusing on the lumbosacral plexus. The central vertical structure is the lumbar spinal column, where the thecal sac and exiting nerve roots exhibit high signal intensity against the suppressed background. The lumbar (L4, L5) and sacral (S1-S4) nerve roots are visible as thin, linear, branching structures extending laterally and inferiorly from the spine to form the plexus. The urinary bladder appears as a prominent, hyperintense spherical structure in the lower pelvic region. The images demonstrate normal anatomical morphology, with the nerve roots showing regular caliber, symmetry, and uniform signal intensity. There is no evidence of pathological contrast enhancement, hypertrophy, or diffuse swelling in this specific reconstruction. This imaging modality is essential in neurology and radiology for evaluating inflammatory or hereditary neuropathies and plexopathies by suppressing background fat and muscle to highlight neural architecture.
cutaneous nerve supply lower limb dermatome map
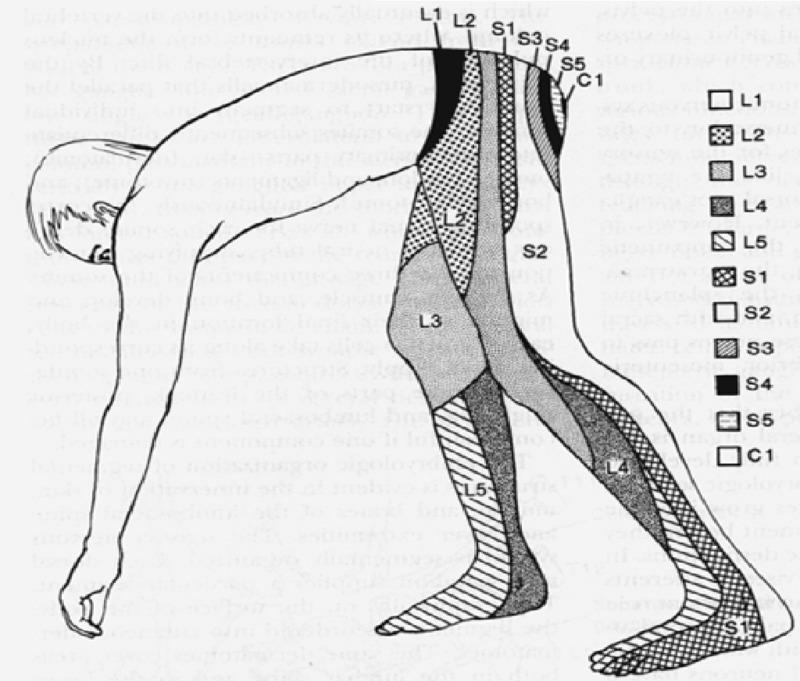
Anatomical diagram depicting a human dermatome map of the lumbosacral and coccygeal regions, shown from a lateral, bent-over perspective to highlight the sensory distribution along the lower extremities and posterior trunk. The illustration uses distinct shading patterns and alphanumeric labels to delineate specific cutaneous areas innervated by individual spinal nerve roots. Key segments include the lumbar dermatomes L1 through L5, sacral dermatomes S1 through S5, and the coccygeal dermatome C1. Visually, L1 covers the inguinal and hip region, L2-L3 transition down the anterior and lateral thigh, and L4-L5 extend down the lower leg to the dorsal foot. Sacral segments S1 and S2 cover the posterior leg and heel, while S3-S5 and C1 are concentrated in the perineal and gluteal regions. This medical illustration is a standard educational tool for neurological examinations, aiding in the localization of spinal nerve root compression or radiculopathy based on sensory loss patterns.
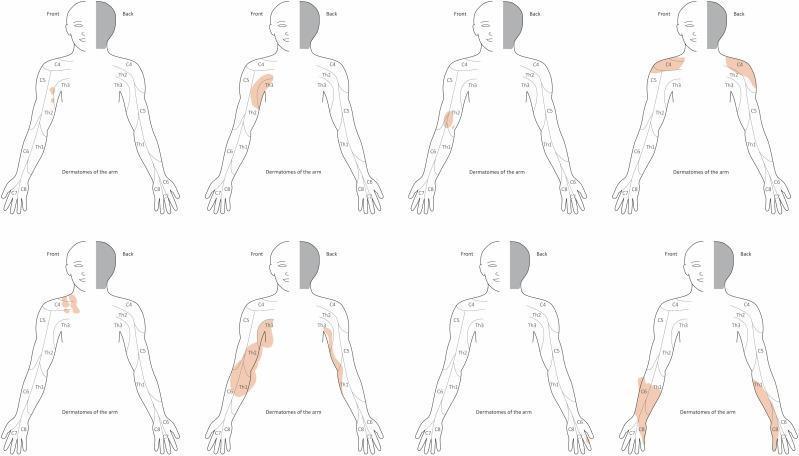
This medical illustration consists of eight schematic drawings depicting dermatomal distribution of the upper limb and hand, used to map the extent of plexiform neurofibromas (PNF). Each figure shows a frontal and dorsal (back) outline of a human torso and right arm. The dermatomes are labeled C4 through C8 and Th1 through Th3, illustrating the sensory innervation pathways from the shoulder to the fingertips. Areas of tumor involvement—representing either diffuse cutaneous neurofibroma or subcutaneous nodular PNF—are shaded in light orange/brown. The diagrams demonstrate the variable presentation of Neurofibromatosis type 1 (NF1), ranging from small, localized lesions restricted to a single dermatome (e.g., C5 or Th2) to large, confluent masses that cross multiple dermatomal boundaries and alter the anatomical contour of the limb. This visual tool aids in the clinical assessment and surgical planning of PNF by correlating physical tumor topography with spinal nerve segments, highlighting that tumor expansion often occurs independently of strict anatomical dermatomal borders.
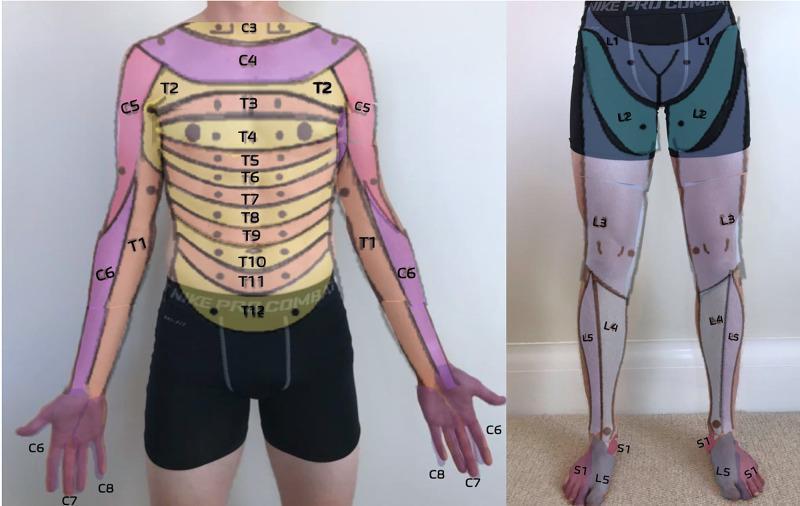
This clinical dermatome map, presented as an anatomical diagram overlaid on a human subject, illustrates the cutaneous sensory distribution of spinal nerves. The anterior trunk displays a sequential horizontal banding pattern representing thoracic dermatomes T2 through T12, with T4 roughly at the nipple line and T10 at the umbilicus. The upper extremities show cervical and upper thoracic distribution: C5 (lateral upper arm), C6 (lateral forearm and thumb), C7 (middle finger), C8 (medial hand and little finger), and T1 (medial forearm and arm). The lower extremity map details the lumbar and sacral levels: L1 (inguinal region), L2 (anterior mid-thigh), L3 (distal thigh and knee), L4 (medial lower leg), L5 (lateral lower leg and dorsal foot), and S1 (lateral foot and small toe). This resource is designed for primary care musculoskeletal medicine to assist in the neurological examination of sensory deficits, radiculopathy, or spinal cord injury level localization.
Nerve Supply of the Lower Limb
- Lumbar plexus: anterior rami of L1-L3 and part of L4
- Sacral plexus: lumbosacral trunk (rest of L4 + L5) + anterior rami of S1-S3 and part of S4
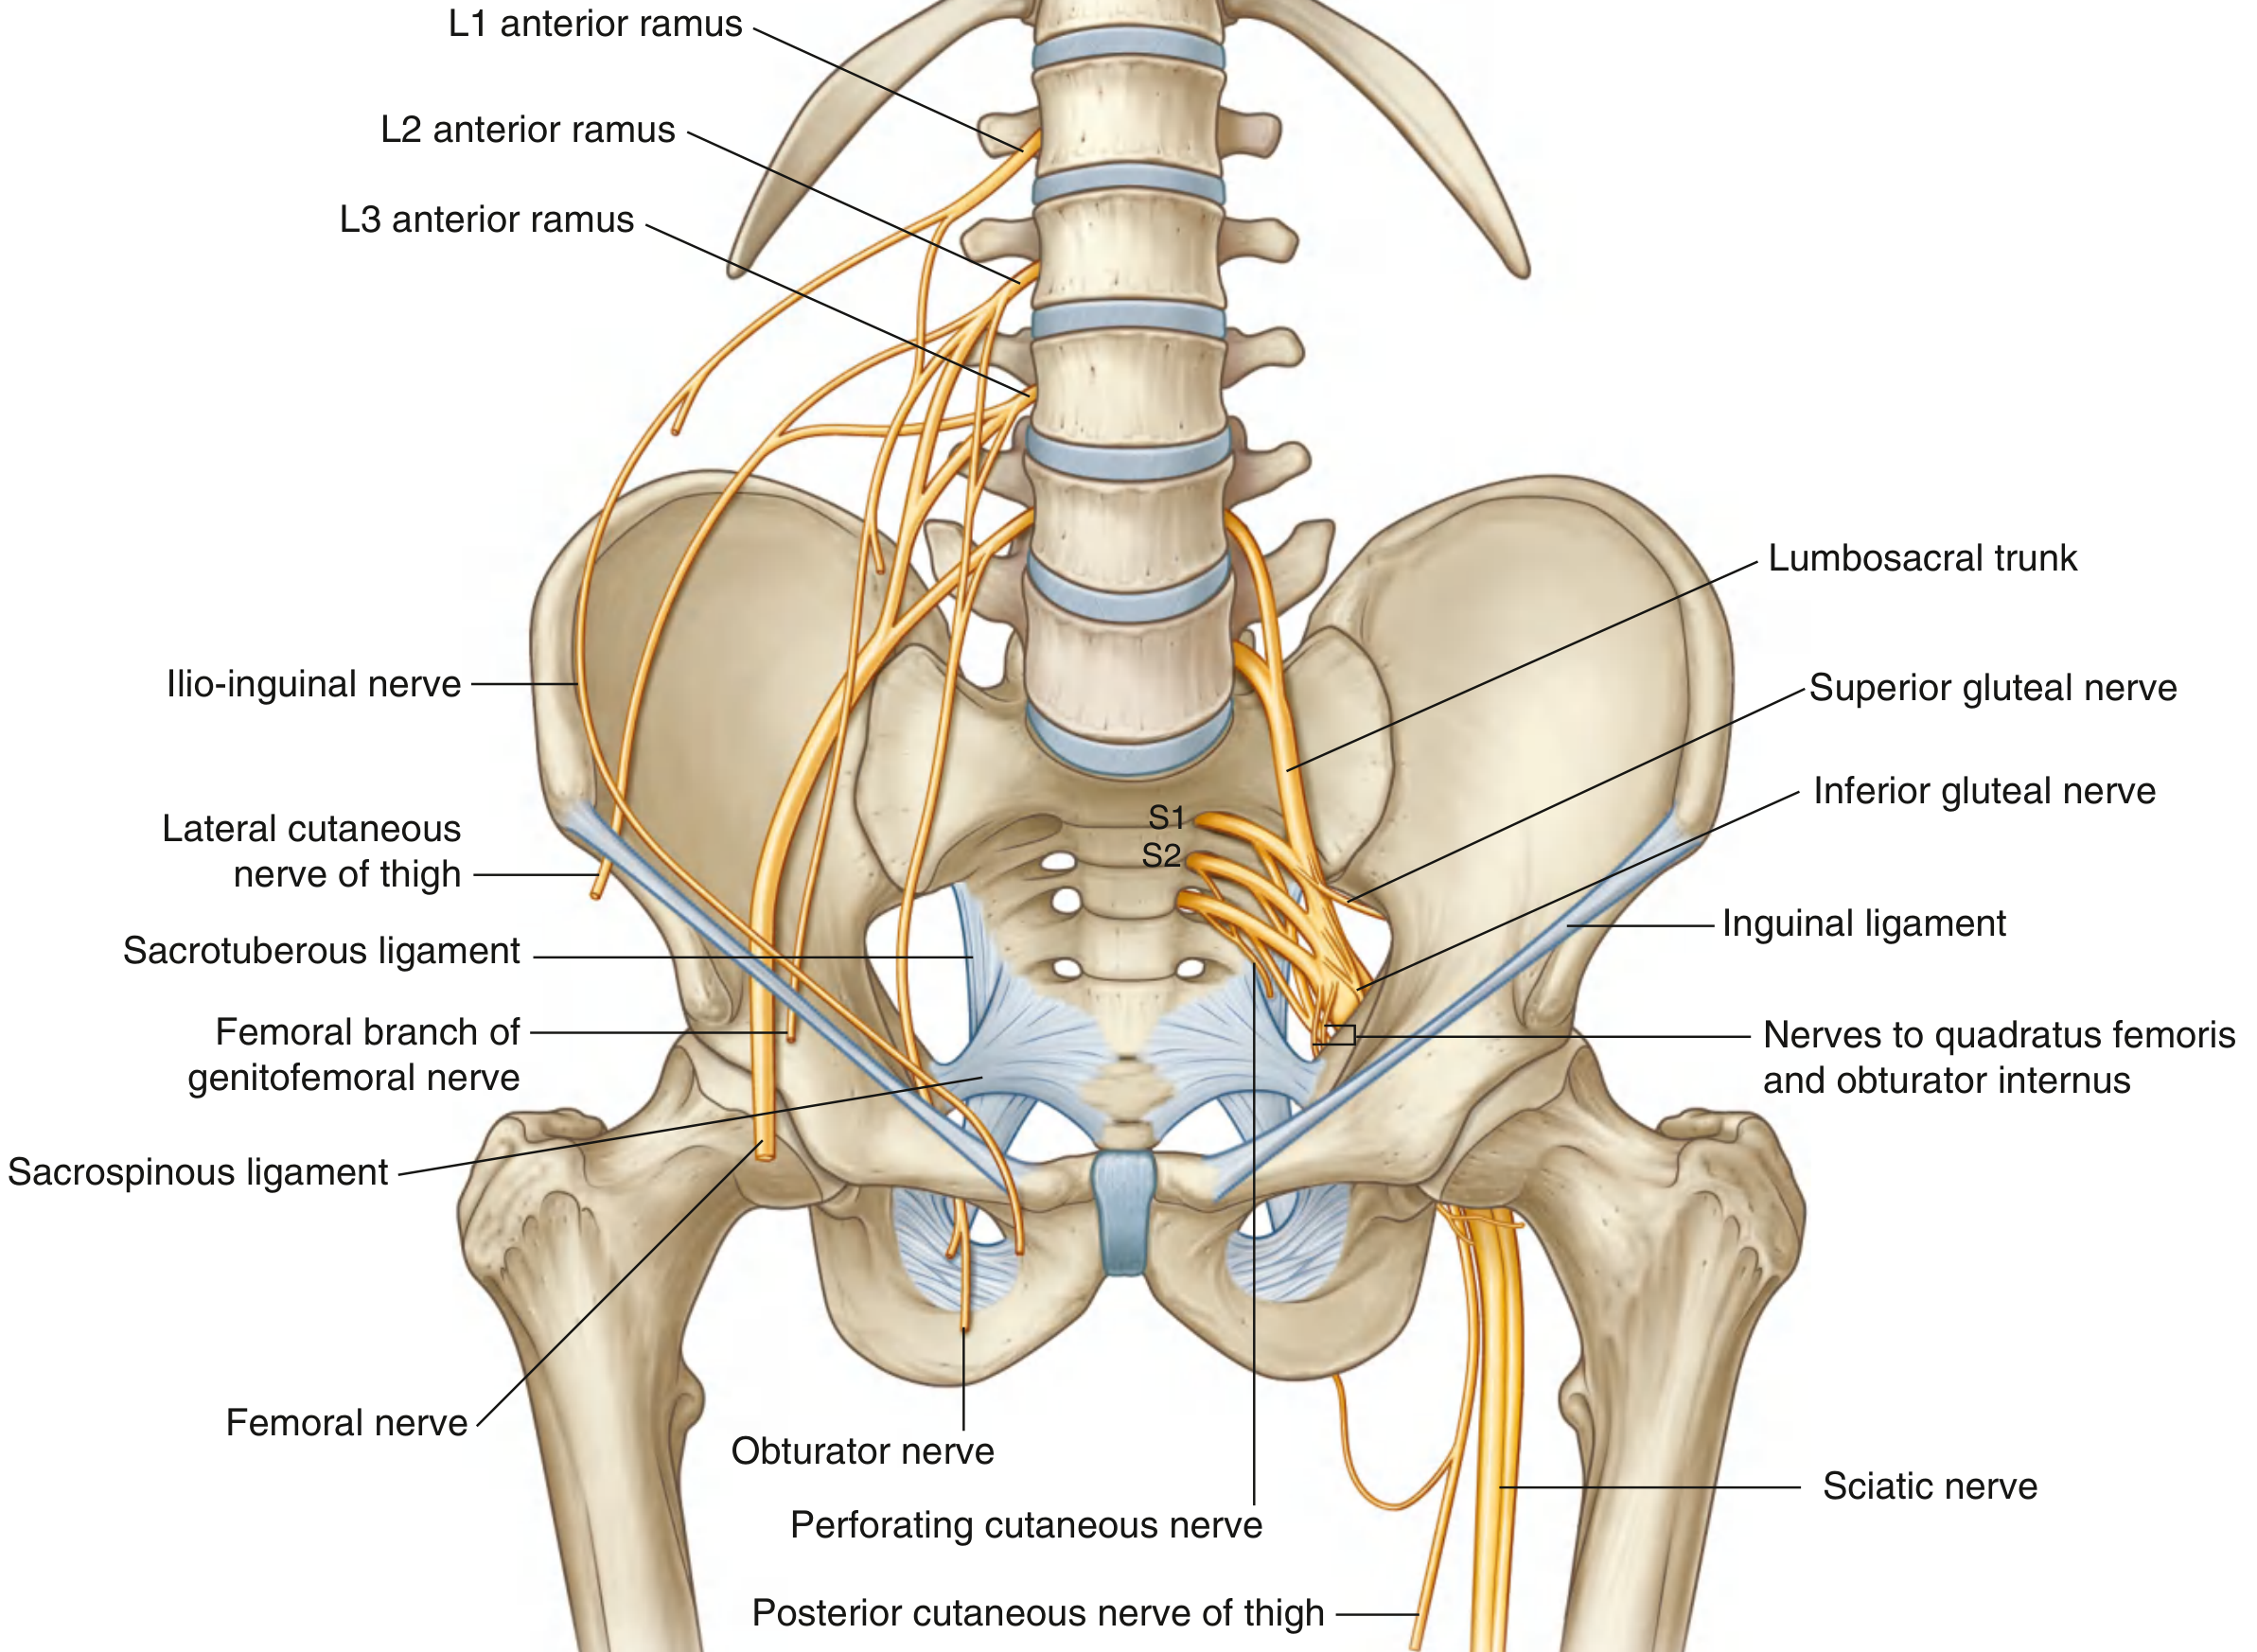
1. Femoral Nerve (L2-L4)
- Exits abdomen through the gap between inguinal ligament and superior pelvis
- Enters the femoral triangle, lateral to the femoral artery
- Motor: All muscles of the anterior compartment of thigh (quadriceps femoris, sartorius); also iliacus and pectineus in the abdomen
- Sensory: Anterior thigh, anteromedial knee, medial leg, medial foot (via saphenous nerve - its longest branch)
2. Obturator Nerve (L2-L4)
- Descends along posterior abdominal wall, enters thigh via the obturator canal
- Motor: All muscles of the medial compartment of thigh (adductors - longus, brevis, gracilis; part of adductor magnus); obturator externus
- Exception: Pectineus (femoral nerve) and the ischial part of adductor magnus (sciatic nerve) are NOT supplied
- Sensory: Skin on medial upper thigh
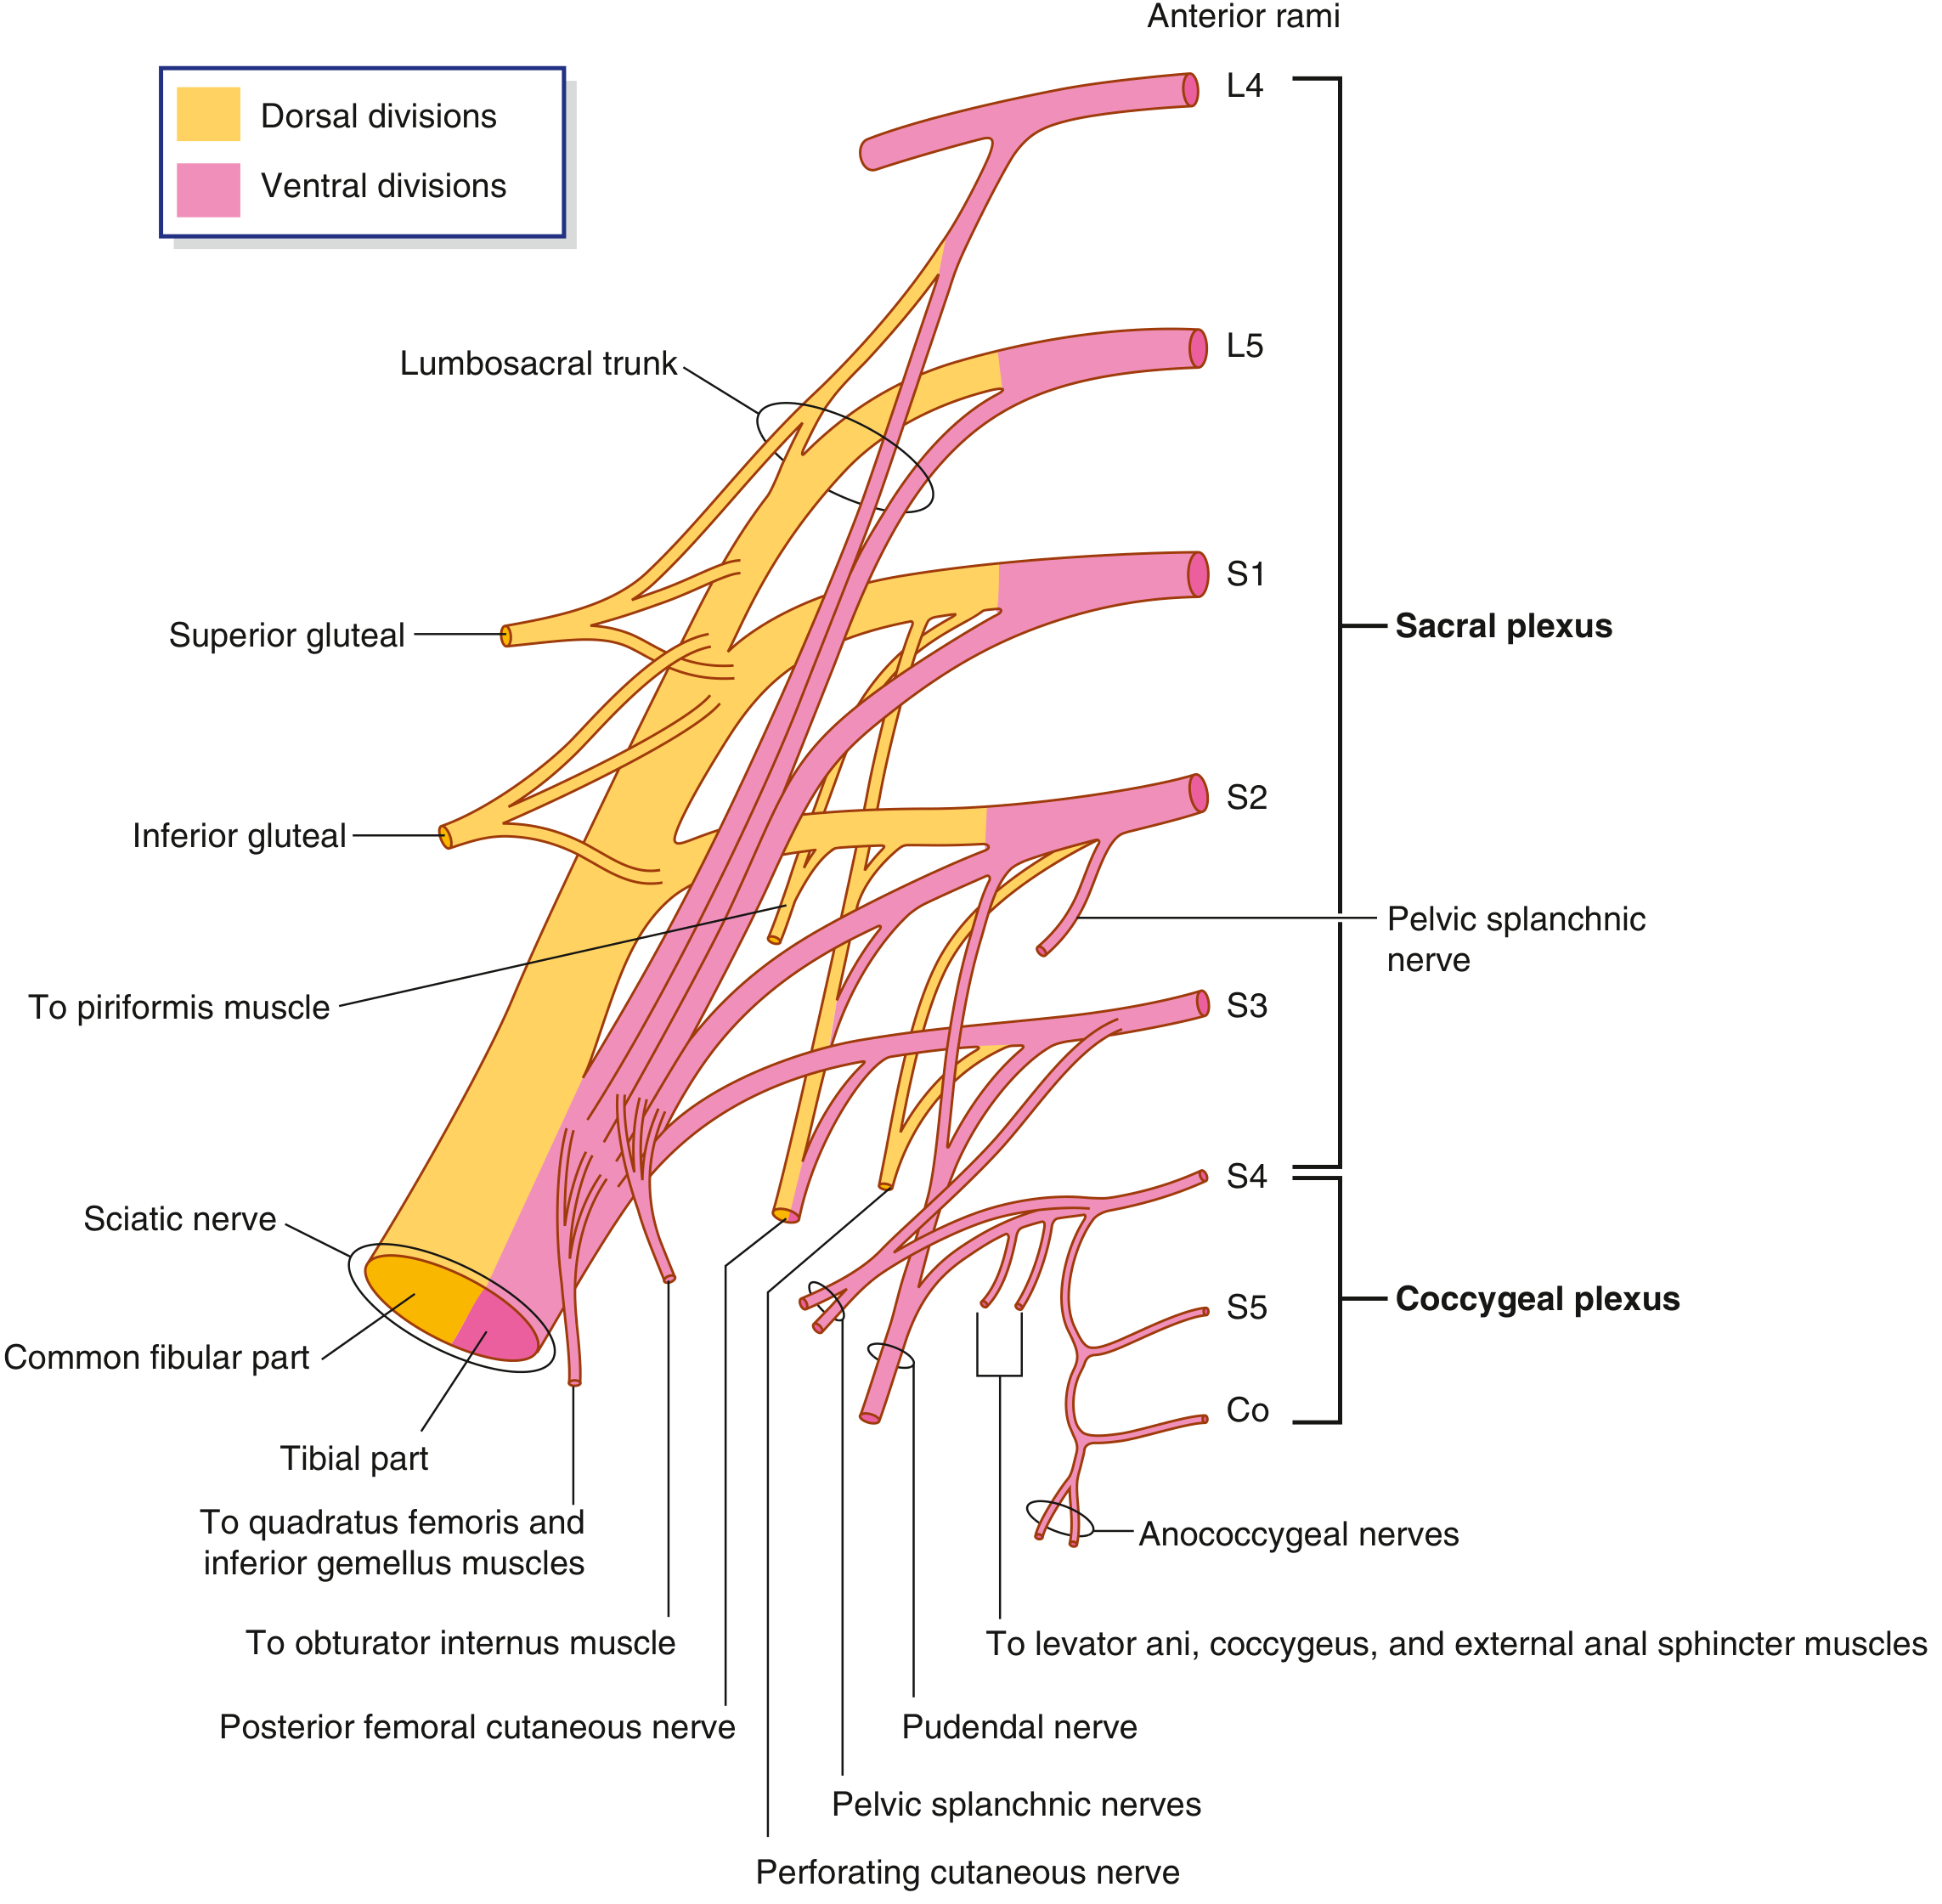
3. Sciatic Nerve (L4-S3) - Largest nerve in the body
- Formed on the anterior surface of piriformis; exits pelvis through the greater sciatic foramen below piriformis
- Passes through the gluteal region into the posterior compartment of the thigh, where it divides into:
- Common fibular (peroneal) nerve - carries posterior divisions of L4-S2
- Tibial nerve - carries anterior divisions of L4-S3
a) Common Fibular (Peroneal) Nerve (L4-S2)
- Winds around the neck of fibula
- Divides into:
- Superficial fibular nerve - muscles of lateral compartment of leg (fibularis longus and brevis); skin of dorsal foot
- Deep fibular nerve - muscles of anterior compartment of leg (tibialis anterior, extensor digitorum longus, extensor hallucis longus); dorsal web space between 1st and 2nd toes
b) Tibial Nerve (L4-S3)
- Passes through popliteal fossa, enters posterior compartment of leg
- Motor: All muscles of the posterior compartment of leg (gastrocnemius, soleus, tibialis posterior, flexor digitorum longus, flexor hallucis longus); all intrinsic muscles of the sole
- Sensory: Posterior leg, sole of foot (via medial and lateral plantar nerves)
- At ankle, passes through tarsal tunnel and divides into:
- Medial plantar nerve (L4, L5) - medial 3.5 toes + medial sole
- Lateral plantar nerve (S1, S2) - lateral 1.5 toes + lateral sole
4. Superior Gluteal Nerve (L4-S1)
- Exits through greater sciatic foramen above piriformis
- Motor: Gluteus medius, gluteus minimus, tensor fasciae latae
- Critical for the Trendelenburg gait if damaged
5. Inferior Gluteal Nerve (L5-S2)
- Exits through greater sciatic foramen below piriformis
- Motor: Gluteus maximus only
- Damage causes weakness rising from a chair, climbing stairs
6. Other Nerves
| Nerve | Segments | Function |
|---|---|---|
| Ilio-inguinal | L1 | Sensory: anteromedial upper thigh, adjacent perineum |
| Genitofemoral (femoral branch) | L1, L2 | Sensory: anterior central upper thigh |
| Lateral cutaneous nerve of thigh | L2, L3 | Sensory: anterolateral thigh |
| Posterior cutaneous nerve of thigh | S1-S3 | Sensory: gluteal fold, posterior thigh, upper posterior leg |
| Nerve to quadratus femoris | L4-S1 | Motor: quadratus femoris + gemellus inferior |
| Nerve to obturator internus | L5-S2 | Motor: obturator internus + gemellus superior |
| Perforating cutaneous nerve | S2, S3 | Sensory: medial aspect of gluteal fold |
Sacral and Coccygeal Plexus Diagram
Dermatome Summary
| Level | Area of skin |
|---|---|
| L1 | Inguinal/groin region |
| L2 | Anterior mid-thigh |
| L3 | Distal thigh/knee |
| L4 | Medial lower leg |
| L5 | Lateral lower leg, dorsal foot |
| S1 | Lateral foot, small toe |
| S2 | Posterior leg, heel |
| S3-S5 | Perineal/gluteal region |