
Brain tumors
What aspect of brain tumors are you most interested in? · What is your background/purpose?
I am Radiology resident I am having seminar on topic of Intra axial brain tumors ,so provide in depth knowledge about intra axial tumours,what to add in intraaxial tumours and explain all in depth,add extra other things as you think if needed
intra-axial brain tumors MRI imaging classification
glioblastoma MRI brain tumor imaging
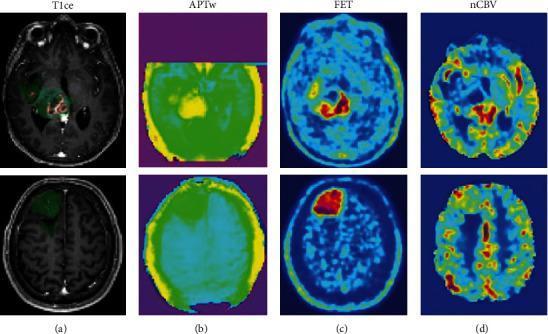
This diagnostic comparison chart displays multi-modal brain imaging for a high-grade glioblastoma (upper row) and a low-grade glioma (lower row) across four modalities: contrast-enhanced T1-weighted MRI (T1ce), amide proton transfer-weighted (APTw) MRI, FET PET, and normalized cerebral blood volume (nCBV) maps. Column (a) shows T1ce MRI with segmentation overlays: red indicates contrast-enhancing tumor (CET) and green highlights FLAIR hyperintense tumor (FHT). In the glioblastoma, CET and FHT are more extensive and irregular compared to the circumscribed regions in the low-grade glioma. Column (b) presents APTw imaging, where the glioblastoma exhibits higher yellow-green signal intensity, signifying increased endogenous protein/cellularity. Column (c) FET PET images demonstrate significantly higher amino acid uptake (red hot spots) in the glioblastoma, indicating higher metabolic activity. Column (d) nCBV maps show increased perfusion (red/yellow areas) in the glioblastoma, reflecting higher vascularity. This comparison highlights how multi-parametric advanced imaging differentiates tumor grades based on cellularity, metabolism, and hemodynamics.
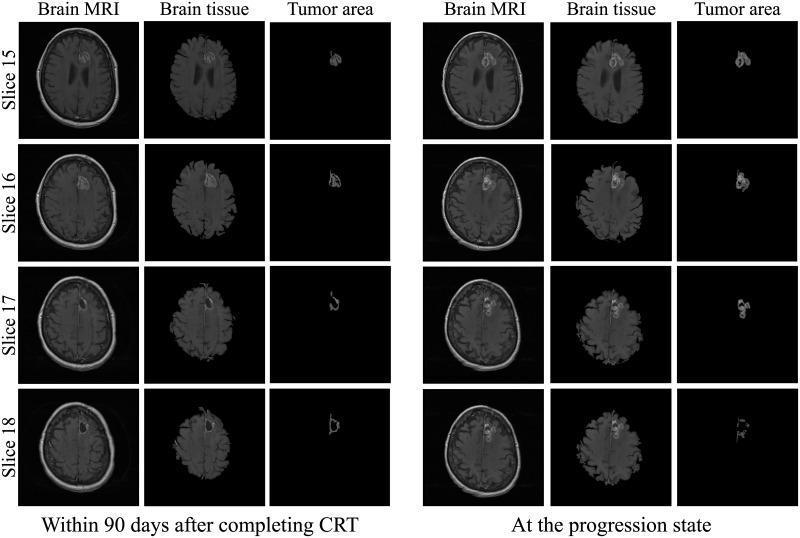
This Comparison Chart displays serial axial T1-weighted post-contrast MRI slices (Slices 15–18) of a patient with glioblastoma, comparing two clinical time points: 'Within 90 days after completing CRT' and 'At the progression state'. The layout is organized into three columns for each state: 'Brain MRI' (standard imaging), 'Brain tissue' (segmented parenchyma), and 'Tumor area' (isolated segmentation of the lesion).
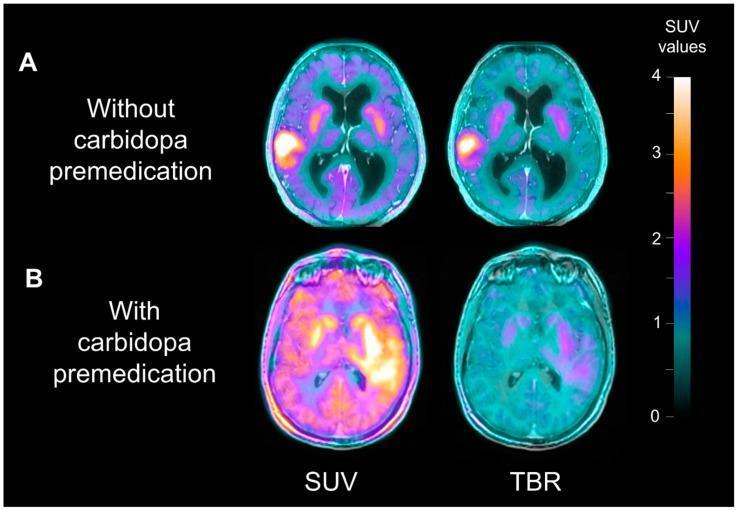
This diagnostic image displays axial 18F-FDOPA PET/MRI scans of the brain, comparing two patients with IDH-wildtype glioblastoma to demonstrate the effect of carbidopa premedication on image contrast. The visualization uses two imaging metrics: Standardized Uptake Value (SUV) and Tumor-to-Healthy-Brain Ratio (TBR). Row A (no carbidopa) shows a localized high-intensity SUV signal in the left hemisphere glioblastoma with low background uptake in healthy brain tissue. Row B (with carbidopa) illustrates significantly increased background SUV throughout the striatum and cortex, which reduces the visual contrast between the tumor and healthy tissue on the SUV parametric map. The corresponding TBR parametric images (right column) demonstrate how normalizing the signal to healthy brain tissue improves tumor definition and contrast, particularly in the premedicated patient (B) where the tumor otherwise blends with the elevated background. A color scale indicates SUV values from 0 to 4. This comparison is clinically relevant for neuro-oncology imaging protocols, highlighting how carbidopa increases tracer availability and the necessity of TBR maps for accurate tumor delineation.
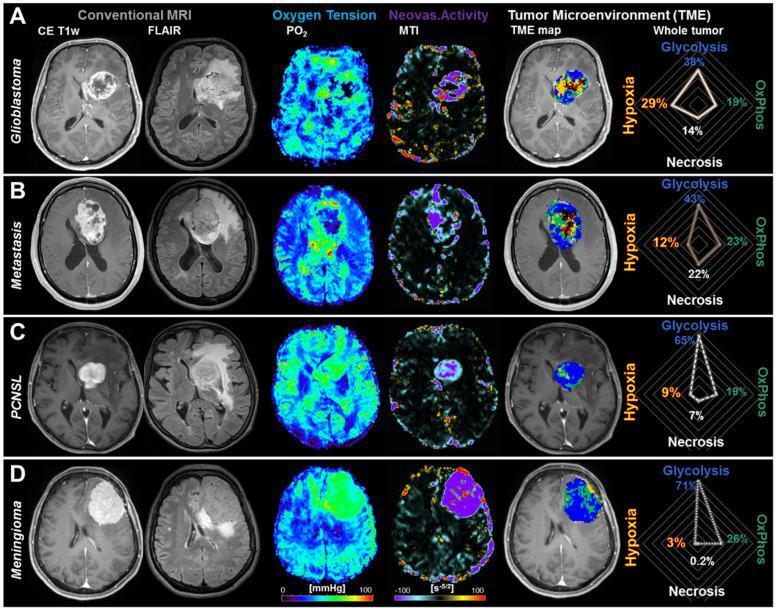
A multi-panel diagnostic imaging series demonstrating tumor microenvironment (TME) mapping across four brain tumor types: (A) Glioblastoma WHO grade 4, (B) Brain metastasis from breast cancer, (C) Primary central nervous system lymphoma (PCNSL), and (D) Meningioma. For each entity, axial MRI slices are presented across five modalities: Conventional CE T1w, FLAIR, tissue oxygen tension (PO2) maps, neovascularization activity (MTI) maps, and color-coded TME maps. Corresponding radar charts quantify metabolic compartments: Glycolysis (blue), Oxidative Phosphorylation (OxPhos, green), Necrosis (black), and Hypoxia (red/yellow). Glioblastoma (A) shows high heterogeneity with central necrosis and a significant hypoxic rim. The metastasis (B) shows a larger necrotic center compared to hypoxia. PCNSL (C) and Meningioma (D) exhibit metabolic dominance in aerobic glycolysis (65-71%) with higher oxygen tension and functional neovascularization, showing minimal necrosis. This visual data illustrates how advanced MRI mapping can differentiate tumor physiology based on metabolic signatures and vascular integrity.
![This diagnostic imaging panel provides a comparative analysis of positron emission tomography (PET) and magnetic resonance imaging (MRI) in a rat brain glioblastoma model. The top row displays axial PET scans using two different radiopharmaceuticals: O-(2-[18F]fluoroethyl)-L-tyrosine ([18F]FET), which targets amino acid transport, and [18F]fluoroazomycin arabinoside ([18F]FAZA), which targets tissue hypoxia. Both tracers show increased focal uptake (indicated by red/yellow pseudocoloring) within the tumor region. [18F]FET exhibits higher overall brain background and more uniform tumor delineation, whereas [18F]FAZA shows a more speckled, heterogeneous distribution reflecting hypoxic sub-volumes. The bottom row consists of corresponding contrast-enhanced T1-weighted MRI scans. These scans show a focal region of hyperintensity (gadolinium enhancement) indicative of blood-brain barrier disruption. A white boundary line is used across all modalities to delineate the anatomical extent of the rat brain. The image illustrates the clinical utility of multi-modal imaging to identify different physiological characteristics of glioblastoma, such as metabolic activity versus hypoxia, which is critical for targeted radiotherapy planning.](https://cdn.orris.care/cdss_images/pmc_clinical_VQA_05dd8ad003a7a800f0c8f5a3e6d1770a5d992ab6f80eae0e86112f0816f3d463.jpg)
This diagnostic imaging panel provides a comparative analysis of positron emission tomography (PET) and magnetic resonance imaging (MRI) in a rat brain glioblastoma model. The top row displays axial PET scans using two different radiopharmaceuticals: O-(2-[18F]fluoroethyl)-L-tyrosine ([18F]FET), which targets amino acid transport, and [18F]fluoroazomycin arabinoside ([18F]FAZA), which targets tissue hypoxia. Both tracers show increased focal uptake (indicated by red/yellow pseudocoloring) within the tumor region. [18F]FET exhibits higher overall brain background and more uniform tumor delineation, whereas [18F]FAZA shows a more speckled, heterogeneous distribution reflecting hypoxic sub-volumes. The bottom row consists of corresponding contrast-enhanced T1-weighted MRI scans. These scans show a focal region of hyperintensity (gadolinium enhancement) indicative of blood-brain barrier disruption. A white boundary line is used across all modalities to delineate the anatomical extent of the rat brain. The image illustrates the clinical utility of multi-modal imaging to identify different physiological characteristics of glioblastoma, such as metabolic activity versus hypoxia, which is critical for targeted radiotherapy planning.
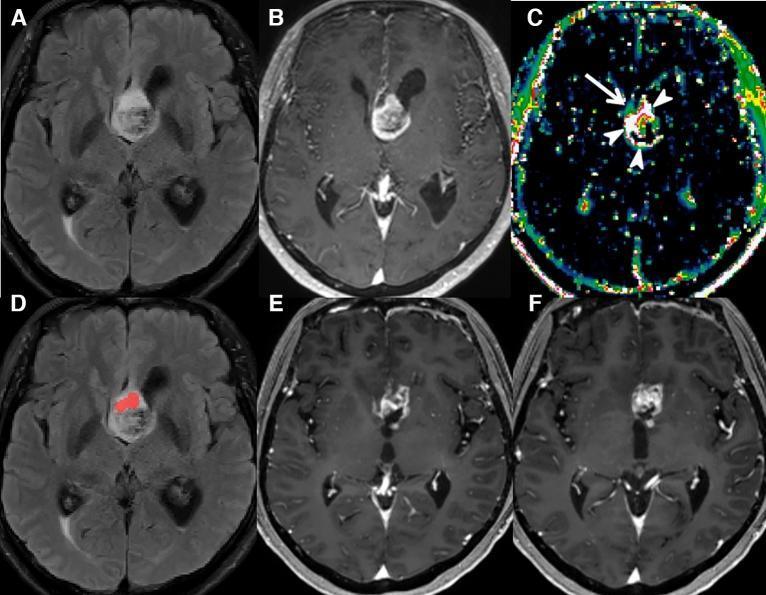
This composite of six axial brain MRI scans demonstrates a glioblastoma (GBM) and its progression over a 7-month interval. (A) T2-FLAIR image shows a hyperintense mass involving the septum pellucidum and corpus callosum with associated perilesional edema. (B) Contrast-enhanced T1-weighted (CE T1W) image displays the primary tumor's heterogeneous enhancement, signifying blood-brain barrier disruption. (C) A Ve map (extracellular extravascular volume fraction) highlights increased vascular permeability, with arrows pointing to focal areas of elevated Ve. (D) A predictive MRI model overlay identifies a high-risk region (red) for local recurrence within the non-enhancing T2 hyperintense zone. (E, F) Longitudinal follow-up CE T1W scans at 7 months confirm disease progression, evidenced by a new, measurable enhancing lesion at the genu of the corpus callosum. This sequence illustrates the clinical utility of combining conventional imaging with physiological MRI parameters (like Ve maps) and predictive modeling to anticipate sites of glioblastoma recurrence beyond the initial contrast-enhancing tumor margins.
brain tumor MRI classification types low grade high grade glioma lymphoma metastasis
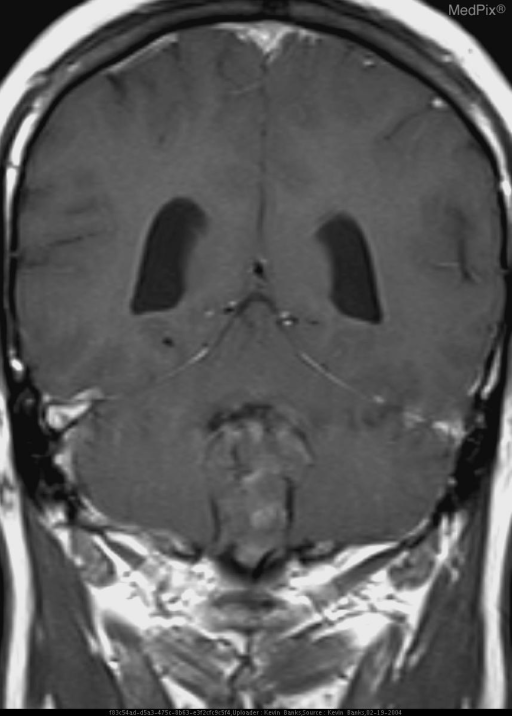
medulloblastoma posterior fossa MRI cerebellum child
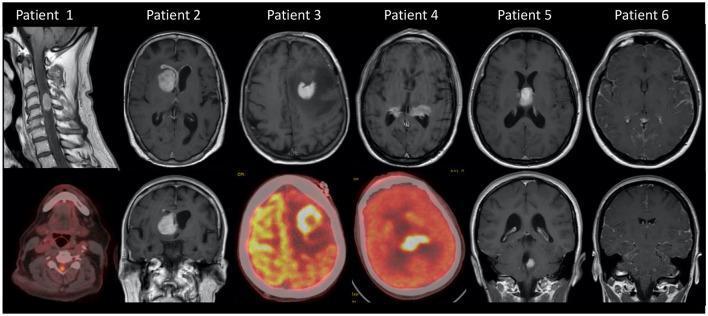
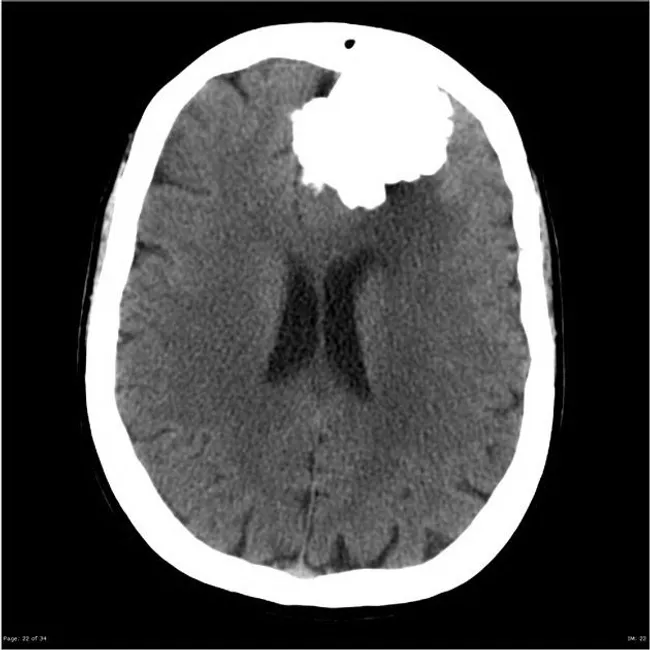
WHO 2021 CNS tumor classification 5th edition intra-axial brain tumors radiology updates
INTRA-AXIAL BRAIN TUMORS
A Comprehensive Radiology Seminar Guide
1. DEFINITION AND FUNDAMENTAL CONCEPT
Key Radiological Signs That Confirm Intra-Axial Origin:
- No CSF cleft between lesion and brain
- No buckling/displacement of gray-white matter interface
- No broad dural base
- Epicenter within brain parenchyma
- Surrounding infiltrative edema rather than compressed cortex
2. WHO CNS CLASSIFICATION - UNDERSTANDING THE EVOLUTION
WHO 2016 (4th Edition - Major Paradigm Shift)
- IDH mutation status
- 1p/19q codeletion
- MGMT promoter methylation
| Tumor Type | ICD-O Code |
|---|---|
| Glioblastoma, IDH-wildtype | 9440/3 |
| Glioblastoma, IDH-mutant | 9445/* |
| Diffuse astrocytoma, IDH-mutant | 9400/3 |
| Oligodendroglioma, IDH-mutant AND 1p/19q-codeleted | 9450/3 |
| Diffuse midline glioma, H3 K27M-mutant | 9385/* |
WHO 2021 (5th Edition - Current Standard)
- Arabic numerals replace Roman numerals for grading (Grade 4, not Grade IV)
- Within-type grading - grade is assigned within a tumor type, not across all CNS tumors
- DNA methylation profiling added as a diagnostic tool
- 22 newly recognized tumor entities added
- Greater separation between pediatric-type and adult-type diffuse gliomas
- Astrocytoma, IDH-mutant is now graded 2, 3, or 4 (previously only grade 2-3 for astrocytoma; grade 4 was called GBM)
3. CLASSIFICATION OF INTRA-AXIAL TUMORS
A. Diffuse Glial Tumors (Most Common - 50-70% are high grade)
- Glioblastoma, IDH-wildtype (Grade 4)
- Astrocytoma, IDH-mutant (Grade 2, 3, 4)
- Oligodendroglioma, IDH-mutant + 1p/19q codeleted (Grade 2, 3)
- Diffuse midline glioma, H3 K27M-mutant (Grade 4)
- Diffuse hemispheric glioma, H3 G34-mutant (Grade 4) - NEW in 2021
B. Circumscribed Gliomas
- Pilocytic astrocytoma (Grade 1)
- Pleomorphic xanthoastrocytoma (PXA) (Grade 2, 3)
- Subependymal giant cell astrocytoma (SEGA) (Grade 1)
C. Glioneuronal & Neuronal Tumors
- Ganglioglioma (Grade 1-3)
- Dysembryoplastic neuroepithelial tumor (DNET) (Grade 1)
- Central neurocytoma
- Cerebellar liponeurocytoma
D. Ependymal Tumors
- Ependymoma (Grade 2-3)
- Myxopapillary ependymoma (Grade 2)
- Subependymoma (Grade 1)
- Ependymoma, RELA-fusion positive (now called supratentorial ependymoma, ZFTA fusion-positive in WHO 2021)
E. Embryonal Tumors (predominantly pediatric)
- Medulloblastoma (all grades)
- CNS embryonal tumor (Grade 4)
F. Other Intra-Axial Entities (non-primary)
- Brain metastases
- Primary CNS Lymphoma (PCNSL)
- Tumefactive MS (mimicker)
- Brain abscess (mimicker)
4. GLIOBLASTOMA (GBM) - THE MOST IMPORTANT TUMOR
Epidemiology
- Most common primary malignant brain tumor in adults
- Peak incidence: 55-75 years
- Median survival: 12-14 months even with maximal treatment (surgery + RT + TMZ)
- M:F ratio approximately 1.6:1
Molecular Biology (Critical for Radiology Reports)
| Marker | Significance |
|---|---|
| IDH status | Wild-type = primary GBM (>90%), worst prognosis |
| MGMT methylation | Predicts response to temozolomide; better prognosis |
| EGFR amplification | Common in IDH-wt GBM |
| TERT mutation | Common in IDH-wt GBM |
Imaging Features
- Heterogeneous hypodense mass with irregular peripheral hyperdense rim (blood)
- Surrounding vasogenic edema
- Mass effect, midline shift
- Avid, irregular ring enhancement
- T1: Heterogeneous, central hypointensity (necrosis)
- T2/FLAIR: Extensive surrounding hyperintensity - the T2/FLAIR halo ALWAYS contains infiltrating tumor cells (not just edema)
- T1+Gd: Thick, nodular, irregular ring enhancement - hallmark
- DWI/ADC: Restricted diffusion in solid components (high cellularity); low ADC in enhancing margins
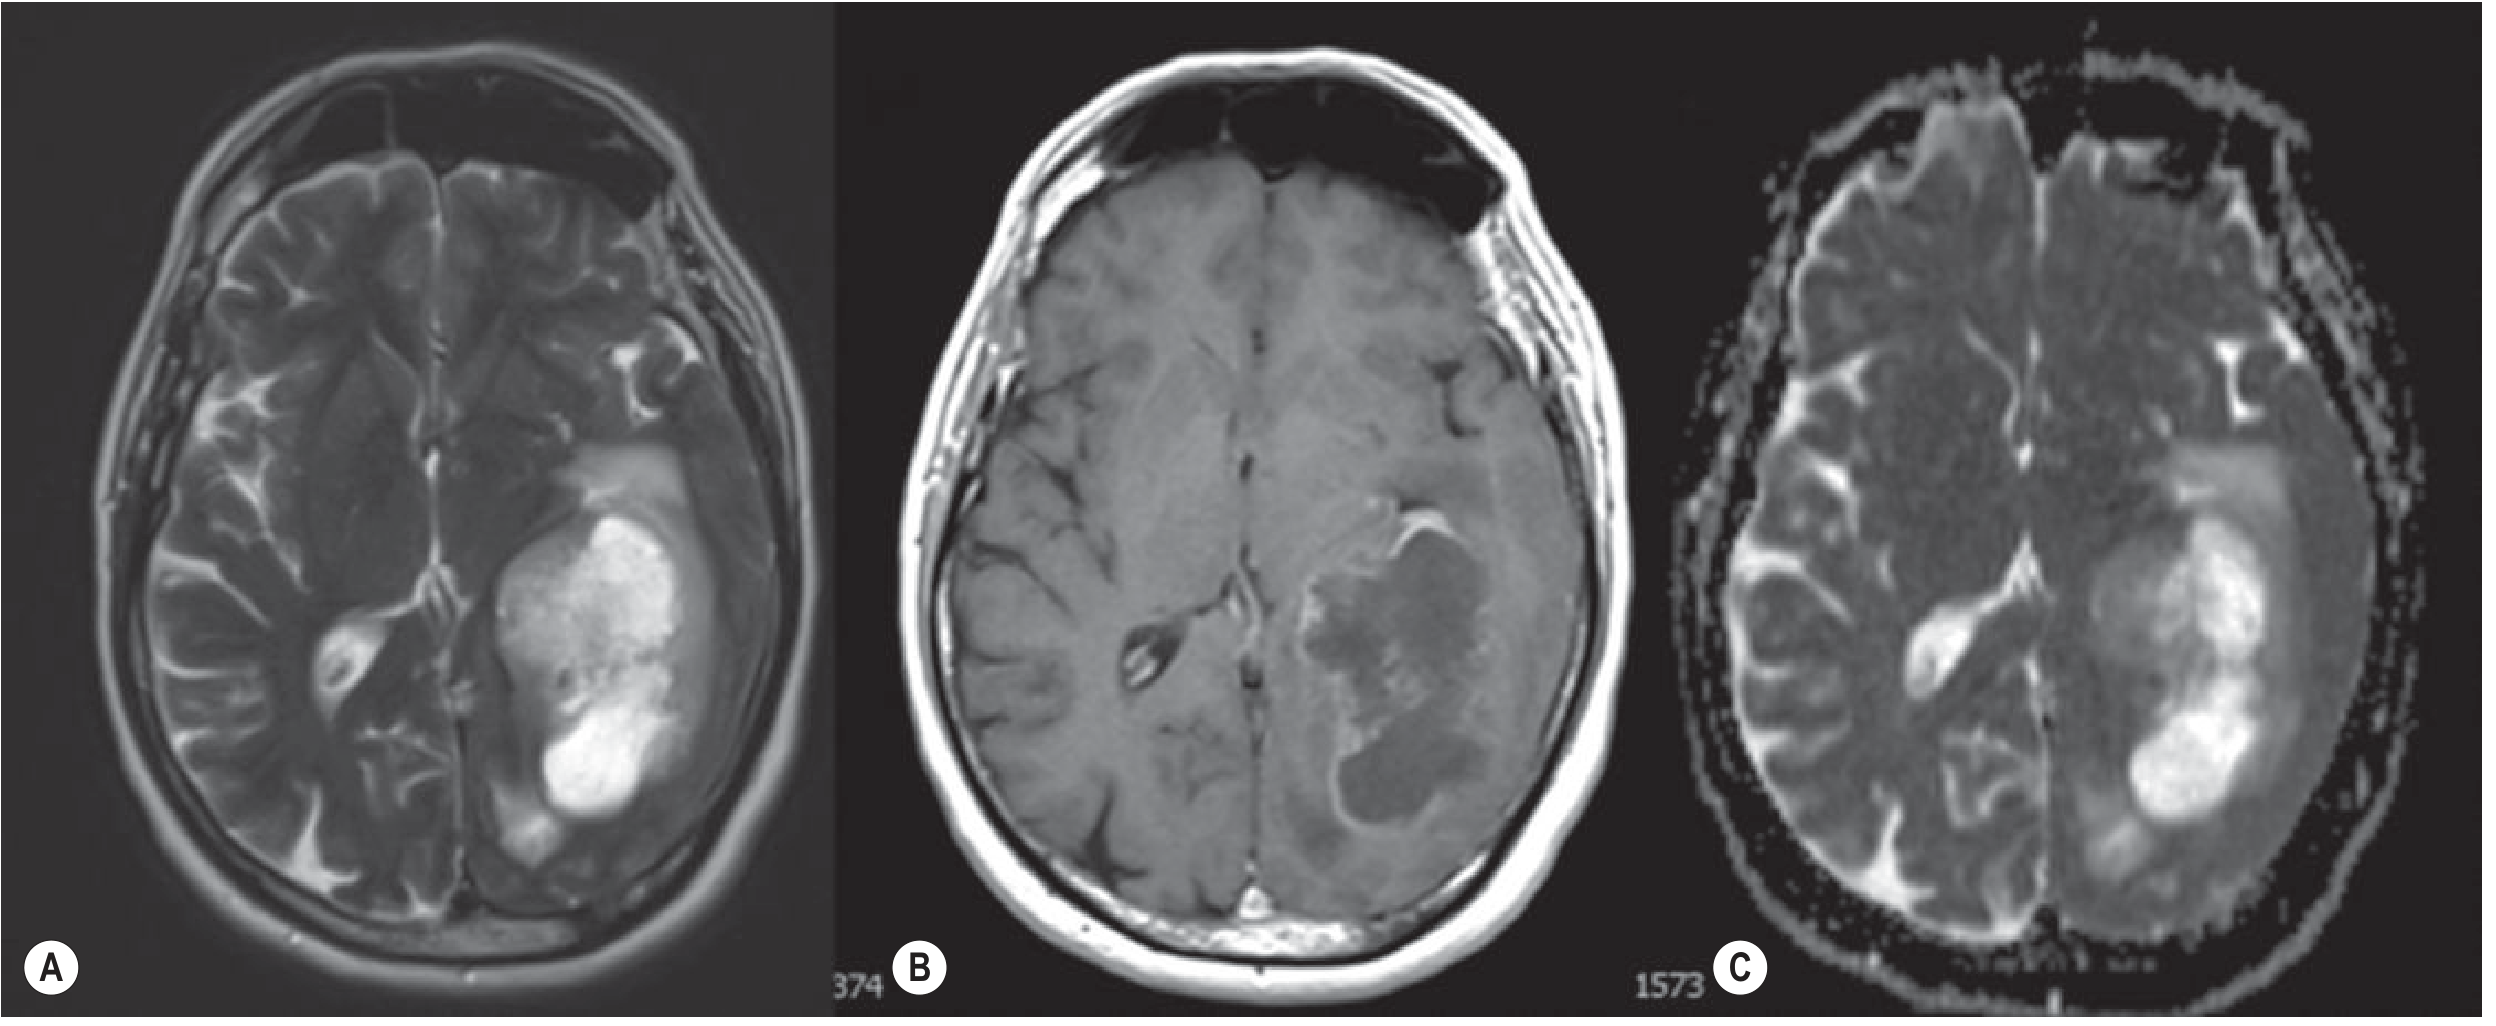
| Modality | GBM Finding | Significance |
|---|---|---|
| DSC Perfusion (rCBV) | Markedly elevated (>1.75 cutoff) | Neovascularity / angiogenesis |
| MRS | Elevated Cho, reduced NAA, Cho/NAA >2, lipid/lactate peaks | High cellularity + necrosis |
| DWI | Restricted diffusion in cellular areas | High tumor grade |
| fMRI | Maps eloquent cortex | Pre-surgical planning |
| DTI | White matter tract displacement vs. infiltration | Surgery planning |
Butterfly GBM - High Yield Pattern
GBM Treatment Response Monitoring
- Pseudoprogression: Apparent increase in enhancement within 3 months of RT + TMZ - represents treatment effect, not true progression. More common with MGMT-methylated tumors.
- Pseudoresponse: Apparent decrease in enhancement with anti-VEGF therapy (bevacizumab) - the tumor shrinks its enhancement but continues growing as non-enhancing T2/FLAIR disease.
- RANO criteria: Standardized bidirectional measurements for treatment response; requires combining enhancing AND non-enhancing T2/FLAIR changes.
5. IDH-MUTANT GLIOMAS (Lower Grade)
The IDH Mutation - Why It Matters
- 1p/19q codeleted → Oligodendroglioma (best prognosis, ~8 years mean survival)
- No 1p/19q codeletion → Astrocytoma, IDH-mutant (intermediate prognosis)
Imaging Features of IDH-Mutant Low-Grade Gliomas
- Young adults (mean age 30-40 years)
- Often cortically based, frontal lobe predominance
- Seizures as presenting symptom
- Well-defined, non-enhancing (usually)
- T2/FLAIR hyperintense without much surrounding edema (unlike GBM)
- Cortically based, frequently frontal lobe (70%)
- Calcification in ~70-90% (coarse, irregular) - best seen on CT
- T2 heterogeneous with cysts
- Enhancement variable
- Can have paradoxically elevated rCBV despite low grade (due to branching "chicken-wire" vasculature)
- Diffuse, infiltrating
- T2/FLAIR homogeneous hyperintensity
- Usually non-enhancing at Grade 2; enhancement signals Grade 3-4
- Lower rCBV than oligodendroglioma
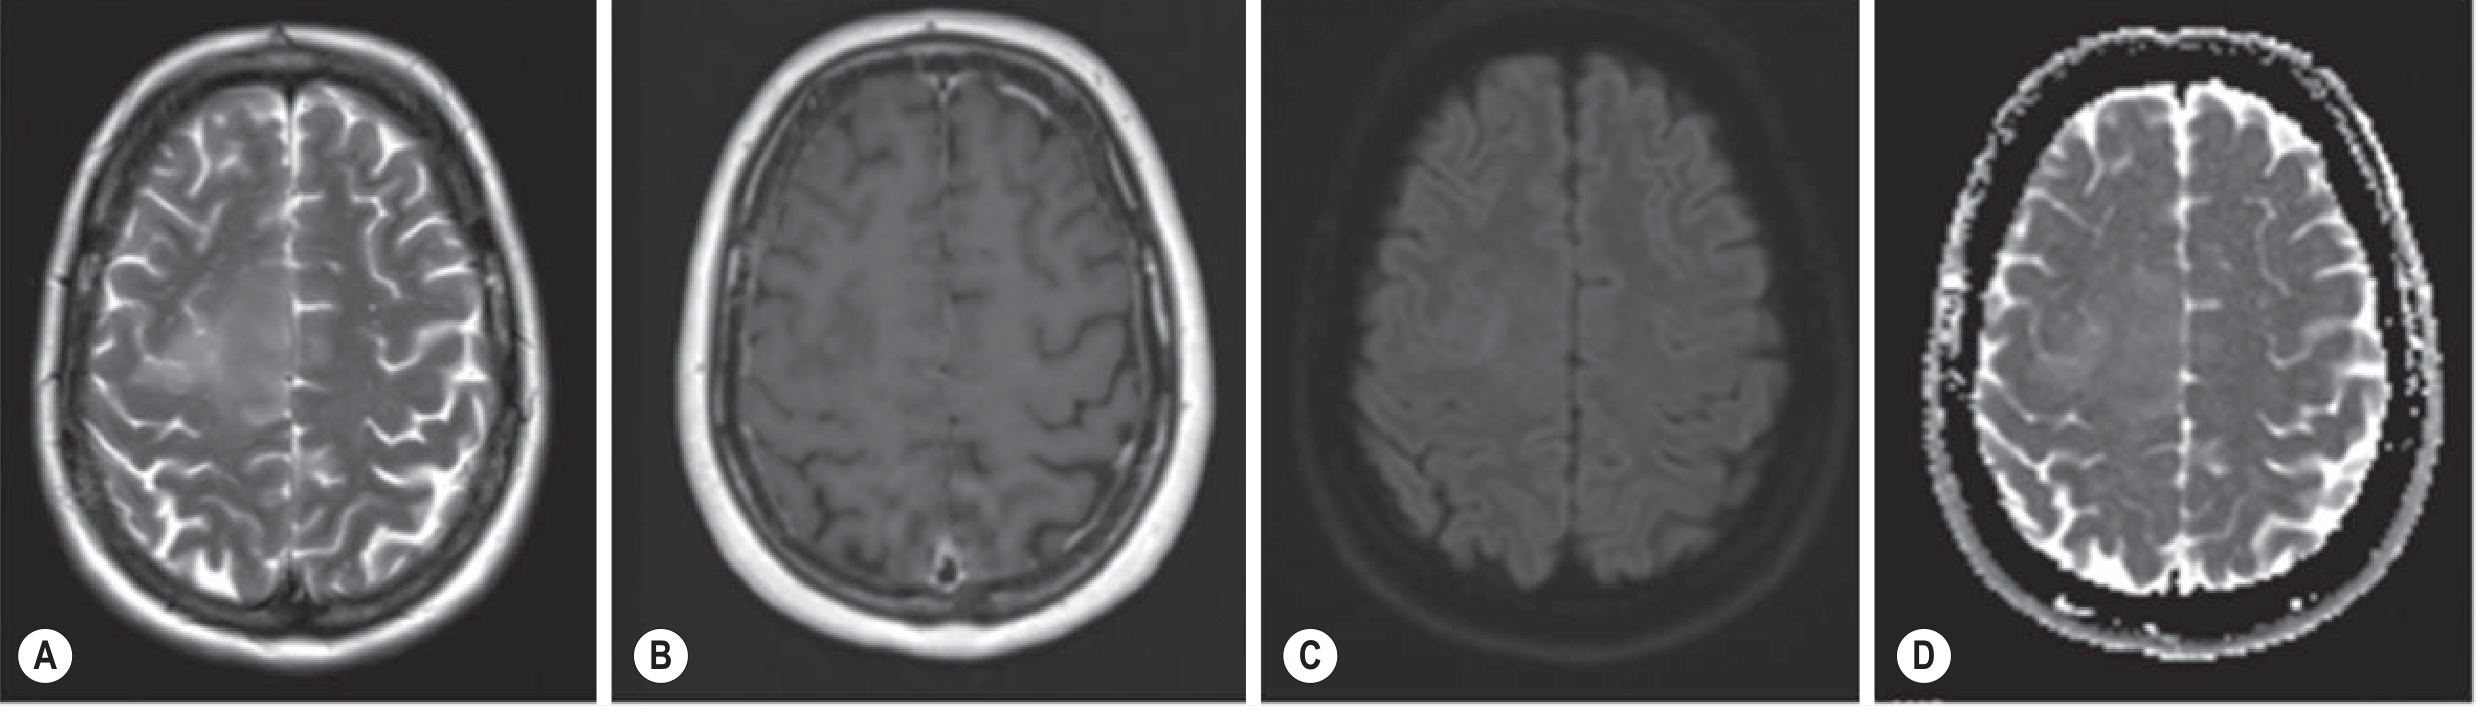
6. DIFFUSE MIDLINE GLIOMA (H3 K27M-Mutant) - HIGH YIELD
- WHO Grade 4 - all cases, regardless of histology
- Predominantly pediatric/young adults
- Location: Brainstem (especially pons = DIPG), thalamus, spinal cord
- The H3 K27M mutation (histone mutation) is the defining molecular feature
- Imaging: Diffuse, infiltrating pontine/thalamic mass, variable enhancement, often no necrosis
- Prognosis: Median survival ~10-12 months despite treatment
7. CIRCUMSCRIBED GLIOMAS
Pilocytic Astrocytoma (Grade 1)
- Most common brain tumor in children overall
- Location: Cerebellum (most common), optic pathway, hypothalamus, brainstem
- Classic MRI: Cyst with enhancing mural nodule - "cyst + nodule" pattern
- The cyst wall does NOT enhance; the mural nodule enhances avidly
- Leptomeningeal spread is rare despite WHO Grade 1 - excellent prognosis after surgery
Pleomorphic Xanthoastrocytoma (PXA)
- Young adults, temporal lobe
- Classic: Cortically based, superficial, cyst + nodule; dural involvement/tail may be seen (but it's intra-axial!)
- Can mimic meningioma due to dural contact
- Often presents with chronic epilepsy
- May dedifferentiate to anaplastic PXA (Grade 3) or GBM
Subependymal Giant Cell Astrocytoma (SEGA)
- Virtually pathognomonic of tuberous sclerosis
- Location: Foramen of Monro (causes obstructive hydrocephalus)
- CT: Hyperdense, calcified; MRI: Heterogeneous with avid enhancement
- Treatment: Surgical or mTOR inhibitor (everolimus)
8. EPENDYMOMAS
Key Facts
- Arise from ependymal cells lining the ventricles and central canal
- Bimodal distribution: Children (posterior fossa) and adults (spinal cord)
- The WHO 2021 classification now defines ependymomas by molecular subtypes, not just location
Intracranial Ependymoma Locations
| Location | Age Group | Molecular Subtype |
|---|---|---|
| 4th ventricle | Children | PF-EPN-A or PF-EPN-B |
| Supratentorial | Older children/YA | ZFTA fusion-positive (formerly RELA) |
| Spinal | Adults | NOS or myxopapillary |
Imaging Features
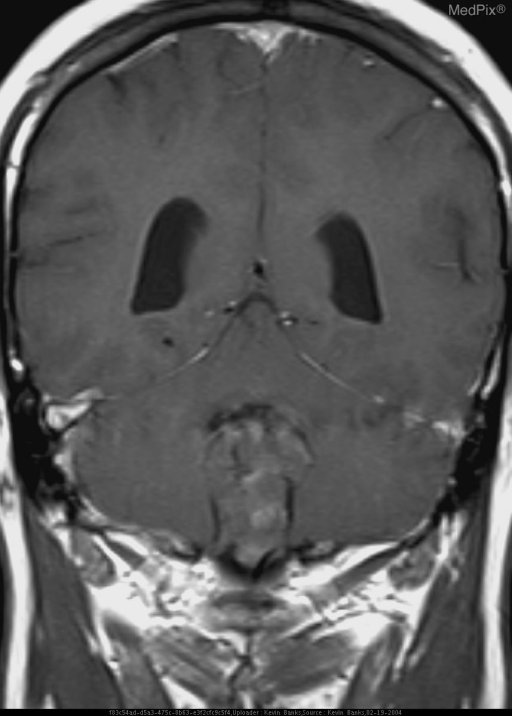
- 4th ventricle ependymoma: Classically "squeezing" through the foramina of Luschka/Magendie (plastic/insinuating growth) - high yield!
- Heterogeneous: cysts, calcification, hemorrhage ("salt and pepper")
- Moderate to marked enhancement
- Leptomeningeal drop metastases occur - must image the whole spine
9. MEDULLOBLASTOMA
Epidemiology
- Most common malignant brain tumor in children
- Peak age 5-7 years; second peak in adults 20-40 years
- Location: Cerebellar vermis (children, arising from 4th ventricle roof) vs. cerebellar hemisphere (adults)
WHO 2021 Molecular Subgroups (High Yield for Modern Practice)
| Subgroup | Molecular Feature | Age | Prognosis |
|---|---|---|---|
| WNT-activated | CTNNB1 mutation | Older children | Best (>90% survival) |
| SHH-activated | PTCH1, SMO, SUFU | Infants + adults | Intermediate |
| Group 3 | MYC amplification | Young children | Worst |
| Group 4 | CDK6 amplification | All ages | Intermediate |
Imaging Features
- CT: Hyperdense vermian mass (highly cellular - high nuclear:cytoplasmic ratio causes T2 hypointensity and CT hyperdensity)
- MRI T2: Isointense to hypointense - differentiates from pilocytic astrocytoma (T2 bright)
- DWI: Markedly restricted diffusion (ADC very low) - key feature
- Heterogeneous enhancement
- Obstructive hydrocephalus common
- Drop metastases along the spinal axis in ~30-40% - MRI whole spine mandatory at staging
10. BRAIN METASTASES - A RADIOLOGIST'S DAILY BREAD
Epidemiology
- 10x more common than primary brain tumors in adults
- Most common in adults >40 years
- Common primaries: Lung (most common, ~50%), Breast, Melanoma, Renal cell, Colorectal
Distribution Pattern
- 80% supratentorial (proportional to blood flow)
- Predilection for gray-white matter junction (embolic trapping at small vessel branching)
- 15% infratentorial (cerebellum)
Imaging Features
- T1: Hypointense (or hyperintense if melanoma/hemorrhage)
- T2: Hypointense to isointense solid portions; extensive surrounding vasogenic edema (often disproportionately large edema relative to the small metastatic nodule)
- T1+Gd: Ring or solid enhancement; small metastases may be invisible without contrast - always use Gd-enhanced MRI
- DWI: Variable (usually no restriction, unlike abscess which restricts)
- SWI: Look for blooming artifact - melanoma, choriocarcinoma, thyroid metastases are hemorrhage-prone
Special Cases - High Yield for Radiology
| Primary Tumor | Special Imaging Clue |
|---|---|
| Melanoma | T1 hyperintense (melanin/hemorrhage); hemorrhagic |
| Lung | Most common; solitary or multiple |
| Renal cell carcinoma | Hypervascular, cystic, hemorrhagic |
| Breast | Leptomeningeal spread common |
| Choriocarcinoma | Highly hemorrhagic |
Solitary Metastasis vs. GBM - The Classic Differential
| Feature | Metastasis | GBM |
|---|---|---|
| Location | GM-WM junction | Deep white matter/basal ganglia |
| Edema | Vasogenic, large | Infiltrative T2 halo |
| Enhancement | Clean ring/solid | Irregular, nodular rim |
| Multiplicity | Often multiple | Usually solitary |
| ADC inner cavity | Unrestricted | May show restricted areas in necrotic core |
| MRS | Elevated Cho (if solid) | Cho/NAA markedly elevated + lipid/lactate |
11. PRIMARY CNS LYMPHOMA (PCNSL)
Overview
- B-cell NHL confined to the CNS (usually diffuse large B-cell)
- Increasing incidence in immunocompetent patients (not just AIDS)
- Highly aggressive but steroid-sensitive and chemosensitive (HD-MTX based)
Imaging Features - "The Ghost Tumor"
- Location: Deep gray matter (basal ganglia, thalamus), periventricular white matter, corpus callosum
- CT: Hyperdense (due to high cellular density, nuclear:cytoplasm ratio)
- MRI T2: Iso to hypointense (unlike most tumors - this is a key teaching point)
- T1+Gd: Homogeneous, avid enhancement in immunocompetent patients
- DWI: Markedly restricted diffusion (ADC very low) - due to hypercellularity
- Immunocompromised patients (HIV/AIDS): Ring-enhancing; must differentiate from toxoplasmosis (toxo responds to empirical treatment; PCNSL does not)
The Ghost Tumor Sign

12. GLIONEURONAL TUMORS
Ganglioglioma
- Most common cause of chronic temporal lobe epilepsy in young patients
- Location: Temporal lobe (>70%)
- MRI: Cortically based, cyst + enhancing nodule (similar to pilocytic)
- Calcification frequent
- Usually Grade 1-2, excellent prognosis after surgery
DNET (Dysembryoplastic Neuroepithelial Tumor)
- Young patients, intractable partial seizures
- Supratentorial cortex (temporal, frontal)
- "Bubbly" multicystic appearance - T1 hypointense, T2 bright
- Classic: No edema, no mass effect, no enhancement (in most cases)
- Cortical location, may have pseudogyral expansion
13. INTRAVENTRICULAR TUMORS (Technically Intra-Axial or Periventricular)
| Tumor | Age | Location | Key Feature |
|---|---|---|---|
| Central neurocytoma | Young adult | Lateral ventricles, septum pellucidum | "Bubbly," calcified, heterogeneous enhancing |
| Subependymoma | Middle-aged adults | 4th ventricle, lateral ventricles | Non-enhancing, very indolent |
| Choroid plexus papilloma | Children (<5 yrs) | Lateral ventricle trigone | Cauliflower, intense enhancement, hydrocephalus |
| Ependymoma | Children | 4th ventricle | Squeezes through foramina |
| SEGA | Children/adolescents | Foramen of Monro | Tuberous sclerosis |
| Colloid cyst | Middle-aged | Foramen of Monro | Hyperdense CT; blocks CSF → acute hydrocephalus |
14. ADVANCED MRI TECHNIQUES IN BRAIN TUMOR IMAGING
A. Diffusion-Weighted Imaging (DWI) / ADC
- Low ADC (restricted diffusion) = high cellularity = high grade
- Clinically key differentials:
- Ring-enhancing lesion + restricted center → Abscess (pus restricts)
- Ring-enhancing lesion + non-restricted center → GBM/metastasis (necrotic core = unrestricted)
- Solid homogeneous lesion + markedly restricted → PCNSL (hypercellular)
B. Perfusion MRI (DSC, DCE, ASL)
- DSC (Dynamic Susceptibility Contrast) - T2 perfusion*: Most validated; gives rCBV
- rCBV >1.75 → High grade glioma (sensitivity 95%)
- rCBV elevated in oligodendroglioma despite low grade (chicken-wire vasculature)
- rCBV low → PCNSL, metastasis (despite enhancement), radiation necrosis
- DCE (Dynamic Contrast-Enhanced) - T1 perfusion: Gives Ktrans, Ve (vessel permeability)
- ASL (Arterial Spin Labeling): No contrast; good for pediatric patients
C. MR Spectroscopy (MRS)
| Metabolite | Significance |
|---|---|
| Choline (Cho) | Membrane turnover; elevated in high-grade tumor |
| NAA (N-acetylaspartate) | Neuronal marker; reduced in tumor |
| Creatine (Cr) | Reference metabolite |
| Lipid/Lactate | Necrosis/anaerobic metabolism |
| 2-HG peak at 2.25 ppm | Specific for IDH-mutant gliomas |
- Key ratios: Cho/NAA > 2 = malignant; Cho/NAA > 3 = highly malignant
- MRS can detect tumor outside the enhancing margin
D. MR Perfusion + DWI + Spectroscopy Combined
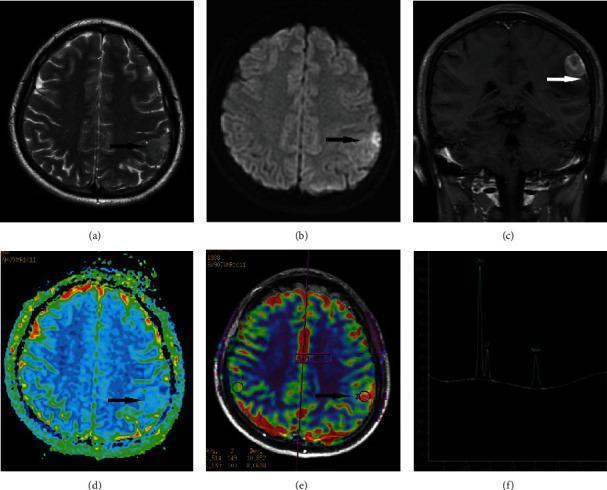
E. Tumor Microenvironment Mapping (Emerging)
F. Radiogenomics / Radiomics
- AI-based texture analysis can predict IDH status, MGMT methylation, 1p/19q codeletion non-invasively
- T2/FLAIR mismatch sign: T2 homogeneous high signal WITH FLAIR isointense "mismatch" = highly specific for IDH-mutant, 1p/19q intact astrocytoma (specificity >90%)
- Growing role in clinical practice and the 2021 WHO update has increased demand for radiomic biomarker integration
15. IMPORTANT DIFFERENTIAL DIAGNOSIS PEARLS
Ring-Enhancing Brain Lesion (RING)
| Cause | Key Clue |
|---|---|
| Glioblastoma | Irregular ring, T2 halo, solitary, WM |
| Radiation necrosis | Previous RT history; MRS lipid/lactate no Cho |
| Infection (abscess) | Thin smooth ring + DWI restricted center + fever |
| Neoplasm (metastasis) | GM-WM junction, multiple, known primary |
| Granuloma (TB/Toxo) | Smooth ring; contact history; HIV status |
| Demyelination (tumefactive MS) | Open ring (horseshoe) enhancement; white matter lesions elsewhere; young woman |
T2/FLAIR Mismatch Sign (High Yield)
- T2 bright + FLAIR relatively dark/isointense within the same lesion
- Specificity >90% for IDH-mutant, non-codeleted astrocytoma
- Easy to use, no contrast needed
Corpus Callosum Involvement
| Bilateral CC lesion | Diagnosis |
|---|---|
| "Butterfly" mass, heterogeneous | GBM |
| Periventricular, homogeneous, restricted DWI | PCNSL |
| Multiple ovoid lesions | Tumefactive MS (Dawson fingers) |
| Bilateral thalamic involvement | Diffuse midline glioma |
16. PEDIATRIC vs. ADULT BRAIN TUMORS - KEY DIFFERENCES
| Feature | Children | Adults |
|---|---|---|
| Most common location | Posterior fossa (infratentorial) | Supratentorial |
| Most common tumor | Pilocytic astrocytoma | Glioblastoma |
| Most common malignant | Medulloblastoma | Glioblastoma |
| Common entities | DIPG, ependymoma, ATRT | GBM, metastases, PCNSL |
| Molecular classification | Now critical (WHO 2021) | IDH, MGMT, 1p/19q |
17. IMAGING PROTOCOL RECOMMENDATION (For Your Department)
Standard Brain Tumor MRI Protocol:
- T1 3D (pre-contrast) - Anatomy baseline
- T2 Axial - Tumor delineation
- FLAIR Axial - Perilesional edema/infiltration
- DWI - Cellularity, abscess vs. tumor
- SWI/GRE - Hemorrhage, calcification, vessels
- T1+Gd 3D - Enhancement pattern (axial, coronal, sagittal)
- DSC Perfusion - rCBV for grading
- MRS (single or multivoxel) - Metabolite profile
18. TREATMENT RESPONSE CRITERIA - RANO
- Bidirectional enhancement measurements
- Non-enhancing T2/FLAIR changes
- Treatment timing context (pseudoprogression window = first 12 weeks post-RT)
- Modified RANO-HGG for high-grade, RANO-LGG for low-grade
19. SUMMARY TABLE - INTRA-AXIAL TUMOR AT A GLANCE
| Tumor | Age | Location | CT | T2 | Enhancement | DWI | rCBV | Key Feature |
|---|---|---|---|---|---|---|---|---|
| GBM | 55-75 | WM/deep | Hypodense+ring | Heterogeneous | Irregular ring | + restricted | High | Necrosis, T2 halo with tumor |
| Astrocytoma IDH-mut | 30-40 | Frontal WM | Hypodense | Homogeneous bright | None/faint | - | Low-mod | T2/FLAIR mismatch |
| Oligodendroglioma | 35-45 | Frontal cortex | Calcified | Heterogeneous | Variable | - | Elevated | Calcification + cortical |
| Pilocytic | <20 | Cerebellum | Cyst+nodule | Cyst T2 bright | Nodule avid | - | Low | Cyst+nodule pattern |
| DNET | <30 | Temporal cortex | Hypodense | Bubbly bright | None | - | Low | No edema, no mass effect |
| Medulloblastoma | 5-7 | Vermis/4th V | Hyperdense | Iso/hypointense | Moderate | Mod | Very restricted | Drop mets, hyperdense CT |
| Ependymoma | 5-10 | 4th ventricle | Calcified | Heterogeneous | Moderate | - | Low | Squeezes through foramina |
| PCNSL | 50-70 | BG/periventricul | Hyperdense | Iso/hypointense | Homogeneous | ++ restricted | Low-mod | Ghost sign, steroids |
| Metastasis | >40 | GM-WM junction | Variable | Vasogenic edema | Ring/solid | - (center) | Variable | Multiple, known primary |
| GCT/Ganglioglioma | 10-30 | Temporal | Calcified | Heterogeneous | Variable | Low | Low | Chronic epilepsy |
20. EXTRA TOPICS TO INCLUDE IN YOUR SEMINAR
A. Leptomeningeal Disease
- Tumors that spread via CSF: Medulloblastoma, ependymoma, GBM (rare), PCNSL, breast/lung mets
- MRI: Leptomeningeal enhancement on post-Gd T1 FLAIR sequence
- Post-Gd FLAIR is more sensitive than post-Gd T1 for leptomeningeal mets
B. Stereotactic Biopsy Targeting
- Avoid the necrotic center - biopsy the enhancing rim or highest rCBV area
- Perfusion-guided biopsy improves diagnostic yield
C. Post-Treatment Imaging Challenges
- Pseudoprogression vs. true progression: MRS (low Cho = necrosis, high Cho = tumor), DSC perfusion (low rCBV = treatment effect)
- LITT (Laser Interstitial Thermal Therapy): New ablative technique; post-treatment MRI shows a "treatment zone" with rim enhancement and central necrosis - recent AJNR review (2025) covers what the neuroradiologist should know
D. Functional Imaging for Pre-Surgical Planning
- fMRI: Maps motor, language, visual cortex relative to tumor
- DTI/tractography: Corticospinal tract, arcuate fasciculus - preserve eloquent tracts
- These are integral parts of the pre-operative radiology workup for intra-axial tumor surgery
E. PET Imaging in Brain Tumors
- FDG-PET: Limited due to high background glucose uptake in brain
- FET-PET (fluoroethyl-tyrosine): Amino acid PET - excellent for tumor delineation, recurrence vs. necrosis
- FDOPA-PET: Best for differentiating recurrence from treatment effects; note carbidopa effect on background
- PET/MRI fusion gives best of both worlds
KEY TAKE-HOME MESSAGES FOR YOUR SEMINAR
-
WHO 2021 changed everything - molecular markers are now primary, histology is secondary. Reports must mention IDH, 1p/19q, MGMT.
-
Enhancement does NOT equal malignancy - 30-40% of GBMs may not enhance early; IDH-mutant Grade 2 gliomas rarely enhance. - Grainger & Allison's Diagnostic Radiology
-
The T2/FLAIR halo of GBM always contains infiltrating tumor cells - surgical margins must extend beyond enhancement.
-
T2/FLAIR mismatch sign = IDH-mutant non-codeleted astrocytoma with >90% specificity.
-
PCNSL disappears with steroids - the "ghost tumor" - never give steroids before biopsy.
-
DWI is your grading tool: PCNSL (most restricted) > Medulloblastoma > GBM solid areas > Low-grade glioma.
-
rCBV > 1.75 = high grade (except oligodendroglioma which is falsely elevated).
-
Medulloblastoma in the vermis + T2 hypointense + restricted DWI + drop mets = diagnosis.
-
Gray-white matter junction + multiple lesions + vasogenic edema = Metastases until proven otherwise.
-
Pseudoprogression and pseudoresponse are the radiologist's biggest challenge in neuro-oncology follow-up.
Why not showing
- The images not rendering/displaying in the previous response?
- A specific section or topic that was missing from the seminar content?
- Something else entirely?
- GBM MRI (T2, post-Gd T1, ADC) from Grainger & Allison's Radiology
- IDH-wildtype astrocytoma MRI (4-panel: T2, T1+Gd, DWI, ADC)
- Tumor microenvironment comparison (GBM vs Metastasis vs PCNSL vs Meningioma)
- Multiparametric MRI profile (DWI, PWI, MRS)
- PCNSL and CNS lymphoma comparison
The details
- A specific tumor - e.g., "details about ependymoma are not enough" or "hemangioblastoma is missing"
- A specific section - e.g., "imaging protocol details," "pathology details," "treatment details"
- A specific aspect - e.g., "CT findings not detailed enough," "molecular markers not explained," "pediatric tumors section too brief"
- Something that was cut off - the response was very long; did it get truncated at a certain point?
Expand imaging details (CT, MRI sequences, DWI/PWI/MRS findings) for each tumor type
glioblastoma MRI T1 T2 FLAIR DWI ADC perfusion spectroscopy ring enhancement
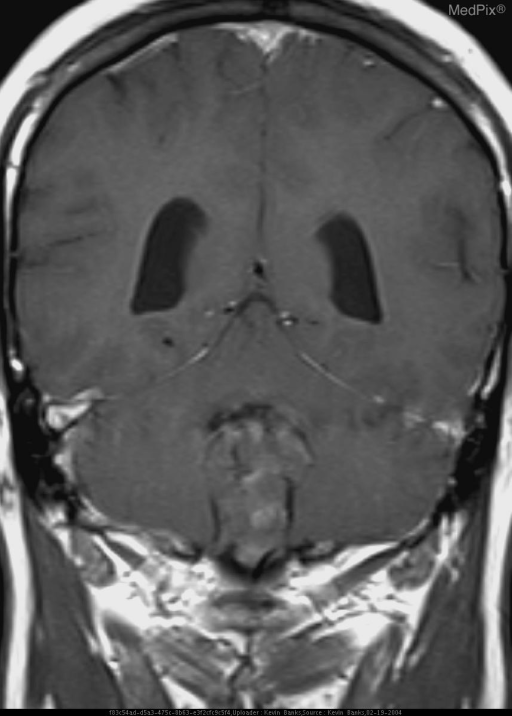
ependymoma fourth ventricle MRI heterogeneous enhancement foramina
pilocytic astrocytoma cerebellum MRI cyst mural nodule enhancement
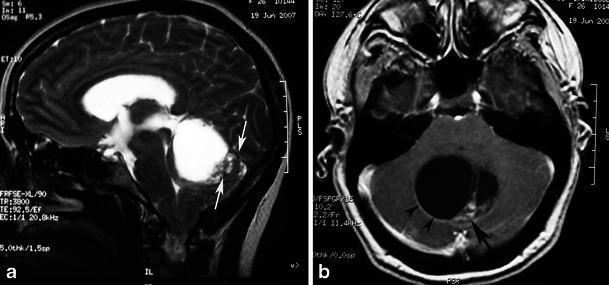
This diagnostic image set consists of two MRI scans demonstrating a pilocytic astrocytoma in the posterior fossa of a 26-year-old female. Image (a) is a sagittal T2-weighted MRI showing a large, well-circumscribed, hyperintense cystic mass located in the cerebellar vermis. A distinct, peripherally situated mural nodule (indicated by arrows) is visible on the posterior aspect of the cyst, which is causing significant mass effect and compression of the fourth ventricle. Image (b) is an axial contrast-enhanced T1-weighted MRI at the level of the cerebellum. It demonstrates the classic enhancement pattern of this pathology: the mural nodule (arrow) shows intense, homogeneous contrast uptake, and there is also smooth enhancement along the cyst wall (arrowheads). These features are hallmark diagnostic criteria for a WHO Grade I pilocytic astrocytoma. The clinical significance of these images lies in demonstrating the relationship between the cystic component, the enhancing solid nodule, and the resultant obstructive pressure on adjacent ventricular structures.
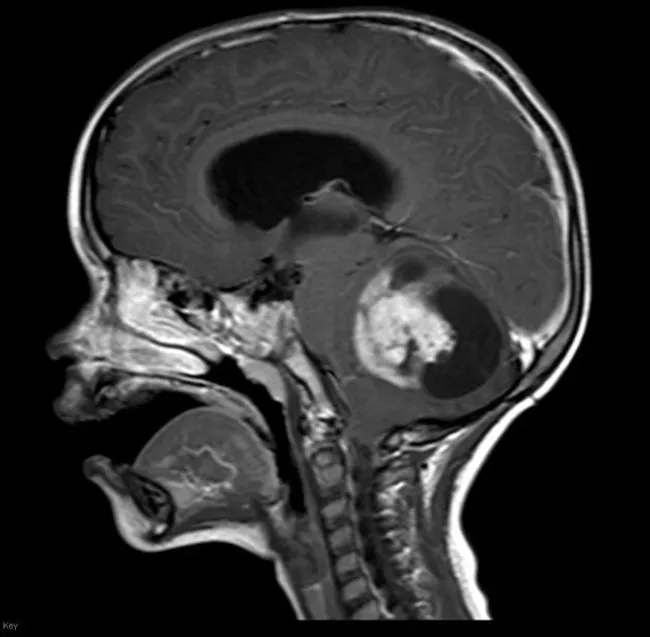
Sagittal gadolinium enhanced MRI of the brain in a 3 year old male demonstrates a large cystic lesion in the cerebellum with a conspicuously enhancing mural nodule. The mass is located in the posterior fossa, displacing adjacent cerebellar tissue and potentially affecting CSF pathways. The imaging signature, a cystic lesion with a solid, brightly enhancing mural nodule, is a classic pattern for pilocytic astrocytoma (juvenile pilocytic astrocytoma, JPA) in children. On T1 and T2 weighted sequences the cyst component typically shows low to intermediate signal with the mural nodule displaying solid enhancement after contrast administration. The border is well circumscribed, and peritumoral edema is minimal, reflecting a low grade glioma. Differential considerations include medulloblastoma and ependymoma, but age, tumor location, and the cyst plus nodule morphology strongly favor PA. Clinically, this pattern guides surgical planning toward maximal safe resection, which offers favorable prognosis in pediatric PA. Correlation with histology would reveal biphasic pilocytic architecture and Rosenthal fiber positive astrocytic cells. This case courtesy of Radiopaedia serves as an educational example of posterior fossa cystic neoplasms in children. Keywords: pediatric brain tumor, cerebellar tumor, posterior fossa, cystic lesion, enhancing mural nodule, gadolinium, MRI, prognosis, resection. Educationally relevant for learners and clinicians worldwide.
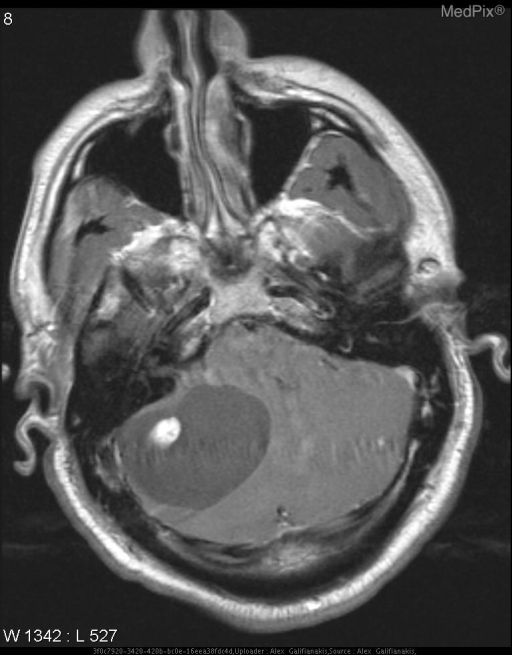
**Imaging Modality:** Magnetic Resonance Imaging (MRI), T1-weighted axial sequence with gadolinium contrast enhancement.
primary CNS lymphoma MRI DWI restricted diffusion periventricular homogeneous enhancement
EXPANDED IMAGING DETAILS: INTRA-AXIAL BRAIN TUMORS
Sequence-by-Sequence Radiology Reference Guide
1. GLIOBLASTOMA (GBM, WHO Grade 4, IDH-wildtype)
CT
| Finding | Detail |
|---|---|
| Unenhanced | Large, heterogeneous hypodense mass in white matter |
| Hyperdense foci | Intratumoral hemorrhage or highly cellular areas |
| Calcification | Rare (<5%) - if present, suggests secondary GBM |
| Edema | Prominent perilesional hypodensity (vasogenic) |
| Mass effect | Midline shift, sulcal effacement, uncal herniation |
| Enhancement | Irregular, thick, nodular ring enhancement |
MRI - Sequence by Sequence
| Sequence | Appearance |
|---|---|
| T1 pre-Gd | Hypointense mass with central dark necrotic core |
| T2 | Heterogeneous high signal; surrounding T2/FLAIR halo extends far beyond tumor |
| FLAIR | The surrounding high signal zone ALWAYS contains infiltrating tumor cells - not merely edema |
| T1+Gd | Thick, irregular, nodular ring enhancement around a necrotic core; sometimes solid or multi-ring |
| SWI/GRE | Blooming/susceptibility artifact from microhemorrhage, necrotic debris |
| DWI | Restricted diffusion (bright DWI, dark ADC) in hypercellular solid components and necrotic rim |
| ADC map | Low ADC in solid tumor rim; necrotic center shows unrestricted (high) ADC |
Advanced MRI
- Markedly elevated rCBV in the enhancing rim (typically >3-5x normal)
- rCBV >1.75 cutoff: sensitivity 95% for high-grade glioma
- Perfusion helps target biopsy to the highest-grade component
- Markedly elevated Cho (choline - membrane turnover)
- Markedly reduced NAA (neuronal loss)
- Cho/NAA ratio >3 = highly malignant
- Prominent Lipid and Lactate peaks = necrosis + anaerobic metabolism
- Key: MRS abnormality extends BEYOND the enhancing margin into T2 halo
- Maps eloquent cortex (motor strip, Broca's/Wernicke's) relative to tumor
- DTI shows CST displacement (resectable) vs. infiltration (higher surgical risk)
2. IDH-WILDTYPE ASTROCYTOMA (WHO Grade 2-3, Non-GBM)
CT
- Hypodense infiltrative mass, often without calcification
- Variable or absent enhancement
- Can look like a low-grade glioma - molecular testing required for diagnosis
MRI Sequence by Sequence
| Sequence | Appearance |
|---|---|
| T1 | Hypointense, ill-defined |
| T2 | Heterogeneous high signal, ill-defined margins |
| FLAIR | Persistent high signal (no mismatch - contrast with IDH-mutant astrocytoma) |
| T1+Gd | Variable - may show no enhancement even at Grade 3 |
| DWI | Low-level restriction; may be subtly reduced ADC compared to IDH-mutant |
Advanced MRI
- rCBV: Elevated even without enhancement - reflects neovascularity
- MRS: Elevated Cho, reduced NAA; absence of 2-HG peak (present in IDH-mutant)
- Imaging biomarkers (multifocality, ill-defined margins, elevated perfusion) aid early identification
3. ASTROCYTOMA, IDH-MUTANT (Grade 2, 3, 4)
CT
- Hypodense, cortical/subcortical location
- Calcification uncommon
- Grade 2: No enhancement; Grade 3: possible faint enhancement; Grade 4 (IDH-mutant GBM): ring enhancement
MRI Sequence by Sequence
| Sequence | Appearance |
|---|---|
| T1 | Hypointense, well-defined |
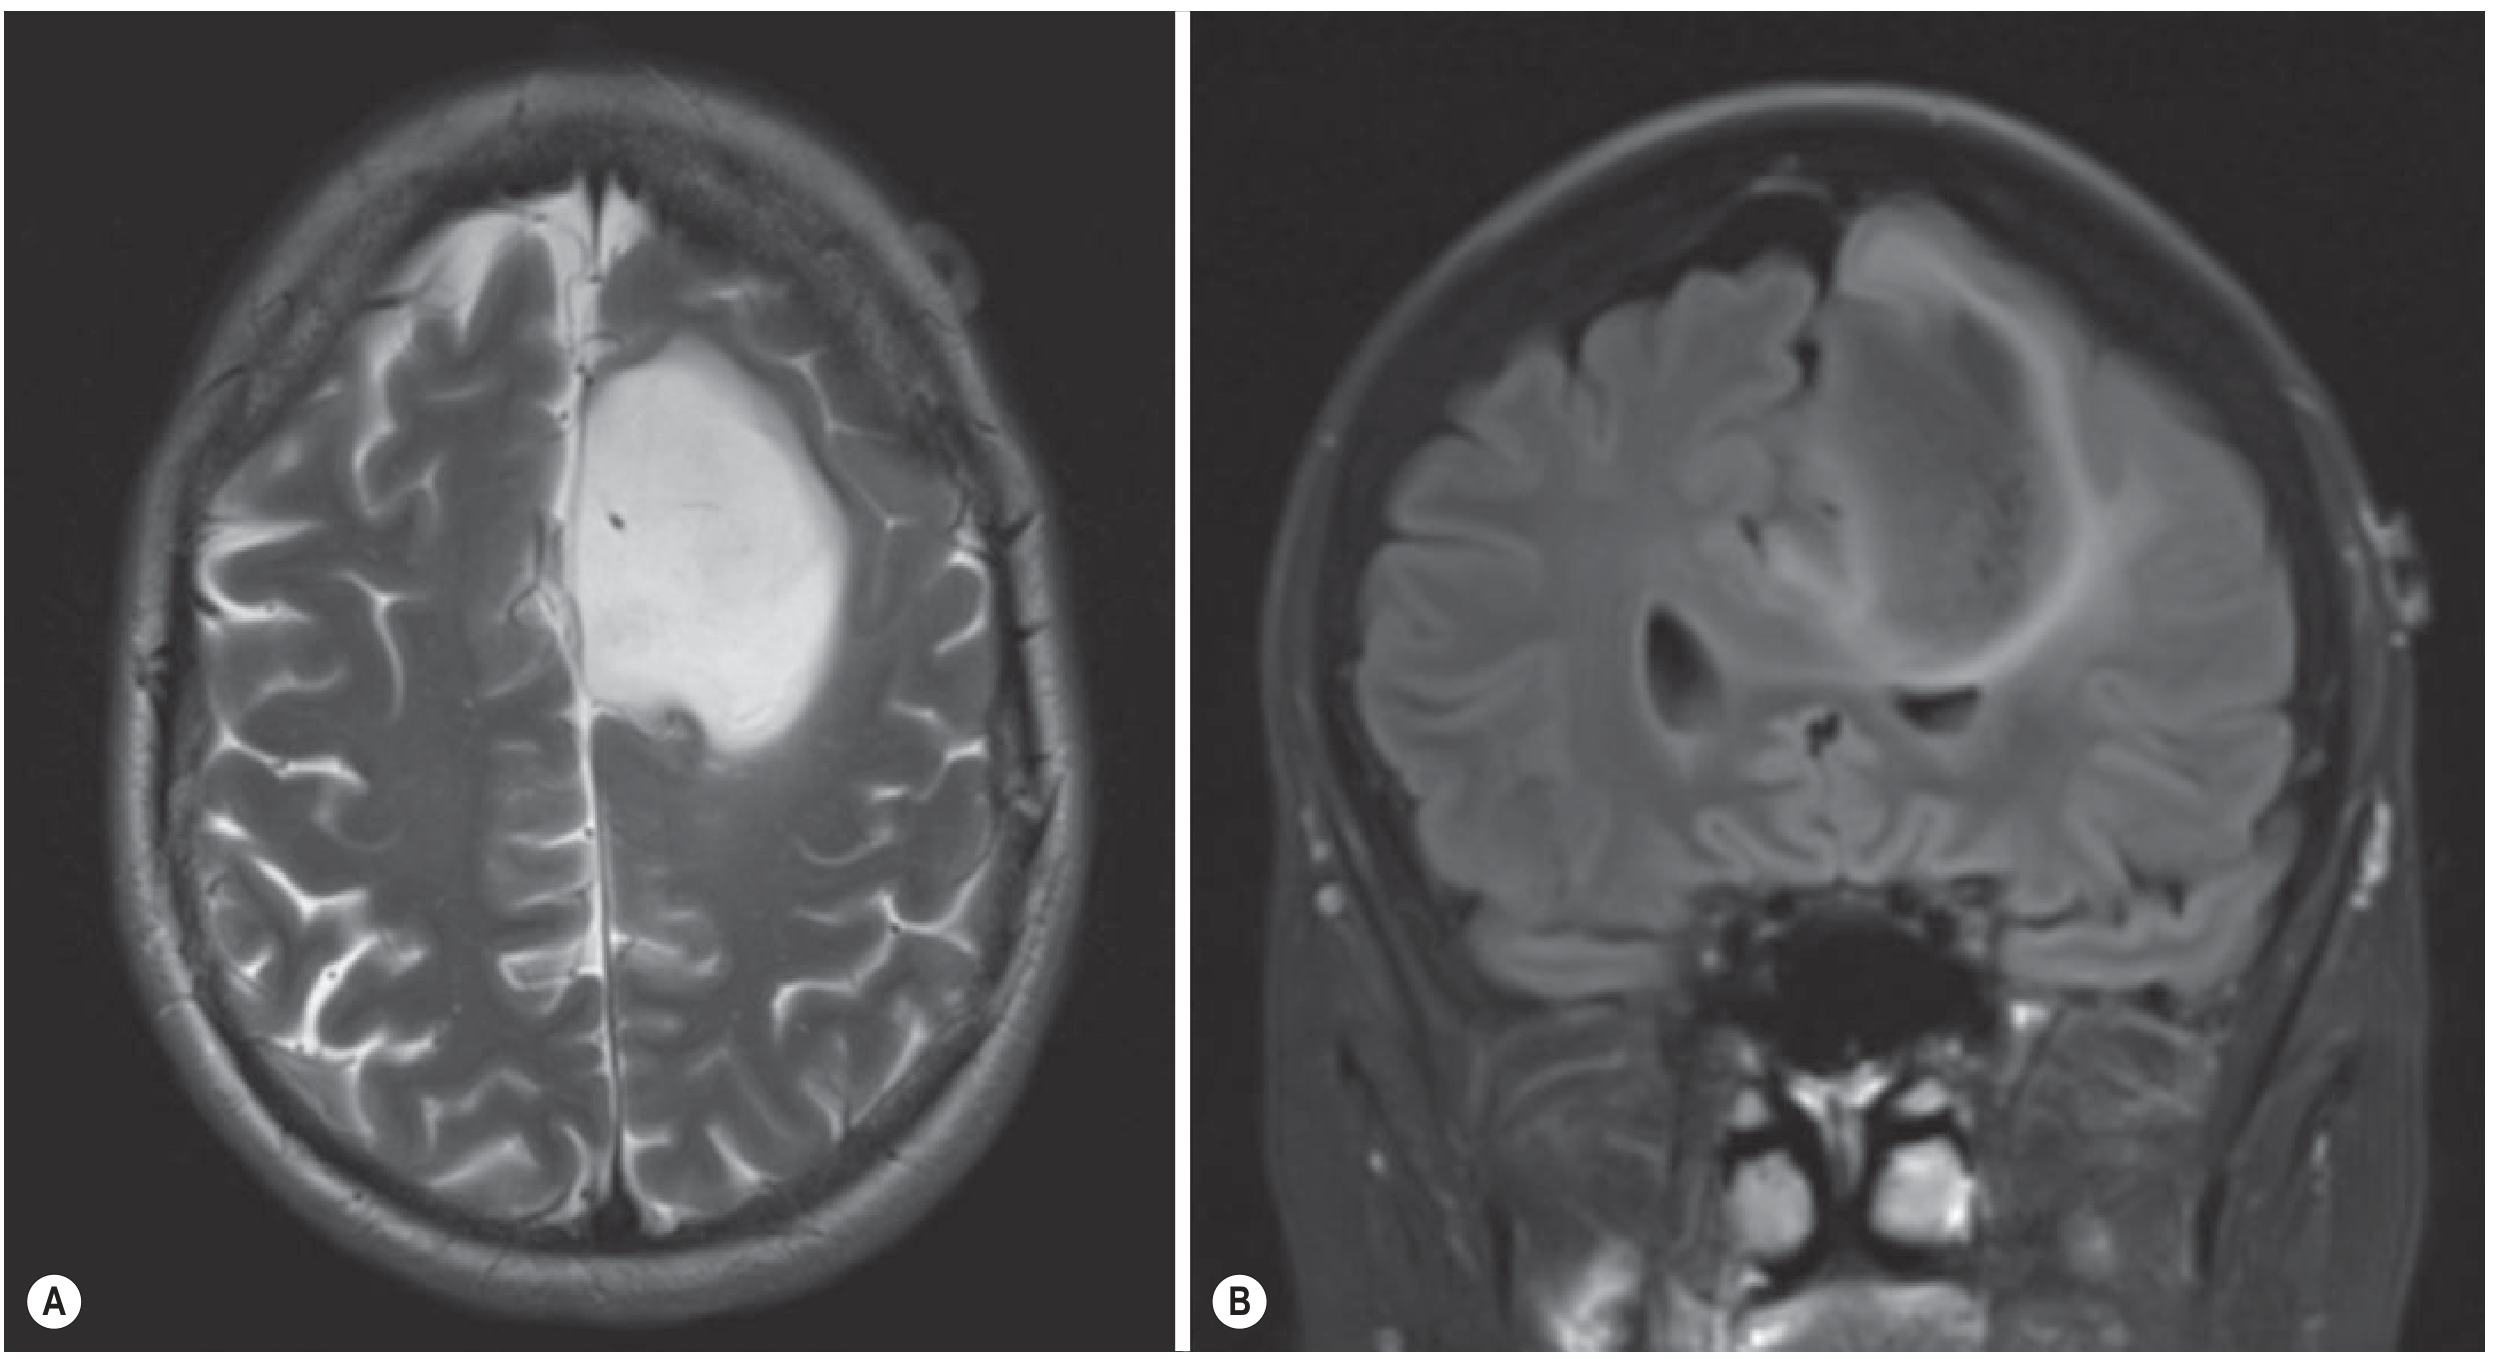
| T2 | Homogeneous, markedly hyperintense - classic |
| FLAIR | THE KEY SIGN: Reduced/isointense FLAIR signal within markedly T2 hyperintense lesion = T2/FLAIR Mismatch Sign |
| T1+Gd | Grade 2: No enhancement (key feature); Grade 3: patchy/focal enhancement signals anaplastic transformation |
| DWI | No significant restriction in low grade; restriction increases with grade |
Advanced MRI
- Elevated Cho, reduced NAA
- 2-HG peak at 2.25 ppm: Specific for IDH-mutant tumors (detected on special MRS sequences at 3T)
- No lipid/lactate at low grade Key: New enhancement in a previously non-enhancing IDH-mutant astrocytoma = malignant transformation
4. OLIGODENDROGLIOMA (IDH-mutant + 1p/19q codeleted, Grade 2-3)
CT
- Cortically based hypodense mass, predominantly frontal lobe
- Calcification in up to 90%: coarse, irregular, ribbon-like, or gyriform - best seen on CT
- Patchy, irregular enhancement in ~20% of Grade 2; more common in Grade 3
- Cysts present
MRI Sequence by Sequence
| Sequence | Appearance |
|---|---|
| T1 | Hypointense; calcification may appear T1 hyperintense |
| T2 | Heterogeneous hyperintensity; involves cortex + subcortical WM |
| FLAIR | High signal; cortical involvement prominent |
| SWI/GRE | Blooming artifact from calcification (T2 hypo + T1 hyper + SWI dark) - key feature |
| T1+Gd | Variable enhancement; lack of enhancement does NOT exclude Grade 3 |
| DWI | Usually no restriction in low grade; restriction suggests anaplasia |
Advanced MRI
- Elevated myo-inositol/glycine, glutamine, glutamate - hallmark of oligodendroglial elements
- Where rCBV is non-specifically raised, MRS helps identify Grade 3 through lipid/lactate peaks
- Cho/NAA elevated but less than GBM
5. DIFFUSE MIDLINE GLIOMA (H3 K27M-mutant, Grade 4)
CT
- Diffuse, infiltrating, poorly defined hypo/isodense mass expanding the pons/thalamus
- Enhancement variable or absent
MRI Sequence by Sequence
| Sequence | Appearance |
|---|---|
| T1 | Hypointense, poorly defined, expands the structure (pons "engulfed") |
| T2 | Diffuse, high signal throughout affected structure |
| FLAIR | Diffuse signal abnormality |
| T1+Gd | Variable: patchy, focal, or absent enhancement - enhancement does NOT indicate higher grade |
| DWI/ADC | Variable; restricted areas suggest more aggressive foci |
Advanced MRI
- MRS: Elevated Cho/Cr; reduced NAA; Lipid/lactate in aggressive foci
- Classic DIPG MRI: Diffuse pontine expansion, wraps around basilar artery, engulfs the pons, variable enhancement
6. PILOCYTIC ASTROCYTOMA (WHO Grade 1)
CT
- Well-circumscribed cystic or cyst-with-nodule mass
- Cyst: hypodense; nodule: iso/hyperdense
- Calcification in ~20%
- Vivid enhancement of solid nodule
MRI Sequence by Sequence
| Sequence | Appearance |
|---|---|
| T1 | Hypointense cyst; isointense mural nodule |
| T2 | Cyst: hyperintense (similar to CSF but slightly higher signal); Nodule: heterogeneous |
| FLAIR | Cyst: hypointense (unlike tumor); Nodule: high signal |
| T1+Gd | Avid, homogeneous enhancement of mural nodule only; cyst wall does NOT enhance |
| DWI | No restriction in nodule (low grade) |
Advanced MRI
- PWI (rCBV): Low - distinguishes from hemangioblastoma (which has very high rCBV despite similar appearance)
- MRS: Mildly elevated Cho; reduced NAA; characteristic myoinositol peak; no lipid/lactate
- Choline/NAA: Elevated but much less than malignant tumors
7. PLEOMORPHIC XANTHOASTROCYTOMA (PXA)
CT
- Cortically based, often cystic, temporal lobe
- Calcification in ~40%
- Enhancement of solid component
MRI Sequence by Sequence
| Sequence | Appearance |
|---|---|
| T1 | Hypointense solid component; cyst present in >50% |
| T2 | T2 hyperintense solid portion (despite xanthomatous/fatty nature, does NOT show T1 fat signal) |
| FLAIR | High signal in solid component |
| T1+Gd | Vivid enhancement of solid nodule; may show pseudodural tail - mimics meningioma |
| DWI | No restriction at Grade 2 |
Advanced MRI
- rCBV: Moderately elevated in solid component
- MRS: Elevated Cho, reduced NAA; lipid/lactate in anaplastic variant
8. MEDULLOBLASTOMA (WHO Grade 4, Pediatric)
CT - Highly Characteristic
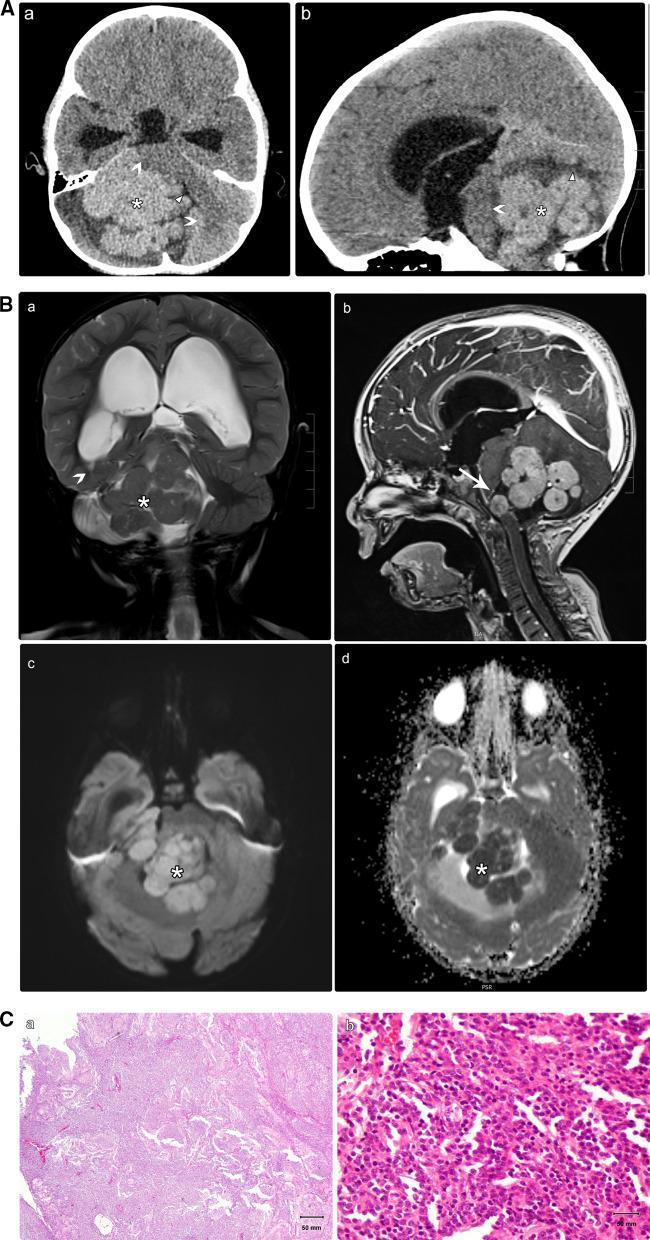
- Hyperdense vermian mass (this CT hyperdensity is the most reliable early differentiator)
- The hyperdensity reflects high nuclear:cytoplasmic ratio and densely packed cells
- Cystic change, hemorrhage, and calcification frequently seen
- Hydrocephalus common (obstructing 4th ventricle)
- Enhancement: variable, patchy
MRI Sequence by Sequence
| Sequence | Appearance |
|---|---|
| T1 | Hypointense to isointense |
| T2 | Iso to hypointense relative to grey matter - key differentiator (compare: pilocytic = T2 bright) |
| FLAIR | Isointense or mildly hyperintense |
| T1+Gd | Moderate to avid heterogeneous enhancement |
| DWI | Markedly restricted diffusion - very high DWI signal, very low ADC - most reliable imaging feature |
| ADC | ADC value profoundly reduced (often among the lowest of all brain tumors) |
Advanced MRI
- Reduced NAA (neuronal loss)
- Elevated Cho/Cr ratio
- Elevated taurine peak (relatively specific for medulloblastoma vs. other posterior fossa tumors)
- Lactate and lipid peaks present
9. EPENDYMOMA
CT
- Iso to hyperdense 4th ventricular mass
- Calcification in ~50% - punctate, peripheral
- Hemorrhage in ~10%
- Enhancement: moderate, heterogeneous
MRI Sequence by Sequence
| Sequence | Appearance |
|---|---|
| T1 | Heterogeneous iso/hypointense |
| T2 | Heterogeneous hyperintensity with mixed cystic, solid, hemorrhagic components ("salt and pepper") |
| FLAIR | High signal; heterogeneous |
| T1+Gd | Moderate, heterogeneous enhancement |
| DWI | Variable, mild restriction (less than medulloblastoma) |
| SWI | Blooming from calcification + microhemorrhage |
The "Plastic/Toothpaste" Growth Pattern - High Yield
Advanced MRI
- MRS: Elevated Cho; reduced NAA; increased myoinositol
- rCBV: Low to moderate
- Spine MRI: Required at staging - leptomeningeal drop metastases occur in ~12%
10. PRIMARY CNS LYMPHOMA (PCNSL)
CT
- Hyperdense (spontaneously) relative to white matter - reflects hypercellularity, high nuclear:cytoplasmic ratio
- Periventricular, basal ganglia, or corpus callosum involvement
- Homogeneous enhancement in immunocompetent; ring enhancement in immunocompromised
MRI Sequence by Sequence
| Sequence | Appearance |
|---|---|
| T1 | Isointense to hypointense |
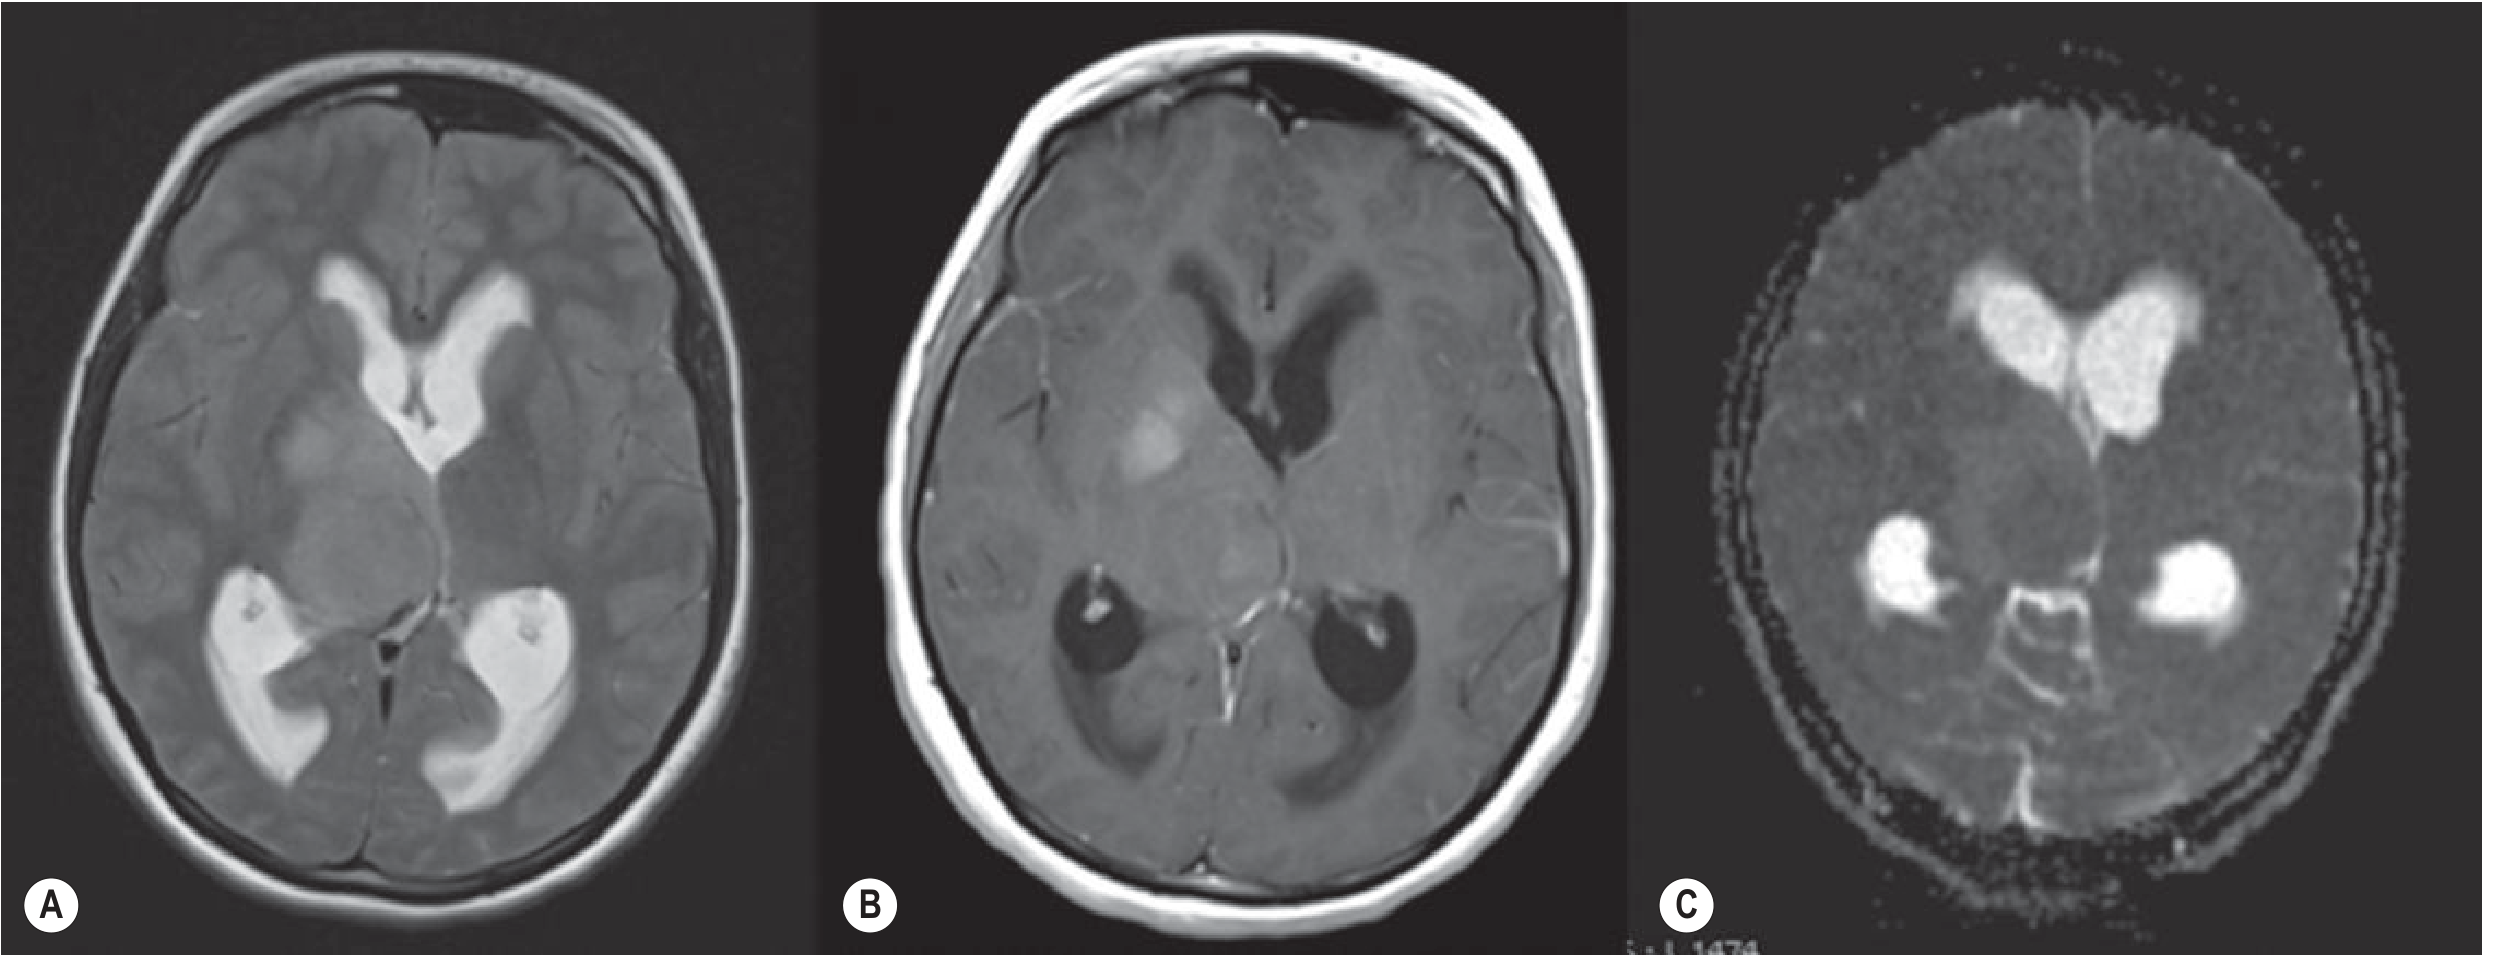
| T2 | Isointense to hypointense - this is the KEY teaching point; most tumors are T2 bright, PCNSL is NOT |
| FLAIR | Periventricular high signal; mass often isointense |
| T1+Gd | Homogeneous, avid, "fluffy" enhancement in immunocompetent patients |
| DWI | Markedly restricted diffusion - ADC very low (second most restricted after medulloblastoma) |
| ADC | Very low (<700 x10-6 mm²/s in most series) |
| SWI | Rarely hemorrhagic (unlike GBM) - absence of blooming helps |
Advanced MRI
- Low to moderate - paradoxically LOW for such an aggressively enhancing tumor
- Mechanism: PCNSL lacks significant neovascularity/angiogenesis (unlike GBM)
- This is a critical differentiator: Ring-enhancing lesion + restricted DWI + LOW rCBV = PCNSL
- Elevated Cho/Cr
- Reduced NAA
- Large lipid peak - characteristic; differentiates from toxoplasmosis (which lacks this)
- Elevated lactate
11. BRAIN METASTASES
CT
- Variable density; usually iso/hypodense
- Hyperdense without contrast: melanoma, hemorrhagic mets (RCC, choriocarcinoma, thyroid)
- Ring or solid enhancement - small mets may only show punctate enhancement
- Disproportionately large vasogenic edema relative to small enhancing nodule - classic!
- Location: Gray-white matter junction (embolic trapping at vessel caliber change)
MRI Sequence by Sequence
| Sequence | Appearance |
|---|---|
| T1 pre-Gd | Usually hypointense; T1 hyperintense: melanoma (melanin/hemorrhage), mucin-producing mets |
| T2 | Variable; surrounded by extensive vasogenic edema (finger-like, bright) |
| FLAIR | Extensive surrounding edema; the lesion itself may be isointense |
| T1+Gd | Ring (large mets) or solid (small mets) enhancement; multiple lesions should prompt metastasis search |
| SWI | Blooming in hemorrhagic mets (melanoma, RCC, choriocarcinoma) |
| DWI | Typically no restriction in the central necrotic cavity (unrestricted - unlike abscess which restricts) |
| ADC | High ADC in necrotic center; reduced in solid hypercellular areas |
Advanced MRI
- Elevated in solid tumor portions (hypervascular primaries like RCC = very high rCBV)
- The rCBV drops sharply at the tumor-brain interface (unlike GBM which shows elevated rCBV in surrounding T2 halo)
- Elevated Cho in solid components
- Reduced/absent NAA (no neurons within metastatic lesion)
- Choline outside enhancing margin is absent - helps differentiate from GBM (which has elevated Cho even in non-enhancing T2 halo)
- Lipid/lactate in necrotic areas
- In GBM: Cho is elevated within the T2/FLAIR halo beyond the enhancement
- In metastasis: Cho is normal in the surrounding edema - the edema is "pure" vasogenic edema without tumor infiltration
12. GANGLIOGLIOMA & DNET (Glioneuronal Tumors)
GANGLIOGLIOMA
- Cortically based hypodense mass, temporal lobe predominance
- Calcification in ~35-50%
- Enhancement: variable nodular or peripheral
| Sequence | Appearance |
|---|---|
| T1 | Hypointense; cyst component dark |
| T2 | Hyperintense solid and cystic components; mixed signal |
| FLAIR | High signal |
| T1+Gd | Variable - peripheral or nodular enhancement in ~50% |
| DWI | No restriction (low grade) |
- rCBV: Low (Grade 1)
- MRS: Mildly elevated Cho; reduced NAA
DNET (Dysembryoplastic Neuroepithelial Tumor)
- Hypodense cortical mass, temporal or frontal
- Calcification in ~25%
- No mass effect, no edema
| Sequence | Appearance |
|---|---|
| T1 | Hypointense cortical lesion |
| T2 | Bright, multicystic "bubbly" appearance - pseudomultiple cysts (micronodular) |
| FLAIR | Cortical high signal; characteristic peripheral hypointense rim (glial rim) |
| T1+Gd | Usually no enhancement - lack of enhancement in a young patient with epilepsy strongly suggests DNET |
| DWI | No restriction |
- Young patient with chronic partial seizures
- Cortical, bubbly T2 hyperintense mass
- No edema, no mass effect, no enhancement
13. HEMANGIOBLASTOMA (Common Adult Posterior Fossa Tumor)
CT
- Cystic mass with iso/hyperdense nodule (highly vascular)
- Avid enhancement of solid nodule
MRI Sequence by Sequence
| Sequence | Appearance |
|---|---|
| T1 | Cyst dark; solid nodule iso/hypointense |
| T2 | Cyst bright; nodule with prominent flow voids (vascular channels) |
| FLAIR | Cyst: hypointense (near CSF signal) |
| T1+Gd | Intensely enhancing solid nodule; cyst wall does NOT enhance |
| DWI | No restriction |
| MRA/SWI | Prominent internal vascularity, flow voids |
Advanced MRI
- rCBV: Very high - highest of the cyst+nodule tumors; far exceeds pilocytic astrocytoma
- This is the key PWI differentiator: Hemangioblastoma (very high rCBV) vs. Pilocytic (low rCBV) - both show cyst+nodule pattern in posterior fossa
MASTER COMPARISON TABLE: ADVANCED IMAGING PARAMETERS
| Tumor | DWI Restriction | ADC | rCBV | MRS Key Features | SWI |
|---|---|---|---|---|---|
| GBM | + (rim) | Low rim; High core | Very High (>3) | Cho↑↑, NAA↓↓, Lip/Lac↑↑ | Blooming (blood) |
| Astrocytoma IDH-mut | - | Normal/high | Low-Mod | Cho↑, NAA↓, 2-HG peak | Rare |
| Oligodendroglioma | - | Normal | Elevated (paradox) | myo-inositol↑, Glu↑ | Blooming (calcification) |
| Pilocytic Astro | - | High | Low | Cho↑, NAA↓, myo-inositol↑ | Rare |
| DNET | - | High | Low | Normal/mild Cho↑ | Rare |
| Medulloblastoma | +++ | Very Low | Moderate | NAA↓↓, Tau↑, Lac/Lip↑ | Rare |
| Ependymoma | +/- | Mildly low | Low-Mod | Cho↑, myo-inositol↑ | Blooming (Ca++) |
| PCNSL | ++ | Very Low | Low-Mod | Cho↑↑, Lip↑↑, NAA↓↓ | No blooming |
| Metastasis | - (center) | High (center) | Elevated | Cho↑ (solid only); Normal halo | Variable |
| Hemangioblastoma | - | High | Very High | Mild Cho↑ | Flow voids |
| Ganglioglioma | - | Normal | Low | Mild Cho↑, NAA↓ | Ca++ blooming |
| GBM IDH-wt | + | Low | Very High | Cho↑↑, NAA↓↓, 2-HG absent | Blooming (blood) |
QUICK-REFERENCE: DWI RESTRICTION LADDER (Most to Least)
MOST RESTRICTED
     |
     1. PCNSL (hypercellular lymphoma)
     2. Medulloblastoma (small round blue cells)
     3. GBM solid rim (hypercellular)
     4. Cerebral abscess (pus - viscous fluid)
     5. Epidermoid cyst (squamous debris)
     6. Ependymoma (mild)
     7. Low-grade glioma / metastasis necrotic core
     |
LEAST RESTRICTED
QUICK-REFERENCE: rCBV LADDER (Perfusion - Most to Least)
HIGHEST rCBV
     |
     1. Hemangioblastoma
     2. GBM / High-grade glioma
     3. Oligodendroglioma (paradoxically high for low grade)
     4. Brain metastasis (hypervascular primaries: RCC)
     5. PCNSL (surprisingly LOW despite enhancement)
     6. Pilocytic astrocytoma
     7. IDH-mutant low-grade astrocytoma
     8. DNET / Ganglioglioma
     |
LOWEST rCBV
POST-TREATMENT IMAGING: WHEN SEQUENCES LIE
| Phenomenon | Timing | Imaging | Key Differentiator |
|---|---|---|---|
| Pseudoprogression | Within 12 weeks of RT+TMZ | New/increasing enhancement | MRS: lipid/lactate dominant, low Cho = treatment effect |
| Pseudoresponse | Anti-VEGF therapy | Decrease in enhancement; tumor grows as T2/FLAIR | FLAIR progression despite enhancement decrease |
| Radiation necrosis | 6+ months post-RT | Ring/solid enhancement, edema | rCBV low; MRS: lipid/lactate but NO Cho; PET: FDG/FET hypometabolic |
| True progression | Any time | New enhancing lesion beyond margins | rCBV high; Cho elevated; PET: hypermetabolic |
- Elevated Cho = active tumor
- Elevated Lipid/Lactate with NO Cho = radiation necrosis
- Intermediate pattern with BOTH = mixed response (most common)
Not showing
). If your interface doesn't render markdown images, they will appear as text/broken links. This is a platform/interface limitation, not a content issue.No response
-
Did my last reply not load fully? - The response was very long; sometimes long responses get cut off on mobile or slow connections. Try scrolling up or refreshing.
-
Did a specific question of yours go unanswered? - Please re-ask it and I'll answer directly.
-
Is the chat interface not working properly? - Try refreshing the page and sending your message again.
-
Are you asking me to provide something new? - Please tell me what you need and I'll respond immediately.
Generate a PowerPoint presentation on intra-axial tumors with images
ls /tmp/workspace/ 2>/dev/null || mkdir -p /tmp/workspace/intraaxial-pptx && echo "ready"
mkdir -p /tmp/workspace/intraaxial-pptx && python /tmp/skills/shared/scripts/fetch_images.py \ "https://cdn.orris.care/cdss_images/021e540005efca79912c3154bc37e48ca8b100aaefcf5892dd6b5e20fd3901fa.png" \ "https://cdn.orris.care/cdss_images/561d94f0b5f5c700026f3c8687e5bfd9f39898de0699a558f1584fd1fe3cd6e7.png" \ "https://cdn.orris.care/cdss_images/01145b1bd0b4929fdd8dc1feba434bc259d1c9b2d1b179cce8d39fbb6a1984a6.png" \ "https://cdn.orris.care/cdss_images/pmc_clinical_VQA_25925ee83d829bc1aa8ea84ae2ff7d26305fd2d212197dcffd1c5c3953722597.jpg" \ "https://cdn.orris.care/cdss_images/pmc_clinical_VQA_419dd276fc104c4b2cca7ceb9ad62b152b85c35e2b2cd10d9dd8d310e263e106.jpg" \ "https://cdn.orris.care/cdss_images/5db20ebd78732f9c63a61f8f029f78ff6658c7733d82ae6abae3c2ef306aed82.png" \ "https://cdn.orris.care/cdss_images/pmc_clinical_VQA_5a15411c436e57ed7a5b607b0906e0606d86b2d676de8ad1f2ec3a42e699f771.jpg" \ "https://cdn.orris.care/cdss_images/pmc_clinical_VQA_50e0e843de52fee72bdcd3be6af0cafbbc6db3bbfe9cf624f47de5af95042a49.jpg" \ 2>&1 | python3 -c " import sys, json data = json.load(sys.stdin) for i, item in enumerate(data): b64 = item.get('base64','') err = item.get('error','') print(f'Image {i}: OK={bool(b64)}, len={len(b64)}, err={err[:60] if err else None}') "
cat << 'PYEOF' > /tmp/workspace/intraaxial-pptx/build_pptx.py import json, subprocess, base64 from io import BytesIO from pptx import Presentation from pptx.util import Inches, Pt, Emu from pptx.dml.color import RGBColor from pptx.enum.text import PP_ALIGN, MSO_ANCHOR from pptx.util import Inches, Pt # ── Fetch images ────────────────────────────────────────────────────────────── URLS = [ "https://cdn.orris.care/cdss_images/021e540005efca79912c3154bc37e48ca8b100aaefcf5892dd6b5e20fd3901fa.png", # 0 GBM T2/T1Gd/ADC "https://cdn.orris.care/cdss_images/561d94f0b5f5c700026f3c8687e5bfd9f39898de0699a558f1584fd1fe3cd6e7.png", # 1 T2/FLAIR mismatch "https://cdn.orris.care/cdss_images/01145b1bd0b4929fdd8dc1feba434bc259d1c9b2d1b179cce8d39fbb6a1984a6.png", # 2 Oligodendroglioma CT+MRI "https://cdn.orris.care/cdss_images/pmc_clinical_VQA_25925ee83d829bc1aa8ea84ae2ff7d26305fd2d212197dcffd1c5c3953722597.jpg", # 3 Pilocytic astrocytoma "https://cdn.orris.care/cdss_images/pmc_clinical_VQA_419dd276fc104c4b2cca7ceb9ad62b152b85c35e2b2cd10d9dd8d310e263e106.jpg", # 4 Medulloblastoma "https://cdn.orris.care/cdss_images/5db20ebd78732f9c63a61f8f029f78ff6658c7733d82ae6abae3c2ef306aed82.png", # 5 H3K27M thalamic glioma "https://cdn.orris.care/cdss_images/pmc_clinical_VQA_5a15411c436e57ed7a5b607b0906e0606d86b2d676de8ad1f2ec3a42e699f771.jpg", # 6 TME comparison GBM/mets/PCNSL/meningioma "https://cdn.orris.care/cdss_images/pmc_clinical_VQA_50e0e843de52fee72bdcd3be6af0cafbbc6db3bbfe9cf624f47de5af95042a49.jpg", # 7 Multiparametric MRI ] raw = subprocess.check_output(["python", "/tmp/skills/shared/scripts/fetch_images.py"] + URLS) imgs_data = json.loads(raw) imgs = [] for item in imgs_data: if item.get("base64"): imgs.append(BytesIO(base64.b64decode(item["base64"]))) else: imgs.append(None) # ── Helper constants ────────────────────────────────────────────────────────── W = Inches(13.333) H = Inches(7.5) # Color palette NAVY = RGBColor(0x1A, 0x3A, 0x5C) # dark blue BLUE = RGBColor(0x1E, 0x6E, 0xB5) # medium blue LTBLUE = RGBColor(0xD6, 0xE8, 0xF7) # light blue fill WHITE = RGBColor(0xFF, 0xFF, 0xFF) YELLOW = RGBColor(0xFF, 0xD7, 0x00) ORANGE = RGBColor(0xE8, 0x6C, 0x1A) GREEN = RGBColor(0x1A, 0x7A, 0x3C) GRAY = RGBColor(0x55, 0x55, 0x55) LGRAY = RGBColor(0xF0, 0xF4, 0xF8) prs = Presentation() prs.slide_width = W prs.slide_height = H blank = prs.slide_layouts[6] # ── Utility functions ───────────────────────────────────────────────────────── def add_rect(slide, x, y, w, h, fill_rgb=None, line_rgb=None, line_width=Pt(0)): shape = slide.shapes.add_shape(1, x, y, w, h) # MSO_SHAPE_TYPE.RECTANGLE = 1 shape.line.width = line_width if fill_rgb: shape.fill.solid() shape.fill.fore_color.rgb = fill_rgb else: shape.fill.background() if line_rgb: shape.line.color.rgb = line_rgb else: shape.line.fill.background() return shape def add_text(slide, text, x, y, w, h, size=Pt(18), bold=False, color=WHITE, align=PP_ALIGN.LEFT, wrap=True, italic=False): tb = slide.shapes.add_textbox(x, y, w, h) tf = tb.text_frame tf.word_wrap = wrap tf.margin_left = Inches(0.05) tf.margin_right = Inches(0.05) tf.margin_top = Inches(0.03) tf.margin_bottom = Inches(0.03) p = tf.paragraphs[0] p.alignment = align run = p.add_run() run.text = text run.font.size = size run.font.bold = bold run.font.italic = italic run.font.color.rgb = color run.font.name = "Calibri" return tb def add_multiline(slide, lines, x, y, w, h, size=Pt(14), color=WHITE, bold_first=False): """lines: list of (text, bold, color_override)""" tb = slide.shapes.add_textbox(x, y, w, h) tf = tb.text_frame tf.word_wrap = True tf.margin_left = Inches(0.08) tf.margin_right = Inches(0.05) tf.margin_top = Inches(0.05) tf.margin_bottom = Inches(0.03) first = True for (txt, bold, col) in lines: if first: p = tf.paragraphs[0] first = False else: p = tf.add_paragraph() p.space_before = Pt(2) run = p.add_run() run.text = txt run.font.size = size run.font.bold = bold run.font.color.rgb = col if col else color run.font.name = "Calibri" return tb def add_image(slide, img_io, x, y, w, h): if img_io is None: return img_io.seek(0) slide.shapes.add_picture(img_io, x, y, w, h) def header_bar(slide, title, subtitle=None): add_rect(slide, 0, 0, W, Inches(1.1), fill_rgb=NAVY) add_text(slide, title, Inches(0.3), Inches(0.08), Inches(10), Inches(0.6), size=Pt(28), bold=True, color=WHITE) if subtitle: add_text(slide, subtitle, Inches(0.3), Inches(0.65), Inches(12), Inches(0.4), size=Pt(14), bold=False, color=LTBLUE) # accent line add_rect(slide, 0, Inches(1.1), W, Inches(0.06), fill_rgb=BLUE) def footer_bar(slide, note="Grainger & Allison's Diagnostic Radiology | WHO CNS5 2021"): add_rect(slide, 0, Inches(7.2), W, Inches(0.3), fill_rgb=NAVY) add_text(slide, note, Inches(0.3), Inches(7.2), Inches(12), Inches(0.3), size=Pt(9), color=LTBLUE, align=PP_ALIGN.LEFT) def bg(slide): add_rect(slide, 0, 0, W, H, fill_rgb=LGRAY) # ═══════════════════════════════════════════════════════════════════════════════ # SLIDE 1 – TITLE SLIDE # ═══════════════════════════════════════════════════════════════════════════════ slide = prs.slides.add_slide(blank) add_rect(slide, 0, 0, W, H, fill_rgb=NAVY) add_rect(slide, 0, Inches(2.8), W, Inches(2.4), fill_rgb=BLUE) add_text(slide, "INTRA-AXIAL BRAIN TUMORS", Inches(0.5), Inches(1.1), Inches(12), Inches(1.1), size=Pt(44), bold=True, color=WHITE, align=PP_ALIGN.CENTER) add_text(slide, "A Comprehensive Radiology Seminar", Inches(0.5), Inches(2.2), Inches(12), Inches(0.6), size=Pt(22), bold=False, color=YELLOW, align=PP_ALIGN.CENTER) add_text(slide, "Classification | CT & MRI Imaging | Advanced Techniques | Differentials", Inches(0.5), Inches(2.95), Inches(12), Inches(0.55), size=Pt(16), bold=False, color=WHITE, align=PP_ALIGN.CENTER) bullets = [ "WHO CNS5 (2021) Classification", "Gliomas: GBM, IDH-mutant, Oligodendroglioma", "Embryonal Tumors: Medulloblastoma", "Metastases & Primary CNS Lymphoma", "Advanced MRI: DWI / PWI / MRS", ] for i, b in enumerate(bullets): add_text(slide, f"▸ {b}", Inches(3.5), Inches(3.75 + i*0.5), Inches(8.5), Inches(0.45), size=Pt(15), color=LTBLUE) add_text(slide, "For Radiology Residents | August 2026", Inches(0.5), Inches(7.0), Inches(12), Inches(0.35), size=Pt(12), color=YELLOW, align=PP_ALIGN.CENTER) # ═══════════════════════════════════════════════════════════════════════════════ # SLIDE 2 – DEFINITION & CLASSIFICATION # ═══════════════════════════════════════════════════════════════════════════════ slide = prs.slides.add_slide(blank) bg(slide) header_bar(slide, "Definition & Classification", "What Are Intra-Axial Tumors?") footer_bar(slide) add_rect(slide, Inches(0.2), Inches(1.25), Inches(6.1), Inches(5.75), fill_rgb=NAVY) add_rect(slide, Inches(6.5), Inches(1.25), Inches(6.6), Inches(5.75), fill_rgb=WHITE, line_rgb=BLUE, line_width=Pt(1.5)) add_text(slide, "DEFINITION", Inches(0.3), Inches(1.3), Inches(5.8), Inches(0.45), size=Pt(16), bold=True, color=YELLOW) defn = [ ("Tumors arising from WITHIN the brain parenchyma", True, WHITE), ("Origin: neurons, glial cells, ependymal lining, primitive cells", False, LTBLUE), ("", False, None), ("✦ Contrast: Extra-axial tumors (meningioma, schwannoma)\n compress brain from outside", False, LTBLUE), ("", False, None), ("RADIOLOGICAL SIGNS OF INTRA-AXIAL ORIGIN:", True, YELLOW), ("▸ No CSF cleft between lesion and brain", False, WHITE), ("▸ No buckling/displacement of gray-white interface", False, WHITE), ("▸ No broad dural base", False, WHITE), ("▸ Epicenter WITHIN brain parenchyma", False, WHITE), ("▸ Surrounding infiltrative edema", False, WHITE), ] add_multiline(slide, defn, Inches(0.3), Inches(1.75), Inches(5.8), Inches(4.8), size=Pt(13)) add_text(slide, "WHO CNS5 (2021) MAJOR CATEGORIES", Inches(6.6), Inches(1.3), Inches(6.2), Inches(0.45), size=Pt(14), bold=True, color=NAVY) categories = [ ("1. Diffuse Glial Tumors", BLUE, True), (" GBM · IDH-mutant Astrocytoma · Oligodendroglioma", GRAY, False), ("2. Circumscribed Gliomas", BLUE, True), (" Pilocytic · PXA · SEGA", GRAY, False), ("3. Glioneuronal Tumors", BLUE, True), (" Ganglioglioma · DNET · Central Neurocytoma", GRAY, False), ("4. Ependymal Tumors", BLUE, True), (" Ependymoma · Subependymoma", GRAY, False), ("5. Embryonal Tumors (Pediatric)", BLUE, True), (" Medulloblastoma · ATRT", GRAY, False), ("6. Non-primary Intra-Axial", BLUE, True), (" Metastases · PCNSL", GRAY, False), ] for i, (txt, col, bold) in enumerate(categories): add_text(slide, txt, Inches(6.6), Inches(1.85 + i*0.34), Inches(6.2), Inches(0.38), size=Pt(12), bold=bold, color=col) # ═══════════════════════════════════════════════════════════════════════════════ # SLIDE 3 – GBM IMAGING # ═══════════════════════════════════════════════════════════════════════════════ slide = prs.slides.add_slide(blank) bg(slide) header_bar(slide, "Glioblastoma (GBM) – WHO Grade 4, IDH-Wildtype", "Most Common Primary Malignant Brain Tumor in Adults | Median Survival 12-14 months") footer_bar(slide) # Left panel – key facts add_rect(slide, Inches(0.2), Inches(1.25), Inches(4.5), Inches(5.75), fill_rgb=NAVY) add_text(slide, "KEY FACTS", Inches(0.3), Inches(1.3), Inches(4.2), Inches(0.4), size=Pt(15), bold=True, color=YELLOW) facts = [ ("Peak Age: 55-75 years", False, WHITE), ("IDH-wildtype (>90% primary)", False, LTBLUE), ("MGMT methylation → better TMZ response", False, LTBLUE), ("", False, None), ("CT FINDINGS:", True, YELLOW), ("▸ Hypodense mass, WM-based", False, WHITE), ("▸ Irregular ring enhancement", False, WHITE), ("▸ Central necrosis (hypodense)", False, WHITE), ("▸ Vasogenic edema + mass effect", False, WHITE), ("▸ Calcification rare (<5%)", False, WHITE), ("", False, None), ("MRI FINDINGS:", True, YELLOW), ("▸ T1: heterogeneous, dark necrotic core", False, WHITE), ("▸ T2/FLAIR: extensive halo (CONTAINS TUMOR)", False, ORANGE), ("▸ T1+Gd: thick irregular RING enhancement", False, WHITE), ("▸ DWI: restricted in solid rim", False, WHITE), ("▸ SWI: blooming from hemorrhage", False, WHITE), ("", False, None), ("ADVANCED MRI:", True, YELLOW), ("▸ rCBV markedly elevated (>3-5×)", False, WHITE), ("▸ MRS: Cho↑↑ NAA↓↓ Lip/Lac↑↑", False, WHITE), ("▸ Cho/NAA ratio >3", False, WHITE), ] add_multiline(slide, facts, Inches(0.3), Inches(1.75), Inches(4.3), Inches(5.0), size=Pt(11.5)) # Right: image if imgs[0]: imgs[0].seek(0) add_image(slide, imgs[0], Inches(4.85), Inches(1.3), Inches(8.2), Inches(4.5)) add_rect(slide, Inches(4.85), Inches(5.85), Inches(8.2), Inches(0.45), fill_rgb=BLUE) add_text(slide, "Fig: GBM – (A) T2: heterogeneous mass + vasogenic edema (B) T1+Gd: ring enhancement (C) ADC: restricted diffusion in solid rim", Inches(4.9), Inches(5.87), Inches(8.0), Inches(0.42), size=Pt(10), color=WHITE, italic=True) # ═══════════════════════════════════════════════════════════════════════════════ # SLIDE 4 – IDH-MUTANT ASTROCYTOMA + T2/FLAIR MISMATCH # ═══════════════════════════════════════════════════════════════════════════════ slide = prs.slides.add_slide(blank) bg(slide) header_bar(slide, "Astrocytoma, IDH-Mutant (Grade 2-4)", "T2/FLAIR Mismatch Sign | Specificity >90% for IDH-mutant 1p/19q Intact") footer_bar(slide) add_rect(slide, Inches(0.2), Inches(1.25), Inches(4.5), Inches(5.75), fill_rgb=NAVY) add_text(slide, "IMAGING FINDINGS", Inches(0.3), Inches(1.3), Inches(4.2), Inches(0.4), size=Pt(15), bold=True, color=YELLOW) astro = [ ("Age: 30-40 years | Frontal/temporal WM", False, LTBLUE), ("Survival: ~6 years (IDH-mutant)", False, LTBLUE), ("", False, None), ("CT:", True, YELLOW), ("▸ Hypodense, subcortical location", False, WHITE), ("▸ No/faint enhancement at Grade 2", False, WHITE), ("▸ Calcification uncommon", False, WHITE), ("", False, None), ("MRI SEQUENCE-BY-SEQUENCE:", True, YELLOW), ("▸ T1: hypointense, well-defined", False, WHITE), ("▸ T2: MARKEDLY hyperintense (homogeneous)", False, WHITE), ("▸ FLAIR: KEY SIGN BELOW ↓", False, ORANGE), ("▸ T1+Gd: NO enhancement (Grade 2)", False, WHITE), ("▸ Enhancement = malignant transformation!", False, ORANGE), ("▸ DWI: no restriction (low grade)", False, WHITE), ("", False, None), ("T2/FLAIR MISMATCH SIGN:", True, YELLOW), ("T2 = markedly hyperintense", False, WHITE), ("FLAIR = paradoxically iso/hypointense", False, WHITE), ("→ Specificity >90% for IDH-mut 1p19q intact", False, ORANGE), ("→ Present in ~50% of patients", False, WHITE), ("", False, None), ("ADVANCED MRI:", True, YELLOW), ("▸ rCBV: LOW (increases with grade)", False, WHITE), ("▸ MRS: Cho↑, NAA↓, 2-HG peak @ 2.25 ppm", False, WHITE), ("▸ No Lip/Lac at low grade", False, WHITE), ] add_multiline(slide, astro, Inches(0.3), Inches(1.75), Inches(4.3), Inches(5.2), size=Pt(11)) if imgs[1]: imgs[1].seek(0) add_image(slide, imgs[1], Inches(4.85), Inches(1.3), Inches(8.2), Inches(4.5)) add_rect(slide, Inches(4.85), Inches(5.85), Inches(8.2), Inches(0.45), fill_rgb=BLUE) add_text(slide, "Fig: T2/FLAIR Mismatch Sign – (A) T2: markedly hyperintense mass (B) FLAIR: paradoxically isointense core | WHO Grade II IDH-mutant 1p19q-intact astrocytoma", Inches(4.9), Inches(5.87), Inches(8.0), Inches(0.42), size=Pt(10), color=WHITE, italic=True) # ═══════════════════════════════════════════════════════════════════════════════ # SLIDE 5 – OLIGODENDROGLIOMA # ═══════════════════════════════════════════════════════════════════════════════ slide = prs.slides.add_slide(blank) bg(slide) header_bar(slide, "Oligodendroglioma – IDH-mutant + 1p/19q Codeleted (Grade 2-3)", "Best Prognosis Among Diffuse Gliomas | Mean Survival ~8 Years") footer_bar(slide) add_rect(slide, Inches(0.2), Inches(1.25), Inches(4.5), Inches(5.75), fill_rgb=NAVY) add_text(slide, "IMAGING FINDINGS", Inches(0.3), Inches(1.3), Inches(4.2), Inches(0.4), size=Pt(15), bold=True, color=YELLOW) oligo = [ ("Age: 35-45 yrs | Frontal lobe cortex/subcortex", False, LTBLUE), ("Presents with chronic epilepsy", False, LTBLUE), ("", False, None), ("CT (Most Characteristic Modality):", True, YELLOW), ("▸ CALCIFICATION in up to 90%", False, ORANGE), ("▸ Coarse, irregular, ribbon-like calcification", False, WHITE), ("▸ Cortically based hypodense mass", False, WHITE), ("▸ Enhancement in ≥20% of Grade 2", False, WHITE), ("", False, None), ("MRI:", True, YELLOW), ("▸ T1: hypointense; Ca++ may be T1 bright", False, WHITE), ("▸ T2: heterogeneous, cortex + WM", False, WHITE), ("▸ SWI/GRE: BLOOMING from calcification", False, ORANGE), ("▸ T1+Gd: variable; no enhancement ≠ Grade 2", False, WHITE), ("▸ DWI: no restriction (low grade)", False, WHITE), ("", False, None), ("ADVANCED MRI – KEY TEACHING POINT:", True, YELLOW), ("▸ rCBV: ELEVATED even in Grade 2 (paradox!)", False, ORANGE), ("▸ 'Chicken-wire' vasculature → high rCBV", False, WHITE), ("▸ May falsely suggest high-grade glioma", False, WHITE), ("▸ MRS: myo-inositol↑, glutamine↑, glutamate↑", False, WHITE), ("▸ Lip/Lac peaks = anaplastic transformation", False, WHITE), ] add_multiline(slide, oligo, Inches(0.3), Inches(1.75), Inches(4.3), Inches(5.2), size=Pt(11)) if imgs[2]: imgs[2].seek(0) add_image(slide, imgs[2], Inches(4.85), Inches(1.3), Inches(8.2), Inches(4.5)) add_rect(slide, Inches(4.85), Inches(5.85), Inches(8.2), Inches(0.45), fill_rgb=BLUE) add_text(slide, "Fig: Oligodendroglioma – CT: calcified frontal cortical mass (A,B) | T2 MRI (C): heterogeneous | T1+Gd (D): irregular enhancement after 2 years", Inches(4.9), Inches(5.87), Inches(8.0), Inches(0.42), size=Pt(10), color=WHITE, italic=True) # ═══════════════════════════════════════════════════════════════════════════════ # SLIDE 6 – DIFFUSE MIDLINE GLIOMA / DIPG # ═══════════════════════════════════════════════════════════════════════════════ slide = prs.slides.add_slide(blank) bg(slide) header_bar(slide, "Diffuse Midline Glioma – H3 K27M-Mutant (WHO Grade 4)", "Includes DIPG | All Cases Grade 4 Regardless of Histology | Median Survival <12 months") footer_bar(slide) add_rect(slide, Inches(0.2), Inches(1.25), Inches(4.5), Inches(5.75), fill_rgb=NAVY) add_text(slide, "IMAGING FINDINGS", Inches(0.3), Inches(1.3), Inches(4.2), Inches(0.4), size=Pt(15), bold=True, color=YELLOW) dipg = [ ("Age: Children & adolescents (also adults >80y)", False, LTBLUE), ("Location: Pons (DIPG), thalamus, spinal cord", False, LTBLUE), ("", False, None), ("CT:", True, YELLOW), ("▸ Diffuse, poorly defined hypo/isodense", False, WHITE), ("▸ Expands the pons (T2 halo encases basilar a.)", False, WHITE), ("▸ Enhancement variable/absent", False, WHITE), ("", False, None), ("MRI:", True, YELLOW), ("▸ T1: hypointense, ill-defined, expands structure", False, WHITE), ("▸ T2: DIFFUSE high signal filling pons", False, WHITE), ("▸ FLAIR: diffuse signal abnormality", False, WHITE), ("▸ T1+Gd: variable - DOES NOT indicate grade", False, ORANGE), ("▸ DWI/ADC: variable, restriction in aggressive foci", False, WHITE), ("", False, None), ("CLASSIC DIPG PATTERN:", True, YELLOW), ("▸ Diffuse pontine expansion", False, WHITE), ("▸ Wraps around basilar artery (>50% of pons)", False, WHITE), ("▸ Engulfs the pons", False, WHITE), ("▸ Short symptom onset (<3 weeks in children)", False, WHITE), ("", False, None), ("ADVANCED MRI:", True, YELLOW), ("▸ MRS: Cho↑, NAA↓, Lac/Lip in aggressive areas", False, WHITE), ("▸ PWI: variable rCBV", False, WHITE), ("▸ Biopsy now performed for H3 K27M profiling", False, WHITE), ] add_multiline(slide, dipg, Inches(0.3), Inches(1.75), Inches(4.3), Inches(5.2), size=Pt(11)) if imgs[5]: imgs[5].seek(0) add_image(slide, imgs[5], Inches(4.85), Inches(1.3), Inches(8.2), Inches(4.5)) add_rect(slide, Inches(4.85), Inches(5.85), Inches(8.2), Inches(0.45), fill_rgb=BLUE) add_text(slide, "Fig: H3 K27M-Mutant Glioma (Thalamic) – (A) T2: diffuse hyperintensity (B) T1+Gd: variable/focal enhancement (C) ADC: restricted areas in aggressive component", Inches(4.9), Inches(5.87), Inches(8.0), Inches(0.42), size=Pt(10), color=WHITE, italic=True) # ═══════════════════════════════════════════════════════════════════════════════ # SLIDE 7 – PILOCYTIC ASTROCYTOMA # ═══════════════════════════════════════════════════════════════════════════════ slide = prs.slides.add_slide(blank) bg(slide) header_bar(slide, "Pilocytic Astrocytoma – WHO Grade 1", "Most Common Brain Tumor in Children | 10-Year Survival >90% | Cyst + Mural Nodule") footer_bar(slide) add_rect(slide, Inches(0.2), Inches(1.25), Inches(4.5), Inches(5.75), fill_rgb=NAVY) add_text(slide, "IMAGING FINDINGS", Inches(0.3), Inches(1.3), Inches(4.2), Inches(0.4), size=Pt(15), bold=True, color=YELLOW) pilo = [ ("Age: <20 yrs (children/young adults)", False, LTBLUE), ("Location: Cerebellum > optic pathway > hypothalamus", False, LTBLUE), ("", False, None), ("CT:", True, YELLOW), ("▸ Well-circumscribed cyst + hyperdense nodule", False, WHITE), ("▸ Calcification in ~20%", False, WHITE), ("▸ Vivid nodule enhancement", False, WHITE), ("", False, None), ("MRI – CLASSIC PATTERN:", True, YELLOW), ("▸ T1: hypointense cyst; isointense nodule", False, WHITE), ("▸ T2: cyst bright (↑ than CSF); nodule heterogeneous", False, WHITE), ("▸ FLAIR: cyst hypointense; nodule high signal", False, WHITE), ("▸ T1+Gd: AVID nodule enhancement", False, ORANGE), ("▸ CYST WALL DOES NOT ENHANCE", False, ORANGE), ("▸ DWI: NO restriction (low grade)", False, WHITE), ("", False, None), ("ADVANCED MRI:", True, YELLOW), ("▸ rCBV: LOW (key DDx from hemangioblastoma)", False, WHITE), ("▸ MRS: mild Cho↑, myo-inositol↑, NAA↓", False, WHITE), ("▸ No Lip/Lac", False, WHITE), ("", False, None), ("KEY DDx - POSTERIOR FOSSA CYST+NODULE:", True, YELLOW), ("Pilocytic (low rCBV) vs Hemangioblastoma", False, WHITE), ("(very high rCBV – use DSC perfusion to distinguish)", False, WHITE), ] add_multiline(slide, pilo, Inches(0.3), Inches(1.75), Inches(4.3), Inches(5.2), size=Pt(11)) if imgs[3]: imgs[3].seek(0) add_image(slide, imgs[3], Inches(4.85), Inches(1.3), Inches(8.2), Inches(4.5)) add_rect(slide, Inches(4.85), Inches(5.85), Inches(8.2), Inches(0.45), fill_rgb=BLUE) add_text(slide, "Fig: Pilocytic Astrocytoma – (a) Sagittal T2: cystic mass with mural nodule (arrows) | (b) CE T1: intense nodule enhancement (arrowheads) with smooth cyst wall", Inches(4.9), Inches(5.87), Inches(8.0), Inches(0.42), size=Pt(10), color=WHITE, italic=True) # ═══════════════════════════════════════════════════════════════════════════════ # SLIDE 8 – MEDULLOBLASTOMA # ═══════════════════════════════════════════════════════════════════════════════ slide = prs.slides.add_slide(blank) bg(slide) header_bar(slide, "Medulloblastoma – Most Common Malignant Brain Tumor in Children", "WHO Grade 4 | Cerebellar Vermis | CT Hyperdense + DWI Markedly Restricted") footer_bar(slide) add_rect(slide, Inches(0.2), Inches(1.25), Inches(4.5), Inches(5.75), fill_rgb=NAVY) add_text(slide, "IMAGING FINDINGS", Inches(0.3), Inches(1.3), Inches(4.2), Inches(0.4), size=Pt(15), bold=True, color=YELLOW) medullo = [ ("Age: Peak 5-7 yrs; 2nd peak 20-40 yrs (adult)", False, LTBLUE), ("Location: Vermis (children) | Hemisphere (adults)", False, LTBLUE), ("", False, None), ("CT – MOST CHARACTERISTIC:", True, YELLOW), ("▸ HYPERDENSE vermian mass (high NC ratio)", False, ORANGE), ("▸ Hydrocephalus from 4th ventricle obstruction", False, WHITE), ("▸ Cysts, hemorrhage, calcification seen", False, WHITE), ("▸ Patchy variable enhancement", False, WHITE), ("", False, None), ("MRI:", True, YELLOW), ("▸ T1: iso/hypointense", False, WHITE), ("▸ T2: ISO-TO-HYPOINTENSE (unlike pilocytic!)", False, ORANGE), ("▸ T1+Gd: moderate heterogeneous enhancement", False, WHITE), ("▸ DWI: MARKEDLY RESTRICTED (key feature)", False, ORANGE), ("▸ ADC: profoundly reduced (lowest of all tumors)", False, ORANGE), ("", False, None), ("MRS:", True, YELLOW), ("▸ NAA↓↓, Cho/Cr↑", False, WHITE), ("▸ TAURINE PEAK (relatively specific)", False, ORANGE), ("▸ Lactate + lipid peaks", False, WHITE), ("", False, None), ("MOLECULAR SUBGROUPS (WHO 2021):", True, YELLOW), ("▸ WNT-activated: best prognosis (>90% survival)", False, GREEN), ("▸ SHH-activated: intermediate", False, WHITE), ("▸ Group 3 (MYC amplification): WORST prognosis", False, ORANGE), ("▸ Group 4: intermediate", False, WHITE), ("", False, None), ("⚠ MANDATORY: Whole-spine MRI for drop mets (30-40%)", True, ORANGE), ] add_multiline(slide, medullo, Inches(0.3), Inches(1.75), Inches(4.3), Inches(5.2), size=Pt(10.5)) if imgs[4]: imgs[4].seek(0) add_image(slide, imgs[4], Inches(4.85), Inches(1.3), Inches(8.2), Inches(4.5)) add_rect(slide, Inches(4.85), Inches(5.85), Inches(8.2), Inches(0.45), fill_rgb=BLUE) add_text(slide, "Fig: Medulloblastoma – CT hyperdense posterior fossa mass (A,B) | MRI T2 (B-a), T1+Gd (B-b) | DWI bright + ADC dark = marked restriction (B-c,d) | H&E: small round blue cells", Inches(4.9), Inches(5.87), Inches(8.0), Inches(0.42), size=Pt(10), color=WHITE, italic=True) # ═══════════════════════════════════════════════════════════════════════════════ # SLIDE 9 – PRIMARY CNS LYMPHOMA # ═══════════════════════════════════════════════════════════════════════════════ slide = prs.slides.add_slide(blank) bg(slide) header_bar(slide, "Primary CNS Lymphoma (PCNSL)", "'The Ghost Tumor' | NEVER Give Steroids Before Biopsy | Steroid-Sensitive") footer_bar(slide) add_rect(slide, Inches(0.2), Inches(1.25), Inches(4.5), Inches(5.75), fill_rgb=NAVY) add_text(slide, "IMAGING FINDINGS", Inches(0.3), Inches(1.3), Inches(4.2), Inches(0.4), size=Pt(15), bold=True, color=YELLOW) pcnsl = [ ("Age: 50-70 yrs (immunocompetent) | AIDS/HIV", False, LTBLUE), ("Type: Diffuse Large B-Cell NHL", False, LTBLUE), ("Location: Periventricular, basal ganglia, CC", False, LTBLUE), ("", False, None), ("CT:", True, YELLOW), ("▸ HYPERDENSE spontaneously (high cellularity)", False, ORANGE), ("▸ Periventricular or BG location", False, WHITE), ("▸ Homogeneous enhancement (immunocompetent)", False, WHITE), ("▸ Ring enhancement (immunocompromised)", False, WHITE), ("", False, None), ("MRI – KEY TEACHING POINTS:", True, YELLOW), ("▸ T2: ISO-TO-HYPOINTENSE (most tumors are bright!)", False, ORANGE), ("▸ FLAIR: periventricular high signal", False, WHITE), ("▸ T1+Gd: HOMOGENEOUS 'fluffy' enhancement", False, WHITE), ("▸ DWI: MARKEDLY RESTRICTED", False, ORANGE), ("▸ ADC: very low (<700×10⁻⁶ mm²/s)", False, ORANGE), ("▸ SWI: NO blooming (rarely hemorrhagic – unlike GBM)", False, WHITE), ("", False, None), ("ADVANCED MRI – CRITICAL DDx CLUE:", True, YELLOW), ("▸ rCBV: LOW-TO-MODERATE (paradox!)", False, ORANGE), ("▸ Despite avid enhancement – lacks neovascularity", False, WHITE), ("▸ Ring-enhancing + restricted DWI + LOW rCBV = PCNSL", False, ORANGE), ("▸ MRS: Cho↑↑, Lip↑↑, NAA↓↓, large lipid peak", False, WHITE), ("", False, None), ("THE GHOST TUMOR:", True, YELLOW), ("Steroids → lesion disappears in 24-72 hours", False, WHITE), ("= Pathognomonic but prevents diagnosis!", False, ORANGE), ] add_multiline(slide, pcnsl, Inches(0.3), Inches(1.75), Inches(4.3), Inches(5.2), size=Pt(10.5)) if imgs[6]: imgs[6].seek(0) add_image(slide, imgs[6], Inches(4.85), Inches(1.3), Inches(8.2), Inches(4.5)) add_rect(slide, Inches(4.85), Inches(5.85), Inches(8.2), Inches(0.45), fill_rgb=BLUE) add_text(slide, "Fig: Tumor microenvironment comparison – Row C (PCNSL): CE T1 homogeneous enhancement, FLAIR, PO2 map, MTI map | Radar: dominant glycolysis (65%), minimal necrosis (7%)", Inches(4.9), Inches(5.87), Inches(8.0), Inches(0.42), size=Pt(10), color=WHITE, italic=True) # ═══════════════════════════════════════════════════════════════════════════════ # SLIDE 10 – BRAIN METASTASES # ═══════════════════════════════════════════════════════════════════════════════ slide = prs.slides.add_slide(blank) bg(slide) header_bar(slide, "Brain Metastases", "10× More Common Than Primary Tumors | Gray-White Matter Junction | Always Use Gd-MRI") footer_bar(slide) add_rect(slide, Inches(0.2), Inches(1.25), Inches(4.5), Inches(5.75), fill_rgb=NAVY) add_text(slide, "IMAGING FINDINGS", Inches(0.3), Inches(1.3), Inches(4.2), Inches(0.4), size=Pt(15), bold=True, color=YELLOW) mets_facts = [ ("Common primaries: Lung (50%) > Breast > Melanoma", False, LTBLUE), ("Location: Gray-white matter junction (embolic)", False, LTBLUE), ("80% supratentorial | 15% cerebellum", False, LTBLUE), ("", False, None), ("CT:", True, YELLOW), ("▸ Variable density (iso/hypodense/hyperdense)", False, WHITE), ("▸ Hyperdense: melanoma, hemorrhagic mets", False, ORANGE), ("▸ Ring or solid enhancement", False, WHITE), ("▸ DISPROPORTIONATELY large vasogenic edema", False, ORANGE), ("▸ vs. small enhancing nodule (classic pattern)", False, WHITE), ("", False, None), ("MRI:", True, YELLOW), ("▸ T1: hypointense; T1 BRIGHT = melanoma/mucinous", False, WHITE), ("▸ T2: extensive surrounding vasogenic edema", False, WHITE), ("▸ T1+Gd: ring (large) or solid (small) enhancement", False, WHITE), ("▸ Small mets invisible WITHOUT contrast", False, ORANGE), ("▸ DWI: NO restriction in necrotic center", False, WHITE), ("▸ SWI: blooming in melanoma, RCC, choriocarcinoma", False, WHITE), ("", False, None), ("ADVANCED MRI:", True, YELLOW), ("▸ rCBV: elevated in solid portions", False, WHITE), ("▸ rCBV drops sharply at tumor-brain interface", False, WHITE), ("▸ MRS in surrounding halo: NORMAL Cho", False, ORANGE), ("▸ (GBM halo = elevated Cho – key differentiator)", False, ORANGE), ("", False, None), ("SPECIAL PRIMARY CLUES:", True, YELLOW), ("▸ Melanoma: T1 bright, hemorrhagic", False, WHITE), ("▸ RCC: hypervascular, cystic, hemorrhagic", False, WHITE), ("▸ Breast: leptomeningeal spread common", False, WHITE), ] add_multiline(slide, mets_facts, Inches(0.3), Inches(1.75), Inches(4.3), Inches(5.2), size=Pt(10.5)) # right panel: comparison table text (no image for this slide - use text layout) add_rect(slide, Inches(4.85), Inches(1.3), Inches(8.2), Inches(5.7), fill_rgb=WHITE, line_rgb=BLUE, line_width=Pt(1.5)) add_text(slide, "GBM vs. METASTASIS – Key Differentiators", Inches(5.0), Inches(1.4), Inches(7.8), Inches(0.4), size=Pt(15), bold=True, color=NAVY) headers = ["Feature", "GBM", "Metastasis"] widths = [Inches(2.2), Inches(2.8), Inches(3.0)] xs = [Inches(5.0), Inches(7.2), Inches(10.0)] row_h = Inches(0.38) rows = [ ("Location", "Deep WM / BG", "GM-WM junction"), ("Multiplicity", "Usually solitary", "Often multiple"), ("Edema", "Infiltrative T2 halo", "Vasogenic, large"), ("Enhancement", "Irregular ring", "Clean ring/solid"), ("DWI center", "Restricted (solid areas)", "Unrestricted (necrosis)"), ("MRS halo", "Cho ELEVATED", "Cho NORMAL"), ("rCBV halo", "Elevated (tumor infiltr.)", "Normal"), ("Gd protocol", "Ring + necrosis", "Ring/solid nodule"), ] for col_i, (hdr, x, w) in enumerate(zip(headers, xs, widths)): add_rect(slide, x, Inches(1.85), w, Inches(0.38), fill_rgb=NAVY) add_text(slide, hdr, x, Inches(1.86), w, Inches(0.36), size=Pt(12), bold=True, color=WHITE, align=PP_ALIGN.CENTER) for row_i, row in enumerate(rows): bg_col = LGRAY if row_i % 2 == 0 else WHITE for col_i, (val, x, w) in enumerate(zip(row, xs, widths)): add_rect(slide, x, Inches(2.23 + row_i * row_h), w, row_h, fill_rgb=bg_col, line_rgb=BLUE, line_width=Pt(0.5)) col_color = NAVY if col_i == 0 else (ORANGE if "Elevated" in val or "ELEVATED" in val else GRAY) add_text(slide, val, x, Inches(2.24 + row_i * row_h), w, Inches(0.36), size=Pt(11), color=col_color, align=PP_ALIGN.CENTER) # ═══════════════════════════════════════════════════════════════════════════════ # SLIDE 11 – ADVANCED MRI TECHNIQUES # ═══════════════════════════════════════════════════════════════════════════════ slide = prs.slides.add_slide(blank) bg(slide) header_bar(slide, "Advanced MRI Techniques in Brain Tumor Imaging", "DWI · DSC Perfusion · MRS · fMRI · DTI · Radiogenomics") footer_bar(slide) add_rect(slide, Inches(0.2), Inches(1.25), Inches(5.5), Inches(5.75), fill_rgb=NAVY) add_text(slide, "KEY PARAMETERS", Inches(0.3), Inches(1.3), Inches(5.2), Inches(0.4), size=Pt(15), bold=True, color=YELLOW) adv = [ ("DWI / ADC:", True, YELLOW), ("▸ Low ADC = high cellularity = high grade", False, WHITE), ("▸ Restricted: PCNSL > Medullo > GBM > Low-grade", False, LTBLUE), ("▸ Abscess center: restricted | Tumor center: NOT", False, ORANGE), ("", False, None), ("DSC PERFUSION (rCBV):", True, YELLOW), ("▸ rCBV >1.75 = high grade (sensitivity 95%)", False, WHITE), ("▸ Oligodendroglioma: elevated despite low grade", False, ORANGE), ("▸ PCNSL: LOW despite avid enhancement", False, ORANGE), ("▸ Hemangioblastoma: highest of all", False, WHITE), ("▸ Use rCBV to target biopsy to highest grade area", False, WHITE), ("", False, None), ("MR SPECTROSCOPY (MRS):", True, YELLOW), ("▸ Cho↑ = membrane turnover = tumor activity", False, WHITE), ("▸ NAA↓ = neuronal loss", False, WHITE), ("▸ Cho/NAA >2 = malignant; >3 = highly malignant", False, ORANGE), ("▸ Lip/Lac = necrosis / anaerobic metabolism", False, WHITE), ("▸ 2-HG @ 2.25 ppm = IDH-mutant specific", False, ORANGE), ("▸ Taurine peak = medulloblastoma (relatively specific)", False, WHITE), ("▸ MRS abnormality extends BEYOND Gd enhancement", False, ORANGE), ("", False, None), ("TREATMENT RESPONSE:", True, YELLOW), ("▸ Pseudoprogression: within 12 wks of RT+TMZ", False, WHITE), ("▸ → MRS: Lip/Lac dominant, low Cho = treatment effect", False, LTBLUE), ("▸ Pseudoresponse: anti-VEGF → enhancement drops", False, WHITE), ("▸ → T2/FLAIR keeps growing despite less enhancement", False, LTBLUE), ("▸ True progression: Cho↑, rCBV↑, PET hypermetabolic", False, WHITE), ] add_multiline(slide, adv, Inches(0.3), Inches(1.75), Inches(5.2), Inches(5.2), size=Pt(10.5)) if imgs[7]: imgs[7].seek(0) add_image(slide, imgs[7], Inches(5.9), Inches(1.3), Inches(7.2), Inches(4.5)) add_rect(slide, Inches(5.9), Inches(5.85), Inches(7.2), Inches(0.45), fill_rgb=BLUE) add_text(slide, "Fig: Epithelioid GBM – (a) T2WI, (b) DWI restricted, (c) CE T1+Gd with dural tail, (d) ADC low, (e) PWI elevated rCBF in red, (f) MRS: Cho↑ NAA↓ (Cho/NAA markedly elevated)", Inches(5.95), Inches(5.87), Inches(7.0), Inches(0.42), size=Pt(10), color=WHITE, italic=True) # ═══════════════════════════════════════════════════════════════════════════════ # SLIDE 12 – MASTER COMPARISON TABLE # ═══════════════════════════════════════════════════════════════════════════════ slide = prs.slides.add_slide(blank) bg(slide) header_bar(slide, "Master Imaging Comparison – Intra-Axial Tumors", "CT | T2 | Enhancement | DWI | rCBV | MRS Key Features") footer_bar(slide) col_hdrs = ["Tumor", "CT", "T2 Signal", "T1+Gd", "DWI", "rCBV", "MRS / Key Feature"] col_ws = [Inches(1.8), Inches(1.2), Inches(1.5), Inches(1.7), Inches(1.0), Inches(0.9), Inches(4.5)] col_xs = [Inches(0.2)] for w in col_ws[:-1]: col_xs.append(col_xs[-1] + w) table_data = [ ("GBM (IDH-wt)", "Hypodense ring", "Heterogeneous +halo", "Irreg ring", "+(rim)", "Very High", "Cho↑↑ NAA↓↓ Lip/Lac↑↑ | Cho/NAA>3"), ("Astrocytoma IDH-mut", "Hypodense", "Homogeneous bright", "None (Gr2)", "–", "Low", "Cho↑ NAA↓ 2-HG@2.25ppm | T2/FLAIR mismatch"), ("Oligodendroglioma", "Calcified", "Heterogeneous cortex", "Variable", "–", "Elevated!", "myo-inositol↑ Glu↑ | Ca++ on CT/SWI"), ("DIPG (H3 K27M)", "Expands pons", "Diffuse pons", "Variable", "+/–", "Variable", "Cho↑ NAA↓ | Wraps basilar artery"), ("Pilocytic Astro", "Cyst+nodule", "Cyst bright", "Nodule avid", "–", "Low", "myo-inositol↑ | Cyst wall NO enhancement"), ("Medulloblastoma", "Hyperdense!", "Iso/HYPOintense!", "Heterogeneous", "+++", "Moderate", "Taurine↑ NAA↓↓ | Lowest ADC"), ("Ependymoma", "Ca++ 50%", "Heterogeneous", "Moderate", "+/–", "Low-mod", "myo-inositol↑ | Squeezes through foramina"), ("PCNSL", "Hyperdense!", "Iso/HYPOintense!", "Homogeneous", "++", "Low-mod", "Cho↑↑ Lip↑↑ | Ghost sign with steroids"), ("Metastasis", "Variable", "Vasogenic edema", "Ring/solid", "–(ctr)", "Variable", "Normal Cho in halo | Disproportionate edema"), ("Ganglioglioma", "Calcified", "Heterogeneous", "Variable 50%", "–", "Low", "Mild Cho↑ | Chronic epilepsy in young pt"), ("Hemangioblastoma", "Cyst+nodule", "Cyst bright+flow void","Nodule avid", "–", "Very High!", "Mild Cho↑ | VHL association; high rCBV DDx"), ] row_h = Inches(0.45) for col_i, (hdr, x, w) in enumerate(zip(col_hdrs, col_xs, col_ws)): add_rect(slide, x, Inches(1.25), w, Inches(0.4), fill_rgb=NAVY) add_text(slide, hdr, x, Inches(1.26), w, Inches(0.38), size=Pt(10), bold=True, color=YELLOW, align=PP_ALIGN.CENTER) for row_i, row in enumerate(table_data): bg_c = LTBLUE if row_i % 2 == 0 else WHITE for col_i, (val, x, w) in enumerate(zip(row, col_xs, col_ws)): add_rect(slide, x, Inches(1.65 + row_i * row_h), w, row_h, fill_rgb=bg_c, line_rgb=BLUE, line_width=Pt(0.5)) txt_color = NAVY if col_i == 0 else (ORANGE if "!" in val or "↑↑" in val or "LOW" in val.upper() else GRAY) add_text(slide, val, x, Inches(1.66 + row_i * row_h), w, Inches(0.43), size=Pt(9), color=txt_color, align=PP_ALIGN.CENTER if col_i != 6 else PP_ALIGN.LEFT) # ═══════════════════════════════════════════════════════════════════════════════ # SLIDE 13 – DIFFERENTIAL DIAGNOSIS: RING-ENHANCING LESION # ═══════════════════════════════════════════════════════════════════════════════ slide = prs.slides.add_slide(blank) bg(slide) header_bar(slide, "Differential Diagnosis: Ring-Enhancing Brain Lesion", "GRIING Mnemonic | Most Common Clinical Challenge in Neuroimaging") footer_bar(slide) add_rect(slide, Inches(0.2), Inches(1.25), Inches(6.3), Inches(5.75), fill_rgb=NAVY) add_text(slide, "G-R-I-I-N-G MNEMONIC", Inches(0.3), Inches(1.3), Inches(5.8), Inches(0.4), size=Pt(16), bold=True, color=YELLOW) ring_ddx = [ ("G – Glioblastoma", True, ORANGE), (" Irregular ring | T2 halo (contains tumor) | WM-based", False, WHITE), (" DWI: restricted rim | rCBV: very high", False, LTBLUE), ("", False, None), ("R – Radiation Necrosis", True, ORANGE), (" History of prior RT | 6+ months post-treatment", False, WHITE), (" MRS: Lip/Lac only, NO Cho | rCBV: low | PET: hypometabolic", False, LTBLUE), ("", False, None), ("I – Infection (Abscess)", True, ORANGE), (" THIN SMOOTH RING + DWI RESTRICTED CENTER (pus)", False, WHITE), (" Low ADC in cavity | Clinical: fever, elevated WBC", False, LTBLUE), ("", False, None), ("I – Infarct (subacute)", True, ORANGE), (" Follows vascular territory | Cortical + subcortical", False, WHITE), (" DWI restricted acutely | Gyral enhancement subacutely", False, LTBLUE), ("", False, None), ("N – Neoplasm (Metastasis)", True, ORANGE), (" GM-WM junction | Multiple lesions | Known primary", False, WHITE), (" Disproportionate edema | DWI center: unrestricted", False, LTBLUE), ("", False, None), ("G – Granuloma (TB / Toxo / Sarcoid)", True, ORANGE), (" Smooth ring | Contact/HIV history", False, WHITE), (" Toxo responds to empirical Rx; PCNSL does NOT", False, LTBLUE), ("", False, None), ("BONUS – D – Demyelination (Tumefactive MS)", True, ORANGE), (" OPEN RING / HORSESHOE enhancement", False, WHITE), (" Opening faces cortex | Young woman | WM lesions elsewhere", False, LTBLUE), ] add_multiline(slide, ring_ddx, Inches(0.3), Inches(1.75), Inches(5.9), Inches(5.1), size=Pt(11)) # Right panel summary box add_rect(slide, Inches(6.7), Inches(1.25), Inches(6.4), Inches(5.75), fill_rgb=WHITE, line_rgb=BLUE, line_width=Pt(1.5)) add_text(slide, "QUICK DECISION TOOL", Inches(6.85), Inches(1.35), Inches(6.0), Inches(0.4), size=Pt(14), bold=True, color=NAVY) quick = [ ("DWI RESTRICTED in center:", True, NAVY), ("→ Abscess (most specific)", False, GREEN), ("→ Also: PCNSL (whole lesion restricted)", False, ORANGE), ("", False, None), ("DWI RESTRICTED in rim only:", True, NAVY), ("→ GBM (solid hypercellular rim)", False, ORANGE), ("", False, None), ("rCBV HIGH:", True, NAVY), ("→ GBM, Metastasis, Oligodendroglioma", False, ORANGE), ("", False, None), ("rCBV LOW + restricted DWI + enhancement:", True, NAVY), ("→ PCNSL (classic triad)", False, ORANGE), ("", False, None), ("'Open ring' enhancement:", True, NAVY), ("→ Tumefactive MS (opening faces cortex)", False, GREEN), ("", False, None), ("MRS: ONLY Lip/Lac, no Cho:", True, NAVY), ("→ Radiation necrosis (NOT active tumor)", False, GREEN), ("", False, None), ("T2/FLAIR mismatch in solid non-enhancing glioma:", True, NAVY), ("→ IDH-mutant 1p19q-intact Astrocytoma", False, GREEN), ] add_multiline(slide, quick, Inches(6.85), Inches(1.85), Inches(6.0), Inches(5.0), size=Pt(11.5)) # ═══════════════════════════════════════════════════════════════════════════════ # SLIDE 14 – KEY TAKE-HOME MESSAGES # ═══════════════════════════════════════════════════════════════════════════════ slide = prs.slides.add_slide(blank) add_rect(slide, 0, 0, W, H, fill_rgb=NAVY) add_rect(slide, 0, Inches(0.9), W, Inches(0.08), fill_rgb=BLUE) add_rect(slide, 0, Inches(6.9), W, Inches(0.6), fill_rgb=BLUE) add_text(slide, "KEY TAKE-HOME MESSAGES", Inches(0.3), Inches(0.1), Inches(12), Inches(0.75), size=Pt(30), bold=True, color=WHITE, align=PP_ALIGN.CENTER) messages = [ ("1", "WHO 2021 changed everything – molecular markers (IDH, 1p/19q, MGMT, H3 K27M) are primary; histology is secondary."), ("2", "Enhancement ≠ Malignancy – 30-40% of GBMs may NOT enhance early; Grade 2 IDH-mutant gliomas rarely enhance."), ("3", "The T2/FLAIR halo of GBM ALWAYS contains infiltrating tumor cells – not just edema. Surgical margins must go beyond enhancement."), ("4", "T2/FLAIR mismatch sign: T2 bright + FLAIR iso/dark = IDH-mutant 1p19q-intact astrocytoma (Specificity >90%)."), ("5", "PCNSL disappears with steroids (Ghost Tumor). NEVER give steroids before biopsy unless herniation is imminent."), ("6", "DWI restriction ladder: PCNSL > Medulloblastoma > GBM solid rim > Abscess > Low-grade glioma."), ("7", "rCBV paradoxes: Oligodendroglioma = HIGH despite Grade 2 | PCNSL = LOW despite avid enhancement."), ("8", "Medulloblastoma: CT hyperdense + T2 hypointense + markedly restricted DWI = most reliable imaging triad."), ("9", "Gray-white matter junction + multiple lesions + vasogenic edema = Metastases until proven otherwise."), ("10", "Pseudoprogression (within 12 wks of RT+TMZ) vs. True Progression: use MRS (Lip/Lac vs Cho) + rCBV."), ] for i, (num, msg) in enumerate(messages): row = i % 5 col = i // 5 x = Inches(0.2) + col * Inches(6.55) y = Inches(1.1) + row * Inches(1.12) add_rect(slide, x, y, Inches(0.5), Inches(0.45), fill_rgb=BLUE) add_text(slide, num, x, y, Inches(0.5), Inches(0.45), size=Pt(18), bold=True, color=WHITE, align=PP_ALIGN.CENTER) add_rect(slide, x + Inches(0.55), y, Inches(5.9), Inches(0.45), fill_rgb=RGBColor(0x1E, 0x2A, 0x45)) add_text(slide, msg, x + Inches(0.6), y + Inches(0.02), Inches(5.8), Inches(0.5), size=Pt(11), color=WHITE) add_text(slide, "Source: Grainger & Allison's Diagnostic Radiology | WHO CNS5 2021 | Adams & Victor's Neurology 12E | Robbins & Kumar Pathology", Inches(0.3), Inches(6.95), Inches(12), Inches(0.35), size=Pt(10), color=LTBLUE, align=PP_ALIGN.CENTER) # ── SAVE ───────────────────────────────────────────────────────────────────── out = "/tmp/workspace/intraaxial-pptx/Intra_Axial_Brain_Tumors.pptx" buf = BytesIO() prs.save(buf) with open(out, "wb") as f: f.write(buf.getvalue()) print(f"Saved: {out}") PYEOF python /tmp/workspace/intraaxial-pptx/build_pptx.py
# Debug: check what the base64 string looks like python3 -c " import json, subprocess, base64 from io import BytesIO from PIL import Image raw = subprocess.check_output(['python', '/tmp/skills/shared/scripts/fetch_images.py', 'https://cdn.orris.care/cdss_images/021e540005efca79912c3154bc37e48ca8b100aaefcf5892dd6b5e20fd3901fa.png']) data = json.loads(raw) item = data[0] b64str = item['base64'] print('First 80 chars:', b64str[:80]) print('Has header?', b64str.startswith('data:')) # Try stripping the data: header if ',' in b64str: b64str = b64str.split(',', 1)[1] raw_bytes = base64.b64decode(b64str) buf = BytesIO(raw_bytes) img = Image.open(buf) print('Image OK:', img.format, img.size) "
~/intraaxial-pptx/build_pptx.py
Successfully replaced 1 instance(s) of the string in '/tmp/workspace/intraaxial-pptx/build_pptx.py'
python /tmp/workspace/intraaxial-pptx/build_pptx.py
ls -lh /tmp/workspace/intraaxial-pptx/Intra_Axial_Brain_Tumors.pptx
Intra Axial Brain Tumors
Presentation · PPTX
What's inside (14 slides):
| Slide | Content |
|---|---|
| 1 | Title Slide - Professional dark blue theme with seminar overview |
| 2 | Definition & Classification - Intra-axial definition + WHO CNS5 categories |
| 3 | GBM - Full CT/MRI/DWI/PWI/MRS + real GBM image (T2, T1+Gd, ADC) |
| 4 | IDH-Mutant Astrocytoma - T2/FLAIR Mismatch Sign + real MRI image |
| 5 | Oligodendroglioma - CT calcification + MRI + rCBV paradox + real image |
| 6 | Diffuse Midline Glioma (DIPG) - H3 K27M + thalamic glioma real image |
| 7 | Pilocytic Astrocytoma - Cyst+nodule pattern + real cerebellar image |
| 8 | Medulloblastoma - CT hyperdense + DWI restriction + real CT/MRI/histology |
| 9 | PCNSL - Ghost tumor + TME comparison image (GBM/Mets/PCNSL/Meningioma) |
| 10 | Brain Metastases - Imaging features + GBM vs Metastasis comparison table |
| 11 | Advanced MRI - DWI/PWI/MRS guide + multiparametric real imaging |
| 12 | Master Comparison Table - All tumors vs CT/T2/Gd/DWI/rCBV/MRS |
| 13 | Ring-Enhancing DDx - GRIING mnemonic + quick decision tool |
| 14 | 10 Key Take-Home Messages - Summary slide |