
Use of Pocus in ICU, include Physics of ultrasound, knobology, lung ultrasound, cardiac ultrasound, fluid assessment etc.
Reading File
Now let me search the medical library for POCUS/ICU ultrasound content across all relevant topics in parallel.
Finding Sources
Finding Sources
Finding Sources
Finding Sources
Finding Sources
Finding Sources
Finding Sources
Finding Sources
Excellent - found key sources. Now let me read the most relevant sections in parallel - Miller's Anesthesia POCUS/Critical Care section, Lung Ultrasound from Fishman's Pulmonary, and Physics from Murray & Nadel's.
Reading File
Reading File
Reading File
Reading File
Reading File
Reading File
Reading File
Reading File
Reading File
Reading File
Searching PubMed
point-of-care ultrasound ICU critical care
Now let me fetch key images and read the remaining critical sections on cardiac POCUS, fluid assessment, and knobology:
Loading Image
Loading Image
Loading Image
Reading File
Reading File
Loading Image
Loading Image
Reading File
I now have comprehensive content. Let me read the critical knobology and IVC/fluid sections:
Reading File
I now have all the information needed for a comprehensive response. Let me compile the complete guide.
POCUS in the ICU: A Comprehensive Guide
Sources: Murray & Nadel's Textbook of Respiratory Medicine; Miller's Anesthesia, 10e; Fishman's Pulmonary Diseases and Disorders
1. What is POCUS?
Point-of-care ultrasound (POCUS) is a targeted, clinician-performed bedside ultrasound aimed at answering specific binary clinical questions - it differs from comprehensive sonographer-performed studies. POCUS in the ICU enables rapid and repeated assessments to augment physical examination and physiologic monitoring. It is used for vascular access, cardiopulmonary evaluation, fluid assessment, and procedural guidance. Ultrasound skills have become a core competency in the ICU, endorsed by the Society of Critical Care Medicine (SCCM) guidelines. - Miller's Anesthesia, p. 11917
2. Physics of Ultrasound
Sound Waves and the Piezoelectric Effect
- Ultrasound uses sound pressure waves at 2-15 MHz (far above the human hearing range of 20-20,000 Hz)
- Crystals in the transducer vibrate when an electrical current is applied - the reverse piezoelectric effect - generating sound waves
- Returning echoes cause crystal vibration, converting mechanical energy back into electrical signals - the piezoelectric effect
- Tissue depth is calculated from the time-of-flight of returning echoes
Acoustic Impedance
Acoustic impedance is the resistance a tissue offers to sound wave propagation. At interfaces between tissues with different acoustic impedance, waves are reflected, scattered, or refracted. These reflected waves create the tissue images on screen. A dramatic impedance mismatch (e.g., soft tissue vs. air or bone) results in near-total reflection - which is why bone creates acoustic shadowing and air blocks imaging of lung parenchyma. - Murray & Nadel's, p. 578
Attenuation
Attenuation is the loss of wave energy via tissue absorption, producing a small amount of heat. Higher frequency = more attenuation = less penetration depth. This is the fundamental trade-off in ultrasound imaging.
Resolution
| Type | Definition | Best with... |
|---|---|---|
| Axial | Distinguishing structures along the beam axis (superficial vs. deep) | Higher frequency |
| Lateral | Distinguishing structures side-by-side, perpendicular to beam | Wider transducer, within focal zone |
The focal zone is the region of maximum image sharpness. Resolution degrades in the near and far fields beyond this zone.
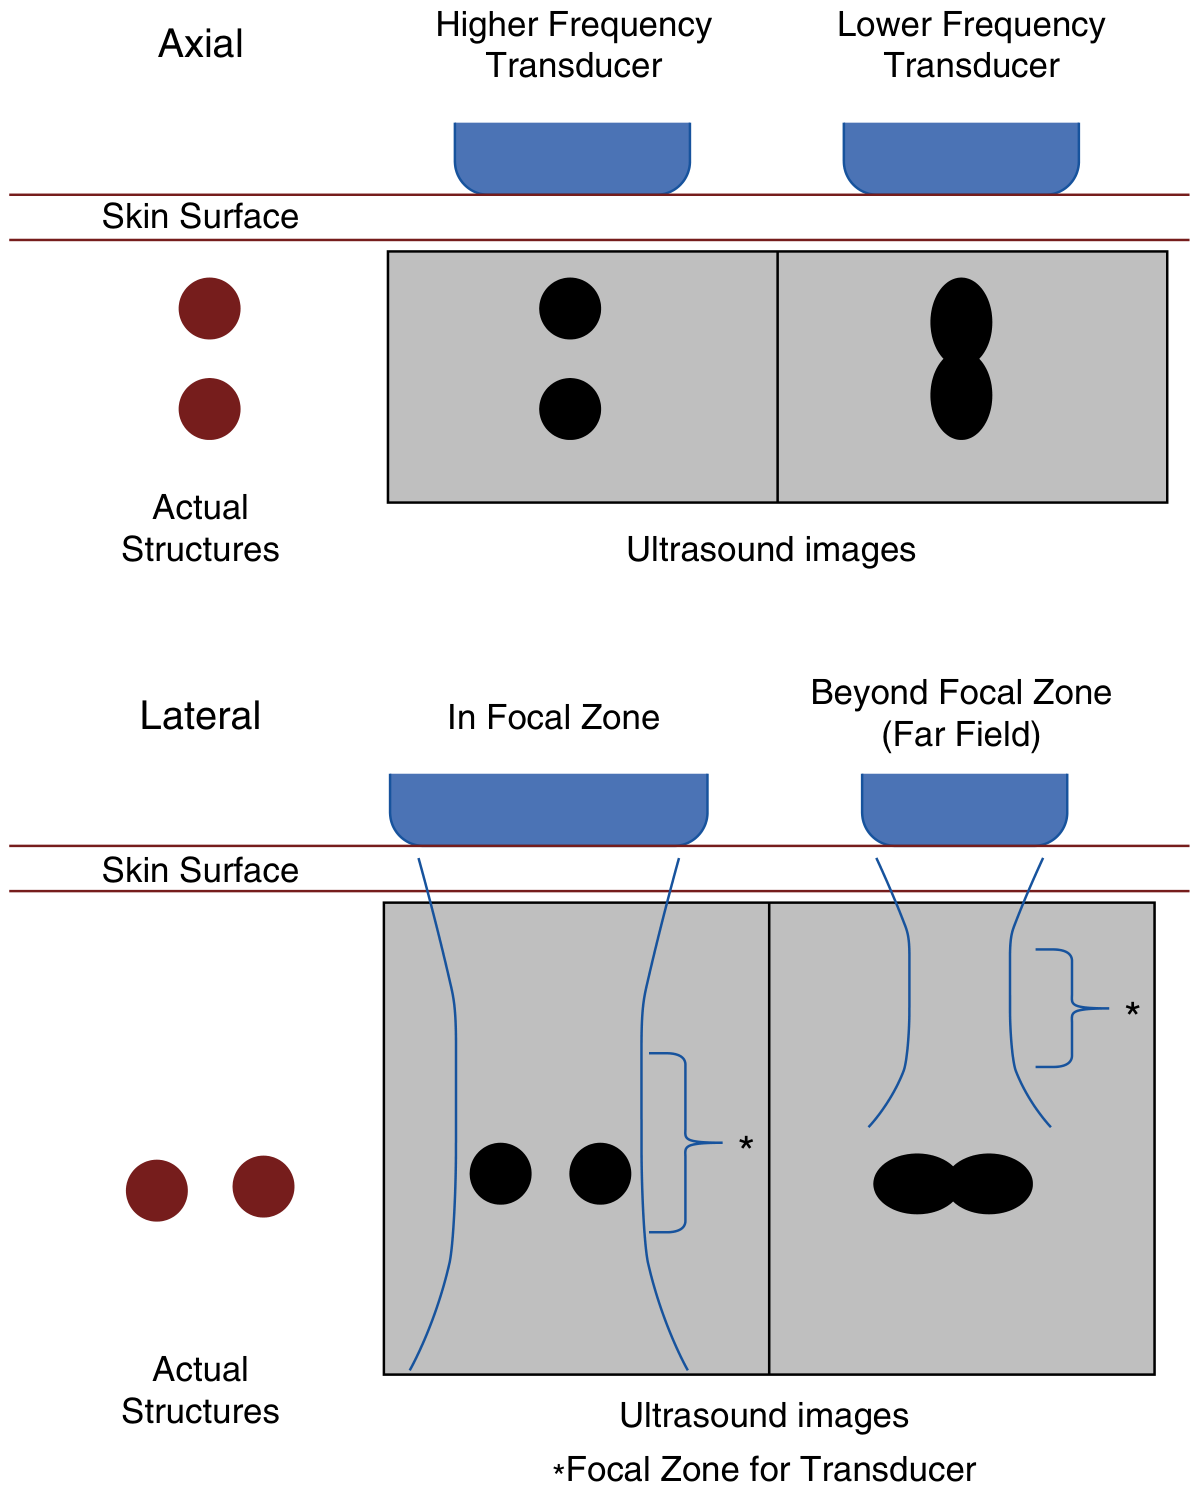
Fig: Axial resolution (top) is best with high-frequency transducers. Lateral resolution (bottom) is best within the focal zone - structures blend together in the far field.
Key principle: Higher frequency = better resolution but less depth. Lower frequency = worse resolution but greater penetration.
3. Transducer Selection
| Transducer Type | Frequency | Shape | Best Applications |
|---|---|---|---|
| Linear array | 5-13 MHz | Rectangular, flat | Superficial structures, vascular access, DVT |
| Phased array | 1-5 MHz | Small square footprint | Cardiac, lung (between ribs), IVC |
| Curvilinear (convex) | 2-5 MHz | Curved linear | Abdomen, thorax, deeper structures |
- For cardiac imaging: phased array (small footprint fits the intercostal window)
- For IVC: phased array or curvilinear
- For pleural/lung: phased array or linear (linear preferred for pneumothorax detection - 5-10 MHz, higher sensitivity 82% vs. 76%)
- For vascular access (CVC, arterial lines): high-frequency linear array
Murray & Nadel's, p. 579
4. Knobology: Machine Controls
The key controls on any POCUS machine:
| Control | Function | Clinical Tip |
|---|---|---|
| Depth | Distance from transducer; shallow = top of screen | Set so region of interest is mid-screen |
| Gain | Overall brightness of the image | Too low = dark/invisible structures; too high = "snowy" white noise everywhere |
| Time-Gain Compensation (TGC) | Depth-specific gain adjustment | Compensates for signal loss at depth; adjust sliders to equalize brightness from near to far field |
| Focus | Focal zone position | Set focal zone at the depth of interest for best lateral resolution |
| Frequency | Manually adjustable on many transducers | Increase for superficial targets, decrease for deeper targets |
| Freeze/Cine | Captures a loop of images | Review images retrospectively |
Modes available:
- B-mode (2D): Standard brightness mode - most common; pixel intensity proportional to echo strength
- M-mode (Motion mode): Plots signal intensity along a single line over time - used for lung sliding, diaphragm excursion, IVC variability
- Doppler (Color/Pulsed Wave/Continuous Wave): Detects blood flow direction and velocity - used for valvular assessment, cardiac output measurement (VTI)
5. Ultrasound Artifacts
Artifacts are not errors - many are diagnostically useful:
Acoustic Shadowing
Dense structures (bone, calcifications) reflect nearly all sound, leaving a dark "shadow" deep to them. The ribs create the characteristic shadow in lung imaging.
Acoustic Enhancement
Fluid-filled structures (cysts, blood vessels) attenuate sound minimally, making the tissue deep to them appear brighter. Useful to distinguish cysts from solid masses.
Reverberation Artifacts (A-lines)
When sound bounces repeatedly between two high-impedance interfaces (e.g., transducer surface and pleural line), the machine interprets each bounce as an additional tissue plane. This creates A-lines - equally spaced horizontal lines parallel to and below the pleural line.
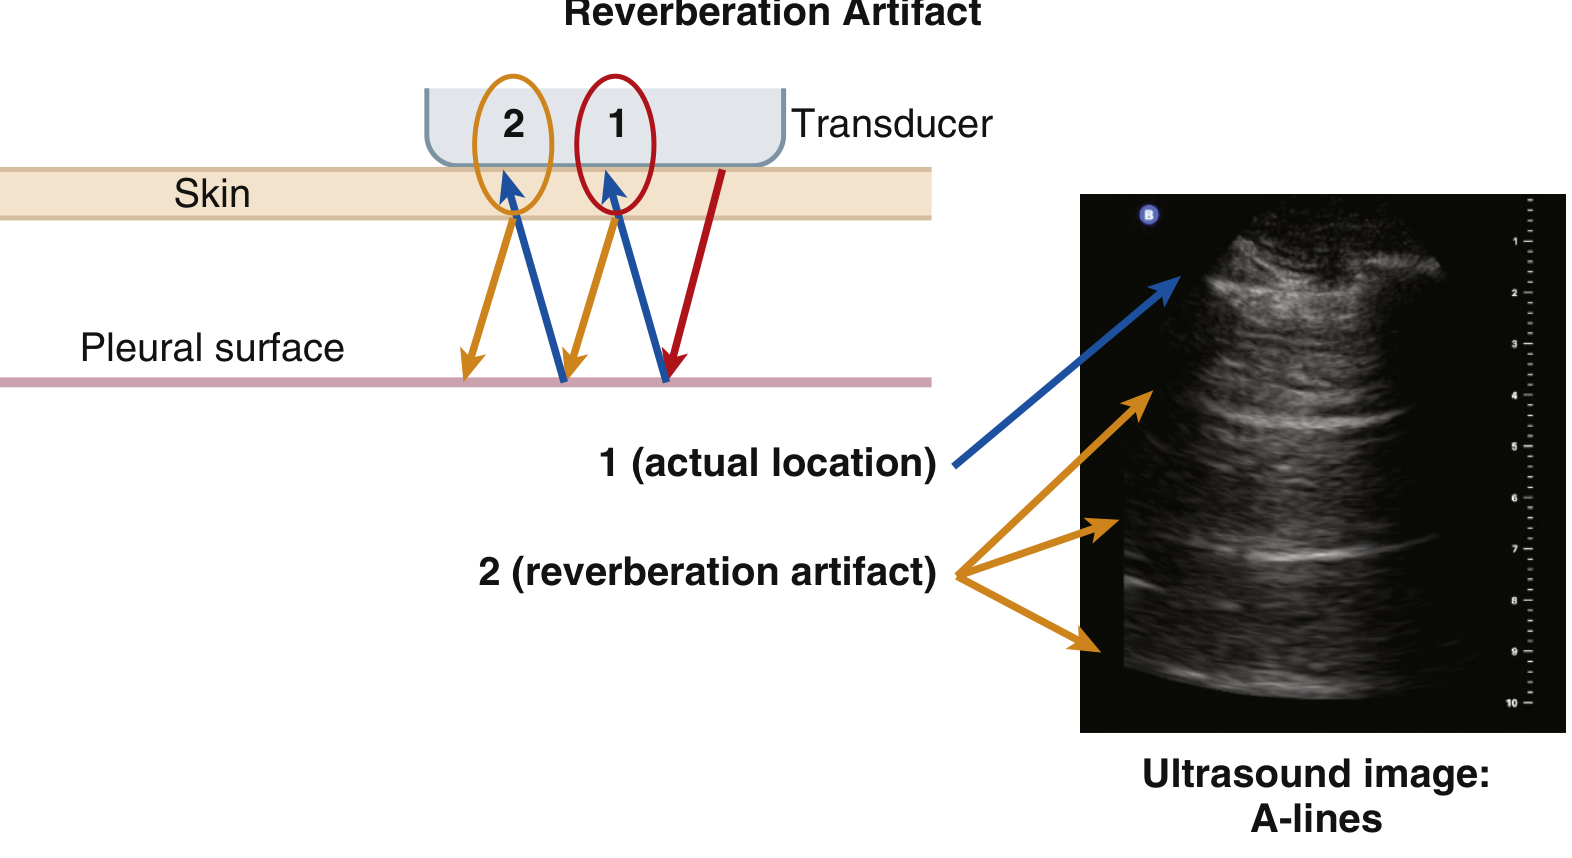
Fig: Reverberation artifact generating A-lines. Point 1 = actual pleural surface. Points 2, 3... = artifact echoes at multiples of that depth.
Mirror Image Artifact
Occurs at a smooth curved reflector (e.g., diaphragm). An object near the reflector appears duplicated on the other side. Can falsely suggest pathology "below" the diaphragm.
6. Lung Ultrasound
Normal lung is aerated and does not transmit ultrasound - only the pleural line is visualized. Everything beyond it is artifact. Changes or loss of these artifacts signal pathology.
Normal Lung Signs
| Sign | Description | Significance |
|---|---|---|
| Lung sliding | Shimmering/gliding of the pleural line with respiration ("ants on a twig") | Indicates visceral and parietal pleura in contact and moving; presence rules out pneumothorax at that location (NPV 100%) |
| A-lines | Horizontal reverberation lines equidistant from the pleural line | Normal aerated lung; also seen in pneumothorax |
| B-lines (comet tails) | Vertical hyperechoic streaks from pleural line to bottom of screen, erasing A-lines | 1-2 per rib space may be normal in dependent zones |
M-mode Signs
- Seashore (Sandy Beach) sign: Linear pattern above pleural line (stable soft tissue = "sky") transitions to grainy pattern below (lung sliding = "sandy beach") - NORMAL
- Barcode (Stratosphere) sign: Uniform horizontal lines throughout the entire depth - indicates no lung sliding (pneumothorax, apnea, pleural adhesions)
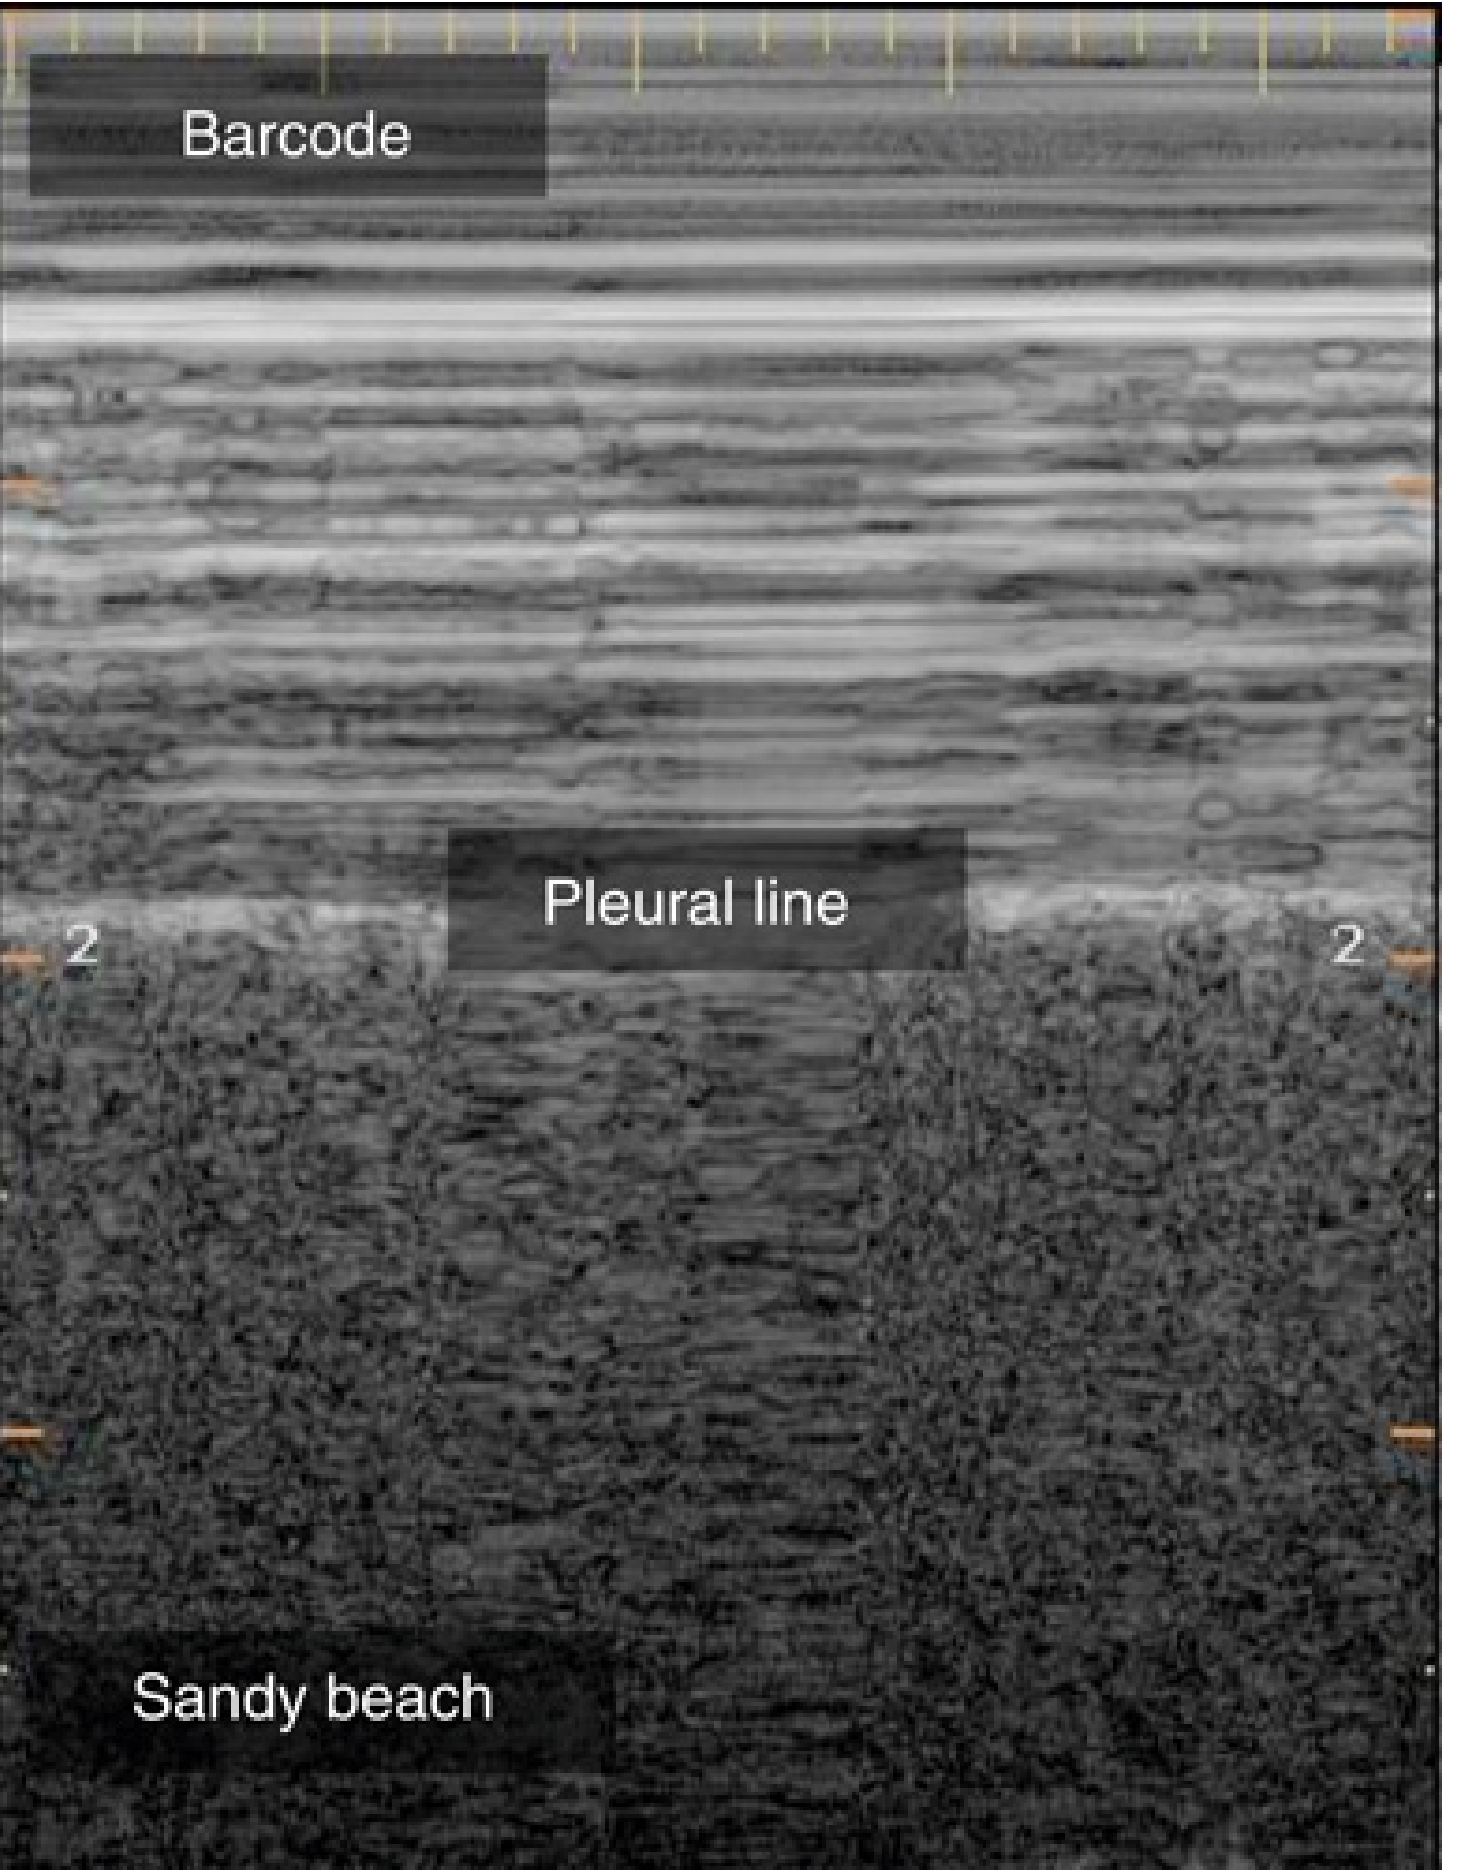
Fig: M-mode tracing. Upper half = barcode (no sliding). Lower half = sandy beach (normal sliding). The pleural line separates the two.
Pathological Patterns
1. Pneumothorax
- Loss of lung sliding + predominant A-lines + absence of B-lines
- Lung point: transition point between sliding and non-sliding - highly specific (specificity 100% in some studies) and locates the pneumothorax edge
- SCCM Grade 1A recommendation for ultrasound diagnosis of pneumothorax
- Sensitivity 95%, specificity 94% in ICU patients vs. CT
2. Pleural Effusion
- Anechoic (black) area between parietal and visceral pleura, typically at the posterior/lateral chest in a supine patient
- Atelectatic lung may be seen "floating" within the effusion
- Ultrasound is superior to CXR for detecting small effusions; guides thoracentesis (Grade 1A recommendation)
3. B-lines - Alveolar-Interstitial Syndrome
-
3 B-lines in a single rib space = pathologic (interlobular septal thickening from edema)
- Diffuse bilateral B-lines = cardiogenic pulmonary edema (PPV 87% for acute cardiogenic pulmonary edema)
- Focal B-lines with consolidation = pneumonia/ARDS
4. Consolidation
- Loss of aeration; lung takes on a tissue-like (hepatized) appearance
- Air bronchograms (bright spots moving with respiration) = pneumonia
- Fluid bronchograms = obstructive atelectasis
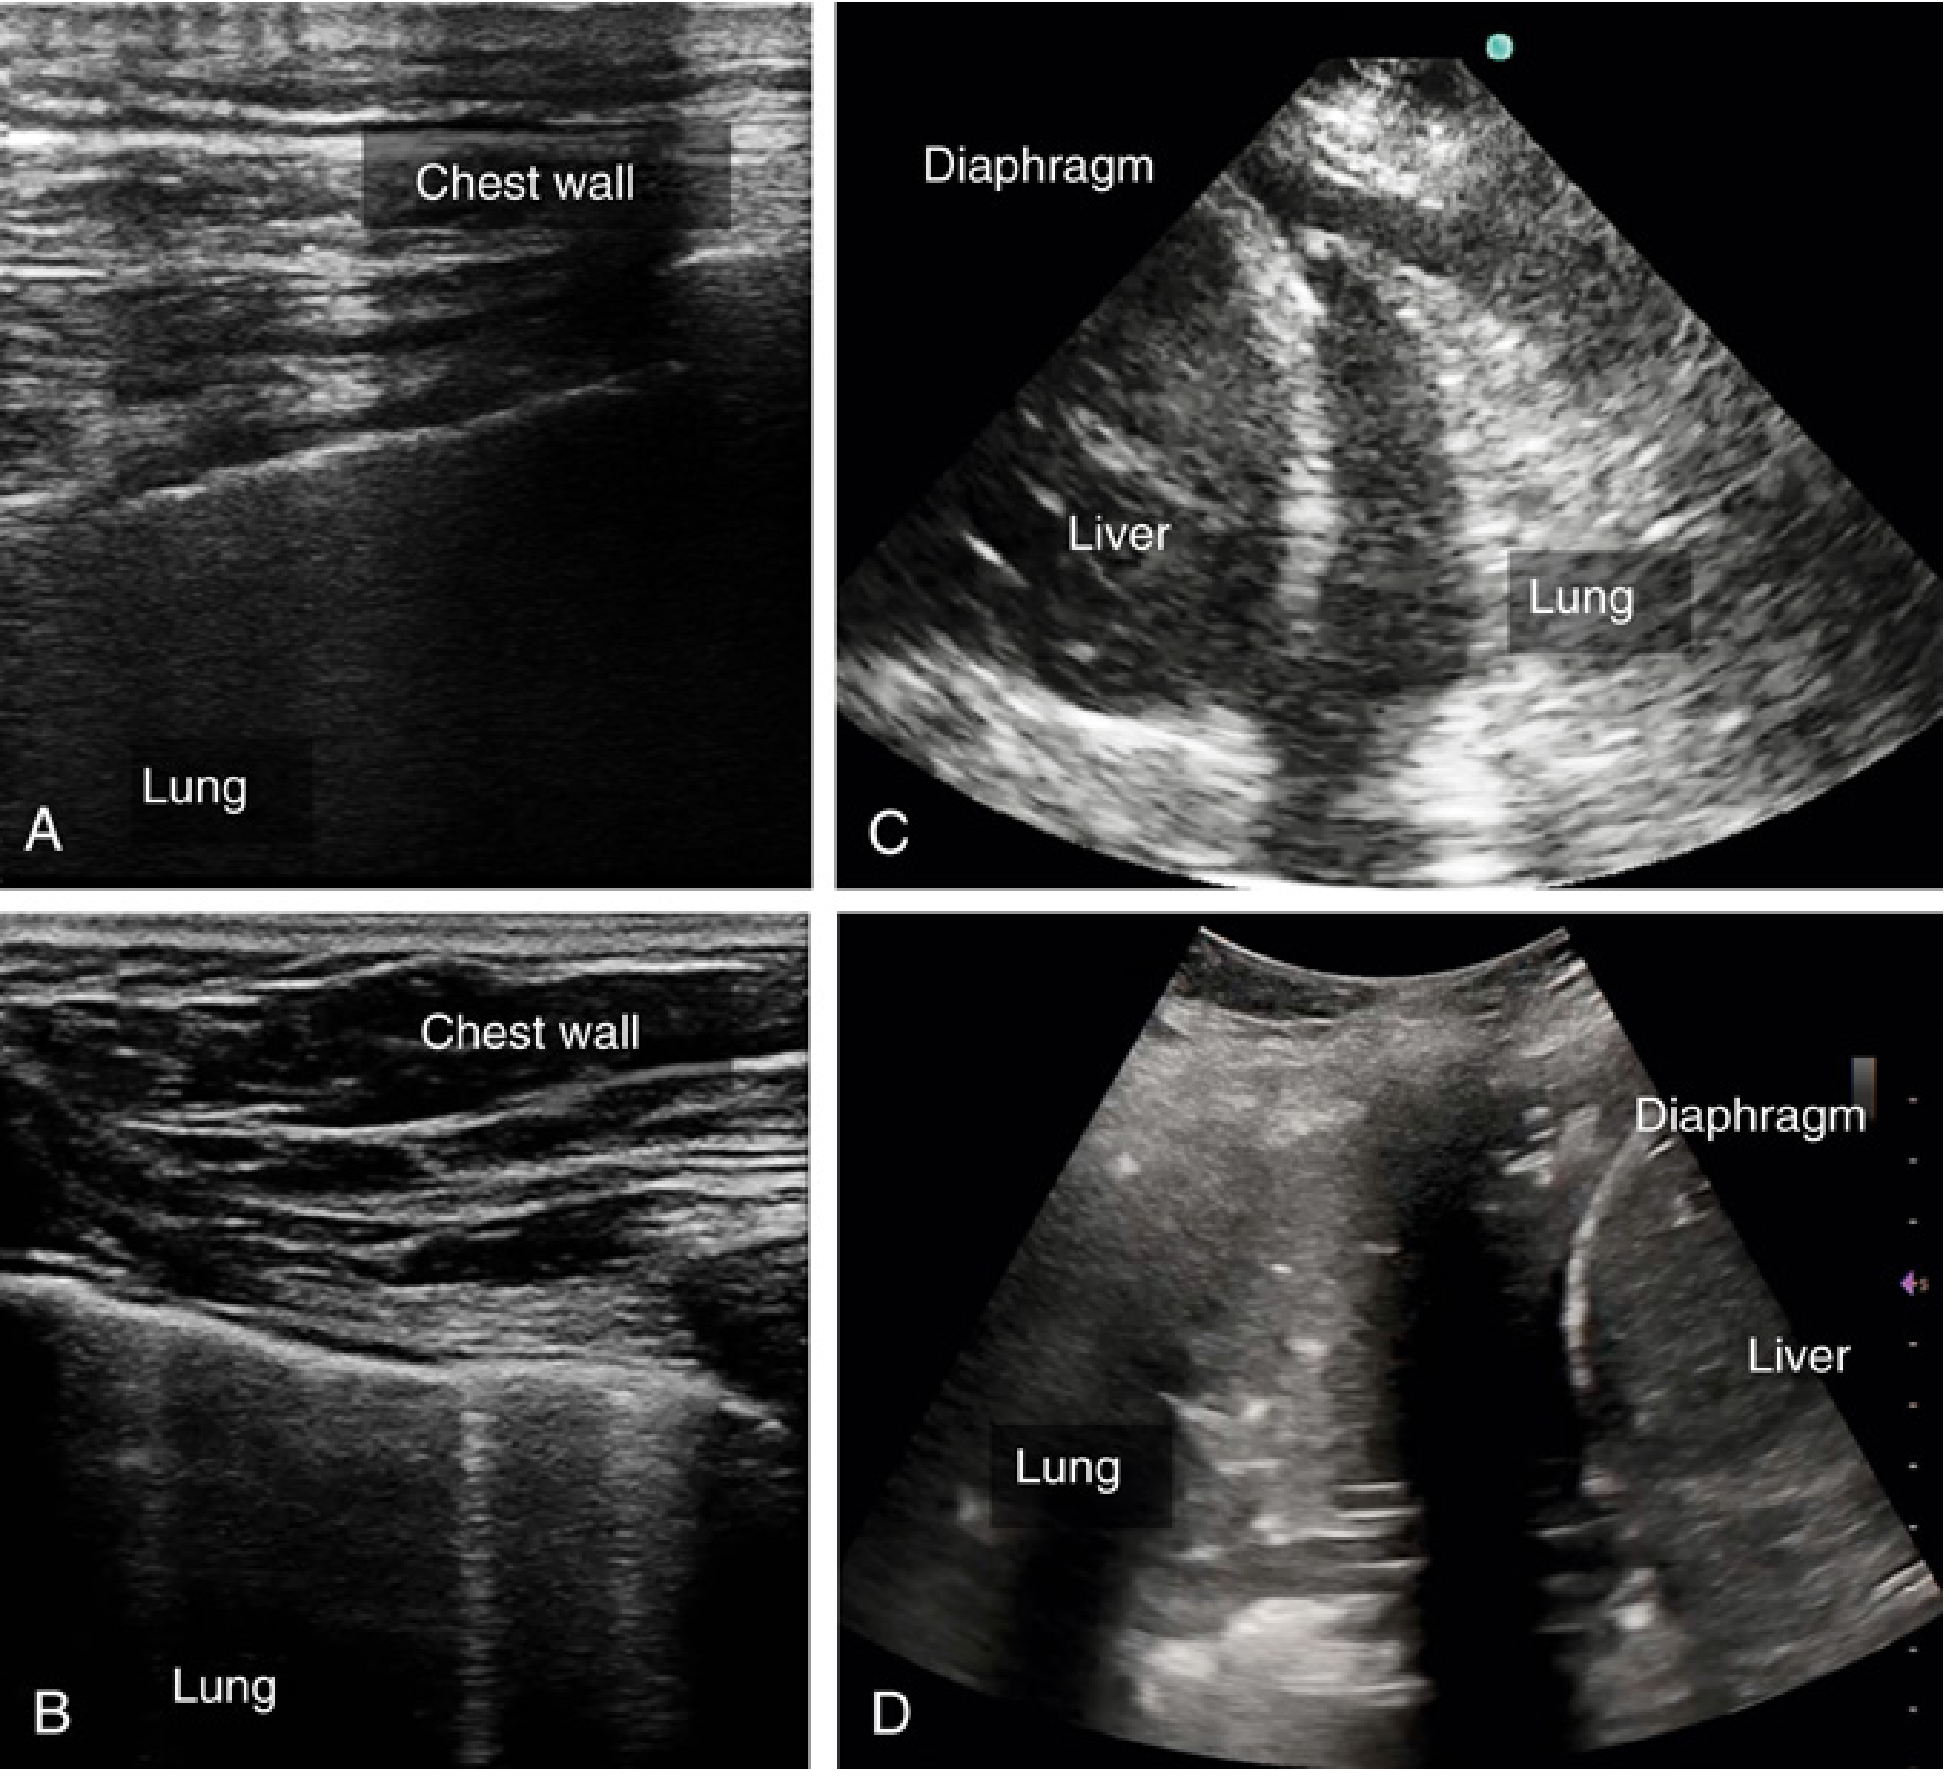
Fig: (A) Normal lung ultrasound. (B) Atelectatic lung floating in pleural effusion. (C) Confluent B-lines = severe pulmonary edema. (D) Consolidated lung with hyperechoic air bronchograms = pneumonia/ARDS.
BLUE Protocol
The BLUE (Bedside Lung Ultrasound in Emergency) Protocol uses standardized 6-zone lung scanning to differentiate causes of acute respiratory failure:
| Pattern | Likely Diagnosis |
|---|---|
| A-lines + DVT | Pulmonary embolism (PPV 94%) |
| A-lines only, no DVT | Asthma/COPD exacerbation |
| Diffuse bilateral B-lines | Cardiogenic pulmonary edema |
| Focal B-lines + consolidation | Pneumonia |
| Mixed A-B pattern | ARDS, atypical pneumonia |
| Absent sliding + A-lines + lung point | Pneumothorax |
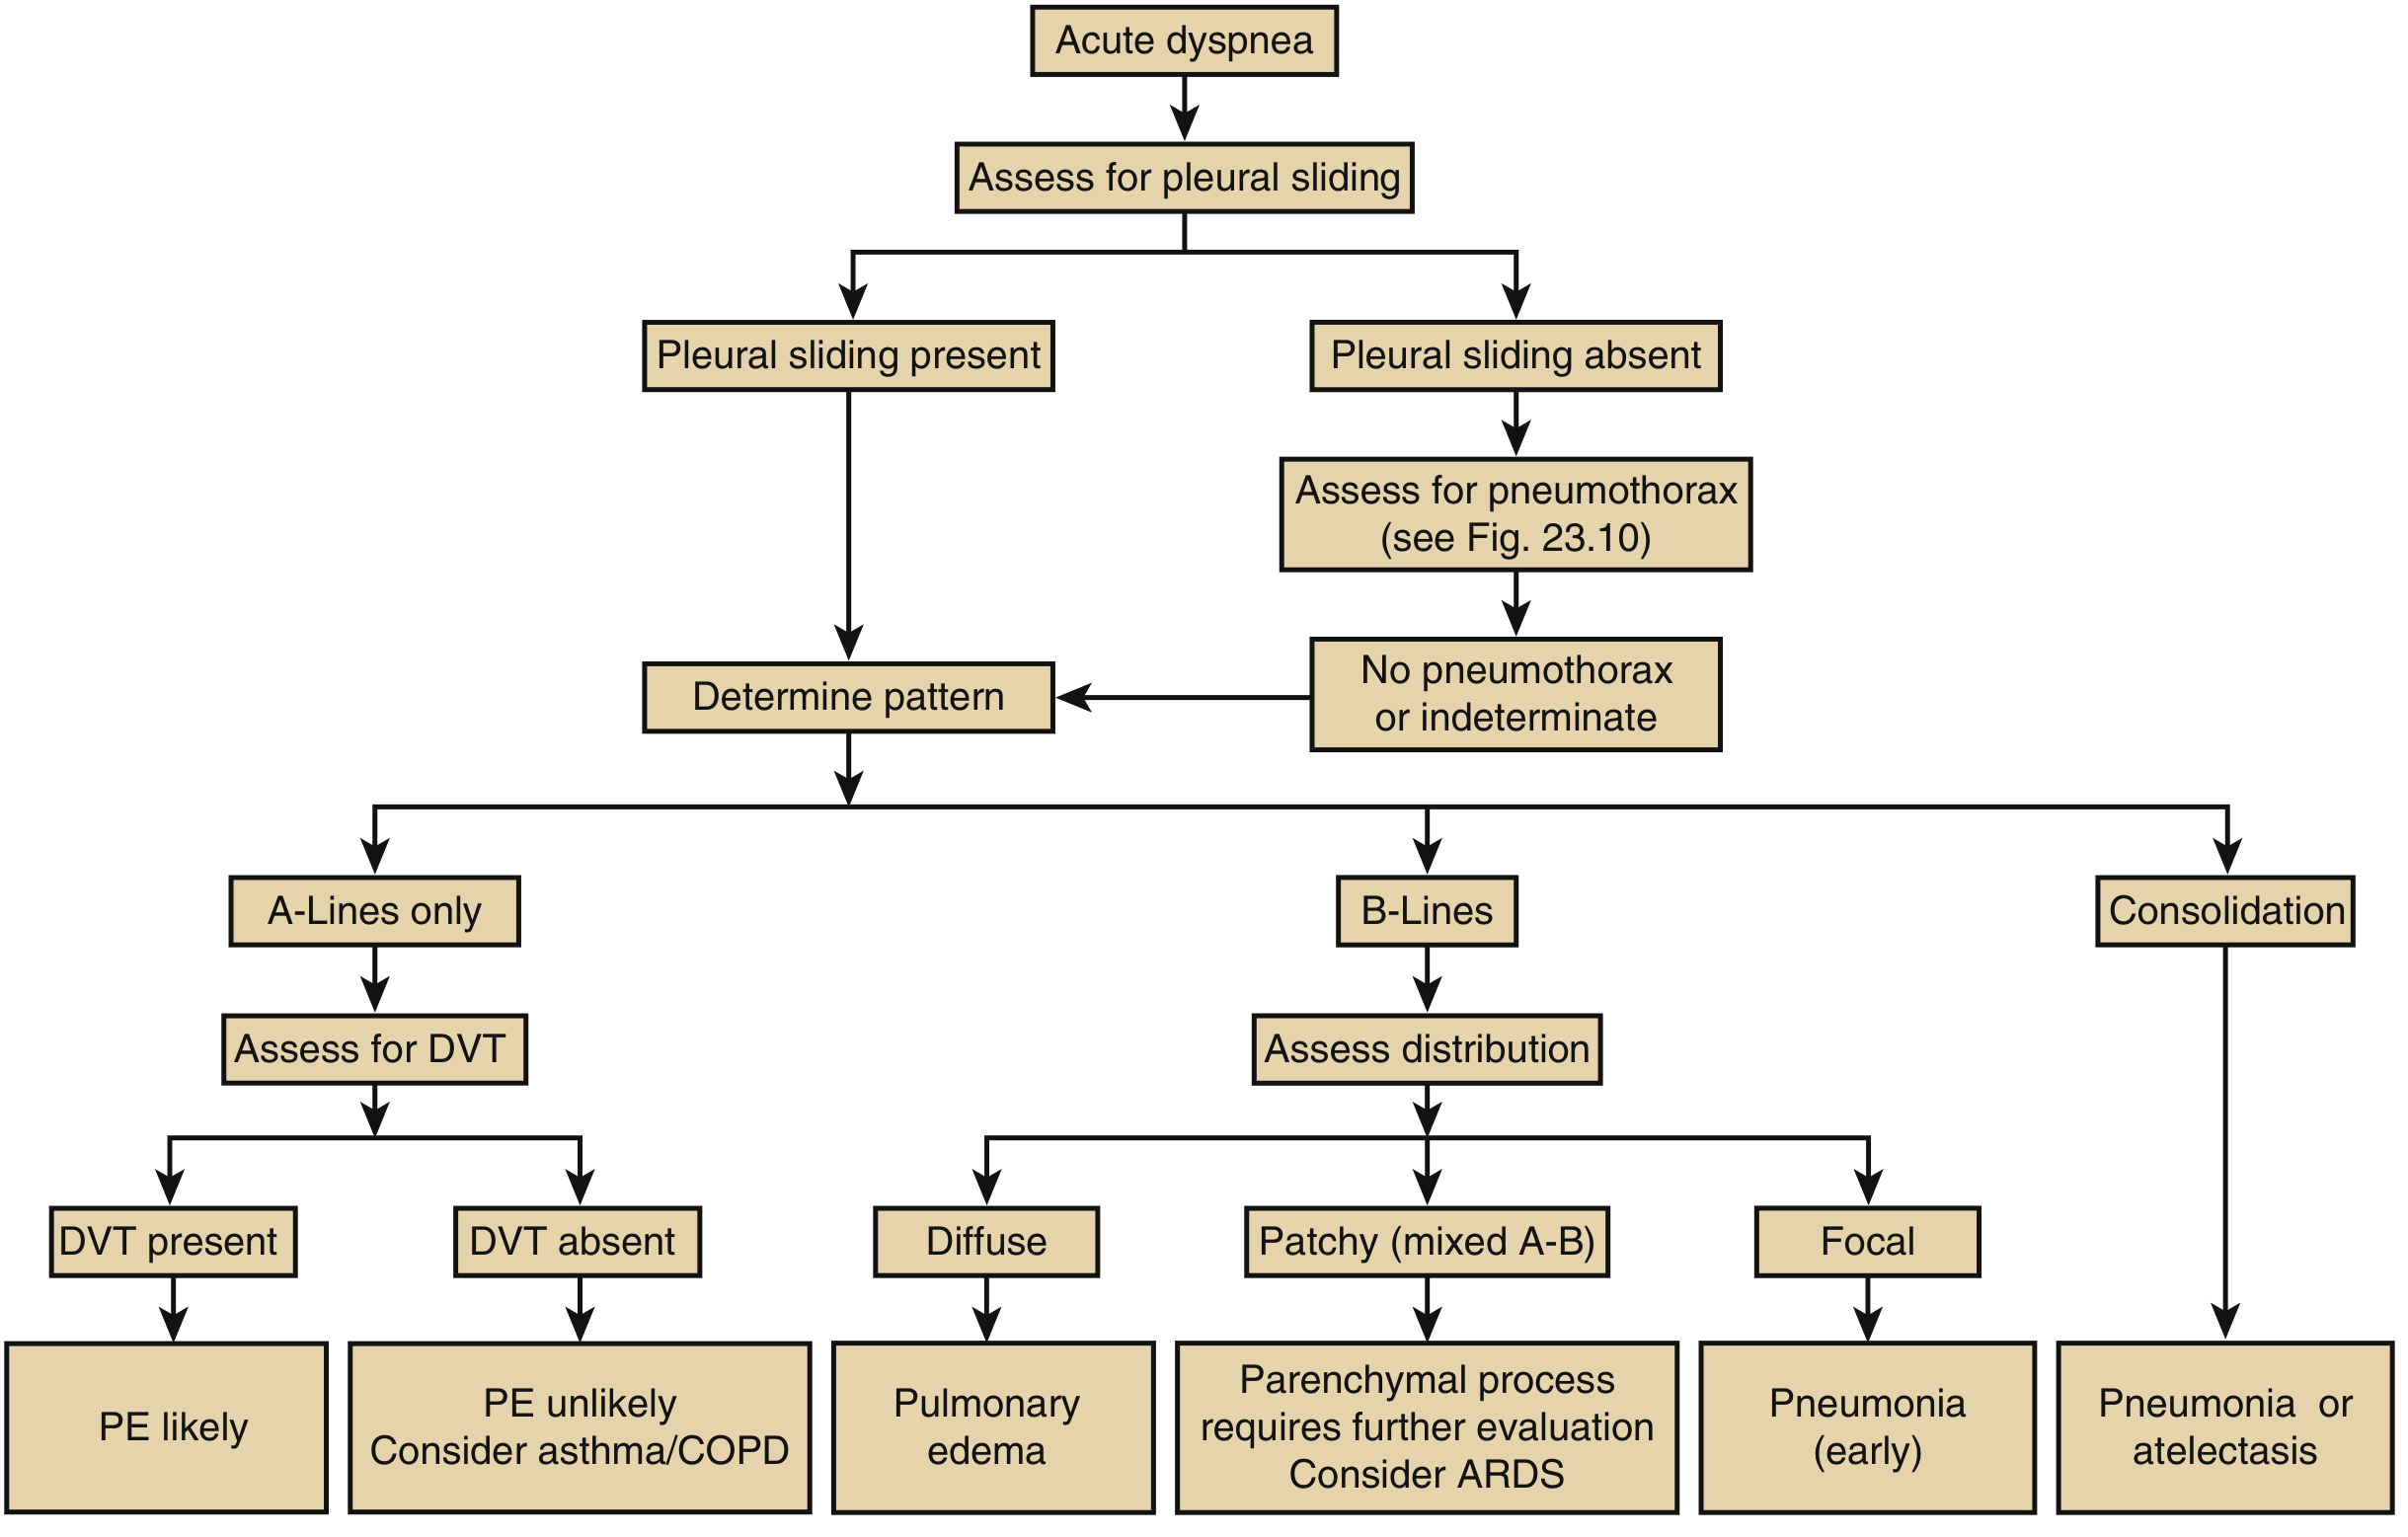
Fig: BLUE protocol algorithm. Begin with pleural sliding assessment, then characterize the lung artifact pattern and distribution to narrow the differential.
7. Cardiac Ultrasound (Critical Care Echocardiography)
Also called focused cardiac ultrasound (FoCUS) or point-of-care echocardiography (POCE), cardiac POCUS in the ICU answers targeted binary questions about the acutely deteriorating patient.
Standard Windows in Critical Care
| Window | Probe Position | Views Obtained |
|---|---|---|
| Parasternal | Left 2nd-4th ICS, parasternal | PLAX (long axis), PSAX (short axis) |
| Apical | Cardiac apex (5th ICS, MCL) | 4-chamber, 5-chamber, 2-chamber |
| Subcostal | Below xiphoid, angled up | 4-chamber, IVC |
| Suprasternal | Suprasternal notch | Aortic arch |
What Cardiac POCUS Assesses
| Finding | Clinical Significance |
|---|---|
| LV systolic function (eyeball EF) | Cardiogenic vs. non-cardiogenic shock; guide inotrope use |
| LV size and wall motion | Regional wall motion abnormalities = ischemia; dilated LV = cardiomyopathy |
| RV size and function | RV dilation = massive PE, ARDS, or RV failure; McConnell sign in PE |
| Pericardial effusion / tamponade | Anechoic rim around heart; RV collapse in diastole = tamponade |
| Gross valvular pathology | Severe aortic stenosis, mitral regurgitation |
| IVC | Volume status/responsiveness (see below) |
| Elevated filling pressures | Dilated non-collapsing IVC, dilated LA |
Shock Differentiation by Cardiac POCUS
| Shock Type | POCUS Findings |
|---|---|
| Distributive (septic) | Hyperdynamic LV (small, vigorous); normal or small IVC |
| Cardiogenic | Dilated, poorly contracting LV; dilated IVC; B-lines on lung US |
| Obstructive (PE) | Dilated RV, D-sign (septal flattening), McConnell sign, DVT |
| Obstructive (tamponade) | Pericardial effusion, RV diastolic collapse, plethoric IVC |
| Hypovolemic | Hyperdynamic LV, small/collapsible IVC, empty ventricles |
Miller's Anesthesia, Table 79.3
8. Fluid Assessment (Volume Status and Responsiveness)
IVC Assessment
The inferior vena cava (IVC) is imaged with a phased array or curvilinear probe from the subcostal or subxiphoid window in the longitudinal plane. M-mode is applied to measure the maximum (IVCmax) and minimum (IVCmin) diameters.
Collapsibility Index (CI) in spontaneously breathing patients:
CI = (IVCmax - IVCmin) / IVCmax × 100%
- CI >50% suggests fluid responsiveness (preload-dependent)
- CI <50% suggests the patient is unlikely to be fluid responsive
Distensibility Index (DI) in mechanically ventilated patients (tidal volume 8 mL/kg):
DI = (IVCmax - IVCmin) / IVCmin × 100%
- DI >18% suggests fluid responsiveness
Limitations:
- Arrhythmias, high PEEP, RV failure, tricuspid regurgitation, and spontaneous breathing efforts in ventilated patients all confound IVC assessment
- IVC should never be used in isolation - always integrate with cardiac function, clinical context, and lung ultrasound findings
Lung Ultrasound for Fluid Assessment
Lung POCUS can detect and monitor pulmonary edema as a surrogate for volume overload:
- Progressive B-lines with fluid resuscitation = developing interstitial edema
- Reduction in B-lines after diuresis = improved interstitial fluid
- Bilateral B-lines after aggressive resuscitation = fluid overload warning
VTI (Velocity-Time Integral) and Cardiac Output
Using pulsed-wave Doppler in the apical 5-chamber view at the LVOT:
- VTI measures the stroke volume integral
- Stroke Volume = LVOT area × VTI
- Cardiac output = SV × HR
- A 10-15% increase in VTI after passive leg raise (PLR) or a small fluid challenge predicts fluid responsiveness more accurately than IVC alone
A recent systematic review (Critical Care Explorations 2025) on CCU ultrasonography for volume management found that while ultrasound-guided resuscitation is widely used, robust RCT data confirming improvement in hard outcomes remains limited (PMID: 40366291).
9. Vascular Ultrasound
Central Venous Access (CVC)
- Real-time ultrasound guidance is a SCCM Grade 1B recommendation (Grade 1A for IJV and femoral veins)
- Short-axis (transverse) view: visualizes surrounding structures, lower training requirement, higher success rate in most studies
- Long-axis view: reduces posterior wall puncture but requires more skill
- The IJV overlies the carotid artery in >50% of patients - ultrasound prevents inadvertent arterial cannulation
Arterial Cannulation
- Grade 2B SCCM recommendation
- Meta-analysis: real-time guidance decreases time to cannulation and hematoma formation
- Particularly valuable in ICU patients with edema, peripheral vascular disease, or weak pulses
DVT Assessment
- Two-point or whole-leg compression ultrasound
- Loss of venous compressibility = DVT
- Sensitivity 86%, specificity 96% even with inexperienced practitioners
- SCCM Grade 1B recommendation
- Integral to BLUE protocol when evaluating for PE
10. Other ICU POCUS Applications
| Application | What to Look For |
|---|---|
| Optic nerve sheath diameter (ONSD) | ONSD >5 mm correlates with raised ICP (>20 mmHg); subxiphoid position behind the globe |
| Diaphragm ultrasound | M-mode excursion and thickening fraction; predicts ventilator weaning success |
| Gastric ultrasound | Assess gastric contents before extubation or intubation - full vs. empty stomach |
| Airway ultrasound | Confirm ETT placement (tracheal vs. esophageal); assess for subglottic edema pre-extubation |
| FAST exam | Free fluid in abdomen/pelvis in trauma patients |
| Abdominal ultrasound | Hydronephrosis, cholecystitis, bladder volume |
11. Protocols Summary
| Protocol | Purpose | Key Components |
|---|---|---|
| BLUE | Acute respiratory failure | 6-zone lung US + DVT assessment |
| FALLS | Fluid resuscitation endpoint | Serial lung US for B-line appearance |
| RUSH | Undifferentiated shock | Heart + IVC + lung + aorta |
| FATE | Focused cardiac | 4 standard echo windows |
| FEEL | Cardiac arrest | Subcostal during pulse check |
Recent Evidence
Three recent systematic reviews are worth noting:
- A 2024 systematic review and meta-analysis (Basmaji et al., Crit Care Med, PMID 39298556) found that POCUS-guided resuscitation improved clinical outcomes in patients with shock, supporting its use as a resuscitation tool.
- A 2025 meta-analysis (PMID 40366291) on critical care ultrasonography for volume management found that while it is widely used for guiding fluid therapy, the evidence base for improved hard patient outcomes from RCTs remains evolving.
- A 2025 systematic review (PMID 41430150) confirmed high diagnostic accuracy of POCUS for confirming ETT placement in acute care settings.
Key Takeaways
- POCUS in the ICU answers targeted binary questions - it supplements but does not replace comprehensive imaging
- High frequency = better resolution, less depth. Low frequency = worse resolution, greater depth
- Normal lung POCUS shows sliding + A-lines; B-lines are the key sign of interstitial fluid; absence of sliding + A-lines + lung point = pneumothorax
- Cardiac POCUS rapidly differentiates shock types using LV/RV function, pericardial space, and IVC
- IVC collapsibility/distensibility guides fluid responsiveness - always interpreted in clinical context
- Ultrasound guidance for CVC is Grade 1A/1B evidence and should be standard practice
- BLUE, RUSH, and FALLS protocols systematize POCUS assessment in acute respiratory failure and shock
This is a shared conversation. Sign in to Orris to start your own chat.