
Basics I should know about echocardiography and especially related to atrial fibrillation
echocardiography atrial fibrillation left atrial appendage thrombus
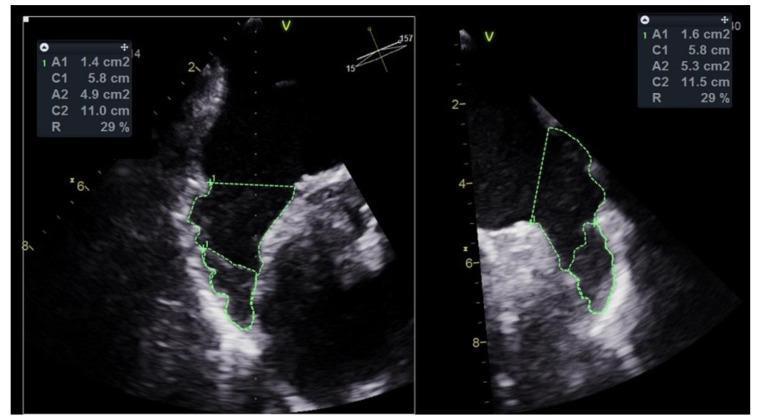
This diagnostic image consists of two side-by-side transesophageal echocardiography (TEE) views demonstrating the assessment of a thrombus within the left atrial appendage (LAA). The left pane shows a view at approximately 157 degrees, while the right pane shows a complementary projection. In both images, green dashed planimetry lines delineate the boundaries of the LAA (A2) and the specific area occupied by an intra-cavitary thrombus (A1). The thrombus appears as a discrete, hypoechoic mass localized within the distal portion of the appendage. On-screen data boxes provide quantitative measurements: Area 1 (A1) represents the thrombus area, and Area 2 (A2) represents the total LAA area. The calculated ratio (R) in both projections indicates that the thrombus occupies approximately 29% of the LAA area. This diagnostic approach is critical for pre-procedural planning in Percutaneous Left Atrial Appendage Closure (PLAAC) for patients with atrial fibrillation and high thromboembolic risk, as it allows for the characterization of thrombus size and volume relative to the landing zone of the occluder device.
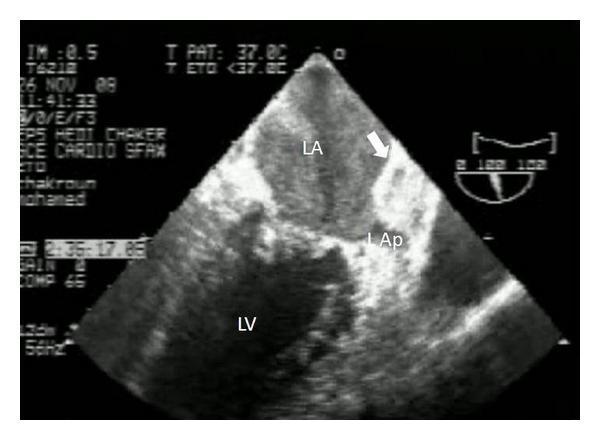
This diagnostic ultrasound image is a transesophageal echocardiography (TEE) view of the heart. Key anatomical structures labeled include the left atrium (LA), left ventricle (LV), and left atrial appendage (L Ap). A prominent abnormality is identified by a white arrow, indicating a large, well-circumscribed, echogenic mass situated within the left atrium and extending into the left atrial appendage. The left atrial cavity also exhibits significant spontaneous echo contrast (SEC), often referred to as 'smoke,' which is a marker of blood stasis. In the clinical context of rheumatic mitral stenosis and atrial fibrillation, these findings are highly suggestive of a large intra-atrial thrombus. The image illustrates critical diagnostic features used in cardiology for assessing embolic risk and evaluating intracardiac masses, such as organized thrombi or myxomas, in patients with valvular heart disease.
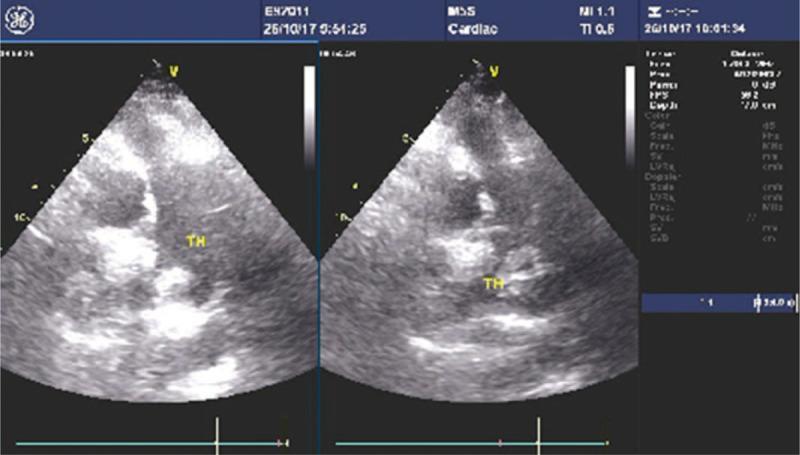
This diagnostic image consists of side-by-side grayscale transesophageal echocardiography (TEE) frames focused on the left heart structures. The primary finding is a large, well-defined echogenic mass labeled 'TH', representing a thrombus, situated within the left atrial appendage (LAA). The thrombus appears heterogeneous and slightly more hyperechoic than the surrounding myocardial tissue. The background shows characteristic echocardiographic features of an enlarged left atrium, consistent with clinical findings of dilated cardiomyopathy and atrial fibrillation. Metadata on the display indicates the image was acquired using a GE healthcare ultrasound system with a cardiac probe (M5S), noting mechanical index (MI) and thermal index (TI) parameters. This visual demonstrates a critical clinical complication of atrial fibrillation—thrombosis despite anticoagulant therapy—and highlights the role of TEE in screening prior to procedures like catheter ablation.
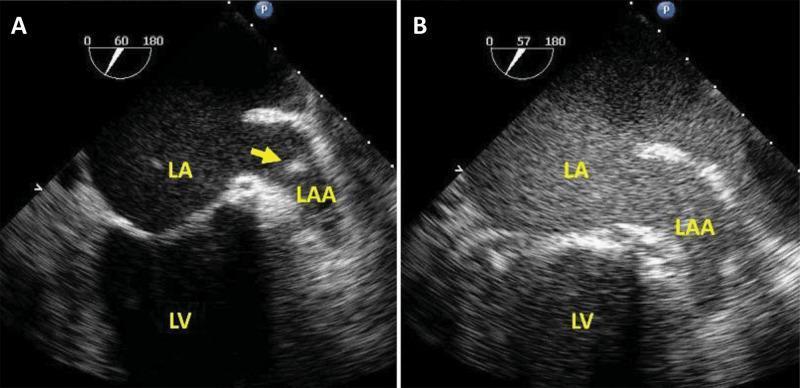
This diagnostic comparison demonstrates the utility of Ultrasound Enhancing Agents (UEA) in transesophageal echocardiography (TEE) for evaluating the left atrial appendage (LAA). Two mid-esophageal views are shown: (A) a non-enhanced baseline image and (B) a contrast-enhanced image. Labels indicate the Left Atrium (LA), Left Atrial Appendage (LAA), and Left Ventricle (LV). In panel A, the LAA contains a distinct hyperechoic signal (yellow arrow) alongside spontaneous echo contrast (known as 'smoke'), which can mimic or mask a thrombus. In panel B, following the administration of a microbubble-based intravenous enhancing agent, the LAA cavity is uniformly opacified. The absence of a filling defect in the contrast-enhanced view effectively rules out an intracavitary thrombus, clarifying that the initial findings were artifacts or stasis. This imaging technique is clinically significant for ensuring procedural safety prior to atrial fibrillation cardioversion, as it provides a higher diagnostic confidence level for excluding embolic sources compared to standard non-contrast 2D echocardiography.
echocardiography views parasternal apical subcostal diagram
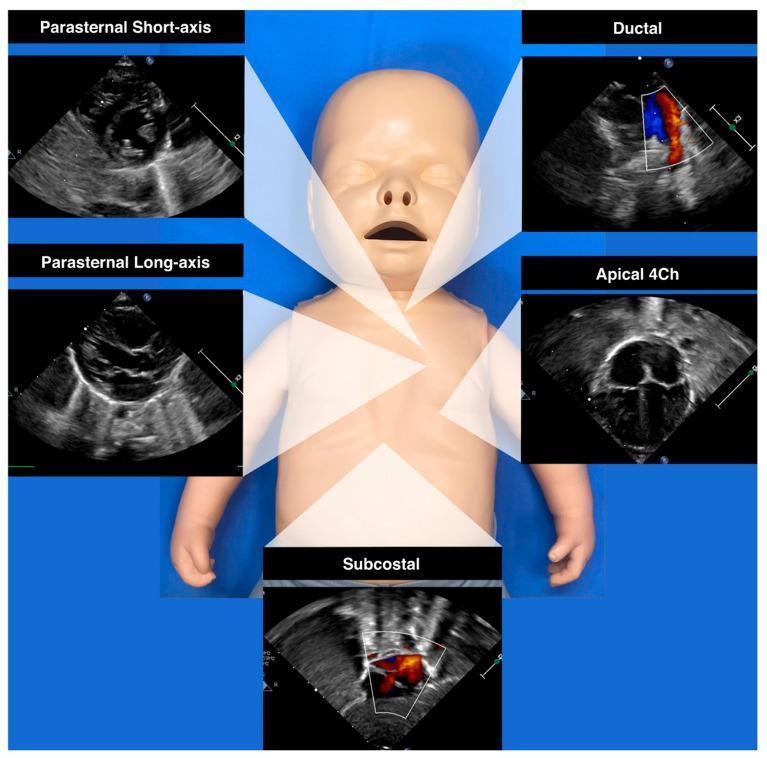
Educational medical graphic illustrating standard Neonatologist-Performed Echocardiography (NPE) views using a central neonatal mannequin as a reference for transducer placement. The composite includes five labeled diagnostic ultrasound panels: 1) Parasternal Short-axis, providing a cross-sectional view of the ventricles; 2) Parasternal Long-axis, showing the longitudinal orientation of the left ventricle, right ventricle, and aortic outflow; 3) Ductal view, utilizing color Doppler to visualize blood flow through the ductus arteriosus (DA) with red and blue signals indicating directionality; 4) Apical 4-chamber (4Ch), showing the four cardiac chambers from the apex; and 5) Subcostal view, displaying color Doppler flow within the central heart structures. The diagram is designed for clinical training in neonatal cardiology, specifically for evaluating hemodynamic stability, cardiac anatomy, and patent ductus arteriosus (PDA) shunting patterns. Red and blue Doppler signals in the ductal and subcostal views facilitate the assessment of bidirectional or turbulent flow, critical for identifying shunts or 'steal phenomenon' in premature infants.
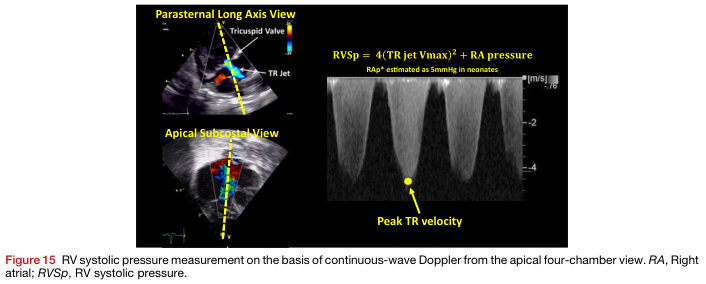
Summary : This figure demonstrates the measurement of right ventricular systolic pressure (RVSp) using continuous-wave Doppler echocardiography, specifically from the apical four-chamber view. It shows the anatomical views used to visualize the tricuspid regurgitation (TR) jet and the Doppler waveform used to calculate RVSp.
spontaneous echo contrast left atrium smoke atrial fibrillation TEE
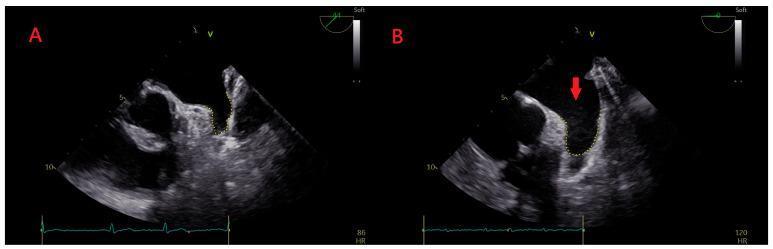
This diagnostic image consists of two side-by-side transesophageal echocardiograms (TEE) labeled A and B, demonstrating the presence of spontaneous echo contrast in the left atrium. Image A shows a baseline TEE of the left atrium and left atrial appendage with a clear, anechoic blood pool, indicating the absence of spontaneous echo contrast (SEC). Image B displays the same anatomical region but reveals visible Left Atrial Spontaneous Echo Contrast (LASEC), also known as 'smoke.' This finding is highlighted by a red arrow pointing to the faint, swirling, echogenic material within the left atrial cavity. The presence of LASEC is a critical clinical finding in patients with atrial fibrillation, as it indicates blood stasis and an increased risk for thrombus formation and thromboembolic events. The images include technical annotations such as imaging plane angles (0 and 44 degrees) and heart rate indicators at the bottom.
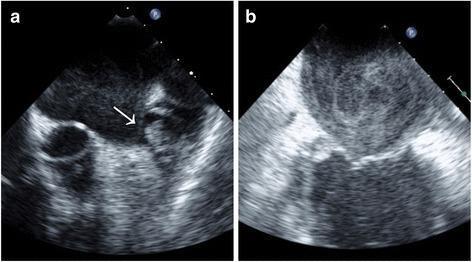
This diagnostic image consists of two panels (a and b) showing transesophageal echocardiogram (TEE) views of the heart, specifically focusing on the left atrium (LA) and left atrial appendage (LAA). Panel (a) demonstrates a left atrial appendage thrombus, identified by the white arrow. The thrombus appears as a discrete, echo-dense, circumscribed intracavitary mass clearly separated from the underlying endocardium and pectinate muscles. Panel (b) illustrates left atrial spontaneous echo contrast (SEC), frequently referred to as 'smoke.' This is characterized by hazy, swirling, cloud-like echoes within the atrial chamber that represent blood stasis and an increased risk for thromboembolism. These images are clinically significant for the evaluation of stroke risk in patients with atrial fibrillation or structural heart disease, highlighting the visual distinction between a formed solid thrombus (a) and the dynamic precursor state of spontaneous echo contrast (b).
This diagnostic ultrasound image is a transesophageal echocardiography (TEE) view of the heart. Key anatomical structures labeled include the left atrium (LA), left ventricle (LV), and left atrial appendage (L Ap). A prominent abnormality is identified by a white arrow, indicating a large, well-circumscribed, echogenic mass situated within the left atrium and extending into the left atrial appendage. The left atrial cavity also exhibits significant spontaneous echo contrast (SEC), often referred to as 'smoke,' which is a marker of blood stasis. In the clinical context of rheumatic mitral stenosis and atrial fibrillation, these findings are highly suggestive of a large intra-atrial thrombus. The image illustrates critical diagnostic features used in cardiology for assessing embolic risk and evaluating intracardiac masses, such as organized thrombi or myxomas, in patients with valvular heart disease.
Echocardiography: Basics and Atrial Fibrillation
1. What Is Echocardiography?
2. Types of Echocardiography
Transthoracic Echocardiography (TTE)
Transesophageal Echocardiography (TEE)
Stress Echocardiography
Contrast Echocardiography
3D Echocardiography
Intracardiac Echocardiography (ICE)
3. Standard Views
| Window | Key Structures Visualized |
|---|---|
| Parasternal long-axis | LV, aortic root, mitral valve, left atrium |
| Parasternal short-axis | LV cross-section (muscle mass, wall motion), aortic valve, pulmonary artery |
| Apical 4-chamber | All four chambers, mitral + tricuspid valves, LV apex |
| Subcostal (subxiphoid) | IVC, RA, pericardial effusion; useful in ventilated patients |
4. Doppler Echocardiography
Key Modes
Key Equations
- Simplified Bernoulli: ΔP = 4v² - calculates pressure gradients across stenotic valves
- Stroke Volume: SV (cm³) = CSA (cm²) × VTI (cm) - used for CO and valve area calculations - Goldman-Cecil Medicine, p. 436
5. What Echo Can Tell You
| Parameter | How Measured |
|---|---|
| LV ejection fraction (EF) | Biplane Simpson's method (apical 4- and 2-chamber) |
| LV wall motion | Visual + quantitative assessment in each segment |
| Diastolic function | E/A ratio, E/e' ratio, LA volume, TR velocity |
| Valve stenosis | Mean gradient (Doppler), valve area (continuity equation) |
| Valve regurgitation | Vena contracta, PISA, regurgitant fraction |
| LA size | LA volume index (normal <34 mL/m²) |
| PA systolic pressure | 4 × (TR velocity)² + RAP |
| Pericardial effusion | Echo-free space around the heart; tamponade signs |
6. Echo in Atrial Fibrillation - The Key Points
Why Echo Matters in AF
6a. Left Atrial Appendage (LAA) Thrombus - The Most Critical Finding
- TTE cannot reliably visualize the LAA - it is a posterior structure, distant from the chest wall transducer, and the appendage is hidden behind the left superior pulmonary vein ridge
- TEE is the gold standard for LAA thrombus assessment (sensitivity ~95%, specificity ~99% for LV thrombus; LAA is even more TEE-dependent)
- LAA thrombus appears as an echogenic mass distinct from the endocardium, inside the appendage
- Contrast-enhanced CT angiography (delayed acquisition) is an alternative to TEE when TEE is not feasible, with comparable sensitivity/specificity - Harrison's Principles of Internal Medicine, p. 1072
6b. Spontaneous Echo Contrast (SEC) - "Smoke"
- Much better seen on TEE than TTE (higher frequency, closer proximity to LA)
- Associated with LA enlargement, AF, mitral stenosis
- Considered a "prethrombotic state" - a marker that thrombus formation is imminent or likely even if no frank clot is seen
- Dense SEC in patients with rheumatic mitral stenosis and AF is a trigger for anticoagulation even in sinus rhythm (European guidelines) - Textbook of Clinical Echocardiography, p. 493; Braunwald's Heart Disease, p. 760
6c. LAA Thrombus Assessment Before Cardioversion
- Anticoagulate for ≥3 weeks before elective cardioversion, then cardiovert
- TEE-guided cardioversion: perform TEE first; if no LAA thrombus, proceed with cardioversion immediately (with anticoagulation still required for ≥4 weeks after, due to atrial stunning)
- Patients with LAA closure devices (e.g. Watchman): TEE is done pre-cardioversion to confirm device position, no device-related thrombus, and peri-device leak ≤5 mm - Harrison's Principles of Internal Medicine, p. 1077
6d. Left Atrial Size
- Measured as LA volume index (LAVI); >34 mL/m² = dilated
- Larger LA = higher chance of AF recurrence after cardioversion
- LA dimension ≥55 mm = guideline trigger for anticoagulation in mitral stenosis
- In patients with long-standing AF, the LA is often severely dilated and fibrotic ("stiff left atrial syndrome") with elevated filling pressures and heart failure - Harrison's Principles, p. 1062
6e. LV Function Assessment
- Tachycardia-induced cardiomyopathy: prolonged rapid ventricular rates in AF can cause reversible LV systolic dysfunction (reduced EF). Echo is used to diagnose this and monitor recovery after rate control
- LV EF: measured by biplane Simpson's method; typically recovers once rate is controlled
- Diastolic dysfunction: AF impairs LV filling by eliminating the atrial "kick" (normally ~20-30% of LV filling). Echo-Doppler assesses this through E-wave, E/e' ratio, and LA size
- Longitudinal strain (GLS): a more sensitive marker than EF, detects subclinical LV dysfunction
6f. AF and Mitral Stenosis (Special High-Risk Combination)
- OAC (warfarin specifically, not DOACs) is strongly recommended regardless of CHA₂DS₂-VASc score
- Even transient AF episodes (<30 sec) on ambulatory monitoring significantly increase thromboembolic risk in MS
- LA thrombus can be found even in sinus rhythm in MS - Braunwald's Heart Disease, p. 760
6g. Structural Assessment - What to Look For in AF
| Structure | What to assess |
|---|---|
| Left atrium | Size (LAVI), fibrosis markers, spontaneous contrast |
| LAA | Thrombus (TEE), emptying velocity (<20 cm/s = high stasis risk) |
| LV | EF, wall motion, diastolic function grade |
| Mitral valve | Stenosis (MVA, mean gradient), regurgitation |
| Tricuspid valve | TR jet velocity → pulmonary artery pressure |
| Pulmonary veins | Flow pattern (for pre-ablation assessment) |
6h. Role in AF Catheter Ablation
- TEE (or CT) mandatory to exclude LAA thrombus
- ICE (intracardiac echo) is used to guide transseptal puncture and catheter positioning during the procedure
7. Quick Clinical Rules to Remember
- Always get a TEE, not TTE, to rule out LAA thrombus - TTE misses the majority of LAA clots
- SEC = "pre-thrombus" - treat it like a thrombus for clinical decisions
- LA size predicts AF recurrence - document LAVI at baseline
- Tachycardia-induced CMP is reversible - repeat echo after rate control
- Atrial stunning is real - anticoagulate for ≥4 weeks post-cardioversion even if TEE was clear pre-cardioversion
- Bernoulli equation: ΔP = 4v² - the equation behind every valve gradient you calculate