
Management of Diabetes Ketoacidosis
"diabetic ketoacidosis"[MeSH Terms] AND management
diabetic ketoacidosis management algorithm flowchart
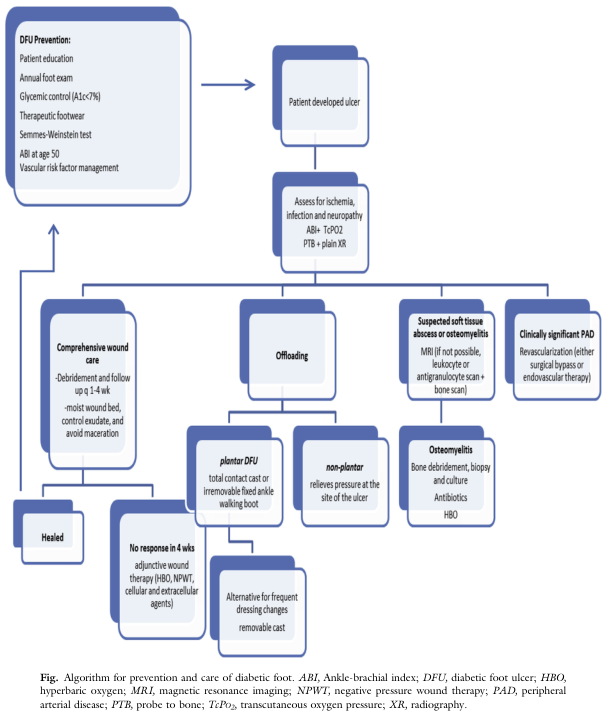
Summary : This flowchart presents a comprehensive algorithm for the prevention and care of diabetic foot, including screening, ulcer management, wound care, offloading, infection and ischemia assessment, and advanced therapies. flowchart: # Nodes : • DFU Prevention (rounded rectangle): Patient education, annual foot exam, glycemic control (A1c<7%), therapeutic footwear, Semmes-Weinstein test, ABI at age 50, vascular risk factor management. • Patient developed ulcer (rectangle). • Assess for ischemia, infection and neuropathy (rectangle): ABI + TcPO2, PTB + plain XR. • Comprehensive wound care (rectangle): Debridement and follow up q 1-4 wk, moist wound bed, control exudate, avoid maceration. • Offloading (rectangle). • Suspected soft tissue abscess or osteomyelitis (rectangle): MRI (if not possible, leukocyte or antigranulocyte scan + bone scan). • Clinically significant PAD (rectangle): Revascularization (either surgical bypass or endovascular therapy). • Healed (rectangle). • No response in 4 wks (rectangle): Adjunctive wound therapy (HBO, NPWT, cellular and extracellular agents). • plantar DFU (rectangle): Total contact cast or irremovable fixed ankle walking boot. • non-plantar (rectangle): Relieves pressure at the site of the ulcer. • Alternative for frequent dressing changes (rectangle): Removable cast. • Osteomyelitis (rectangle): Bone debridement, biopsy and culture, antibiotics, HBO. # Connectors : • Arrow from DFU Prevention to Patient developed ulcer. • Arrow from Patient developed ulcer to Assess for ischemia, infection and neuropathy. • From Assess for ischemia, infection and neuropathy, three branches: – To Comprehensive wound care. – To Offloading. – To Suspected soft tissue abscess or osteomyelitis and Clinically significant PAD. • Comprehensive wound care leads to Healed or, if no response in 4 wks, to adjunctive wound therapy. • Offloading splits into plantar DFU (total contact cast or irremovable boot) and non-plantar (relieves pressure at ulcer site), with alternative for frequent dressing changes (removable cast). • Suspected soft tissue abscess or osteomyelitis leads to Osteomyelitis (bone debridement, biopsy, antibiotics, HBO). • Clinically significant PAD leads to revascularization. • All branches ultimately aim for healing. # Layout : • Top-down flow, starting with prevention, then ulcer development, assessment, and branching into wound care, offloading, infection/ischemia management. • Multiple parallel branches for different clinical scenarios. • Merges at points where healing is achieved or advanced therapies are considered. # Analysis : • The flowchart emphasizes early prevention and regular screening to reduce diabetic foot ulcer (DFU) risk. • Once an ulcer develops, a systematic assessment for ischemia, infection, and neuropathy guides further management. • Wound care and offloading are central, with specific strategies for plantar and non-plantar ulcers. • Advanced imaging and therapies are reserved for cases with suspected infection or poor response to standard care. • The algorithm integrates vascular assessment and revascularization for patients with peripheral arterial disease (PAD). • The workflow is designed to optimize healing and minimize complications through stepwise escalation of care.
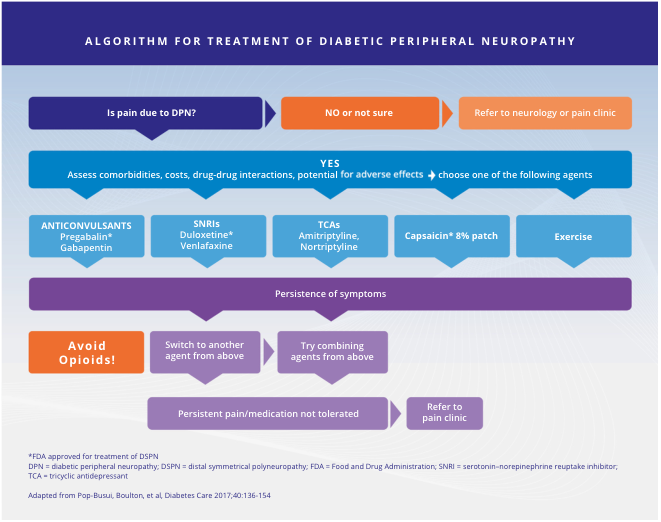
Summary : This flowchart presents an algorithm for the treatment of diabetic peripheral neuropathy (DPN), guiding clinicians through decision-making steps for pain management, agent selection, and escalation of care based on symptom persistence and medication tolerance. flowchart: # Nodes : • "Is pain due to DPN?" (hexagon) • "NO or not sure" (rectangle) • "Refer to neurology or pain clinic" (rectangle) • "YES" (rectangle) • "Assess comorbidities, costs, drug-drug interactions, potential for adverse effects ➔ choose one of the following agents" (rectangle) • "ANTICONVULSANTS Pregabalin* Gabapentin" (rectangle) • "SNRIs Duloxetine* Venlafaxine" (rectangle) • "TCAs Amitriptyline, Nortriptyline" (rectangle) • "Capsaicin* 8% patch" (rectangle) • "Exercise" (rectangle) • "Persistence of symptoms" (rectangle) • "Avoid Opioids!" (rectangle, orange) • "Switch to another agent from above" (rectangle) • "Try combining agents from above" (rectangle) • "Persistent pain/medication not tolerated" (rectangle) • "Refer to pain clinic" (rectangle) # Connectors : • Arrow from "Is pain due to DPN?" to "NO or not sure" and "YES". • Arrow from "NO or not sure" to "Refer to neurology or pain clinic". • Arrow from "YES" to "Assess comorbidities..." and then to five agent options: "ANTICONVULSANTS", "SNRIs", "TCAs", "Capsaicin* 8% patch", "Exercise". • Arrows from all five agent options to "Persistence of symptoms". • Arrow from "Persistence of symptoms" to "Avoid Opioids!", "Switch to another agent from above", and "Try combining agents from above". • Arrow from "Switch to another agent from above" and "Try combining agents from above" to "Persistent pain/medication not tolerated". • Arrow from "Persistent pain/medication not tolerated" to "Refer to pain clinic". # Layout : • Top-down, stepwise progression. • Initial decision node at top, branching to referral or treatment assessment. • Five parallel agent options in the middle. • Symptom persistence leads to further branching for agent switching, combination, or referral. • Orange highlight for "Avoid Opioids!" as a warning. # Additional Information : • Footnotes: *FDA approved for treatment of DSPN. • Abbreviations: DPN = diabetic peripheral neuropathy; DSPN = distal symmetrical polyneuropathy; FDA = Food and Drug Administration; SNRI = serotonin-norepinephrine reuptake inhibitor; TCA = tricyclic antidepressant. • Source: Adapted from Pop-Busui, Boulton, et al, Diabetes Care 2017;40:136-154. # Analysis : • The algorithm prioritizes non-opioid agents for pain management in DPN, with anticonvulsants, SNRIs, TCAs, topical capsaicin, and exercise as first-line options. • If symptoms persist, clinicians are advised to avoid opioids, switch agents, or combine therapies. • Persistent pain or intolerance to medication prompts referral to a pain clinic. • The flowchart emphasizes assessment of comorbidities and adverse effects before agent selection, and provides clear escalation steps for refractory cases.
Summary : This flowchart provides a comprehensive management algorithm for adults with atopic dermatitis, detailing baseline management, topical therapies, phototherapy, and systemic therapies, including FDA-approved and recommended treatments, maintenance strategies, and escalation steps for inadequate control. flowchart: # Baseline Management : • Severity Assessment: Assessment of signs of disease, severity of symptoms, comorbidities, and impact on quality of life (QOL). • Exacerbating Factor Avoidance: Identify trigger factors (allergens, irritants, etc.) and counsel patients on avoidance. • Baseline Therapy: Moisturizers/Emollients (strong recommendation), Bathing Practices (conditional recommendation). # Initial Pathways : • Mild to Severe: Proceed to Topical Therapies. • Moderate to Severe: Proceed to Phototherapy & Systemic Therapy. # Topical Therapies : ## Optimized Topical Therapy for Inflamed Areas : • TCS (Topical corticosteroids) (FDA, strong recommendation) • TCIs (Topical calcineurin inhibitors) (FDA, strong recommendation) • Crisaborole ointment (FDA, strong recommendation) • Ruxolitinib cream (FDA, strong recommendation) • Wet Dressings (strong recommendation) ## Ongoing Maintenance with Topical Therapies : • Reactive or proactive application for maintenance. • Shared decision-making for long-term treatment. • Consider patient satisfaction and adherence. ## Inadequate Control : • If topical therapy and basic management optimized, consider alternative diagnoses. • Consider additional treatment with phototherapy and/or systemic agents. # Phototherapy & Systemic Therapy : • Topical agents can be used concurrently with phototherapy or systemic agents for maintenance, rescue, or flares. # Phototherapy : • No specific agents listed; included as a treatment option for moderate to severe cases. # Systemic Therapies : ## Biologics : • Dupilumab (FDA, strong recommendation) • Tralokinumab (FDA, strong recommendation) ## JAK Inhibitors : • Upadacitinib (FDA, strong recommendation) • Abrocitinib (FDA, strong recommendation) • Baricitinib (strong recommendation) ## Immunosuppressants : • Methotrexate (strong recommendation) • Azathioprine (strong recommendation) • Cyclosporine (strong recommendation) • Mycophenolate mofetil (strong recommendation) • Systemic corticosteroids (FDA, strong recommendation against use) # Key : • Green circle: Strong recommendation in favor. • Yellow circle: Conditional recommendation in favor. • Red circle: Strong recommendation against. • Orange circle: Conditional recommendation against. • FDA: Indicated for atopic dermatitis. # Abbreviations : • QOL: Quality of Life • FDA: Food and Drug Administration • TCS: Topical corticosteroids • TCI: Topical calcineurin inhibitor # Layout : • The flowchart is organized from baseline management at the top, splitting into two main pathways (mild to severe and moderate to severe), with further branches into topical, phototherapy, and systemic therapies. • Maintenance and escalation steps are included for ongoing management and inadequate control. # Analysis : • The algorithm emphasizes starting with baseline management and topical therapies, escalating to phototherapy and systemic therapies for more severe or refractory cases. • Strong recommendations are visually highlighted for first-line agents, with systemic corticosteroids strongly discouraged. • FDA-approved options are clearly marked, supporting evidence-based decision-making. • The flowchart supports a stepwise, patient-centered approach, integrating maintenance and escalation strategies.
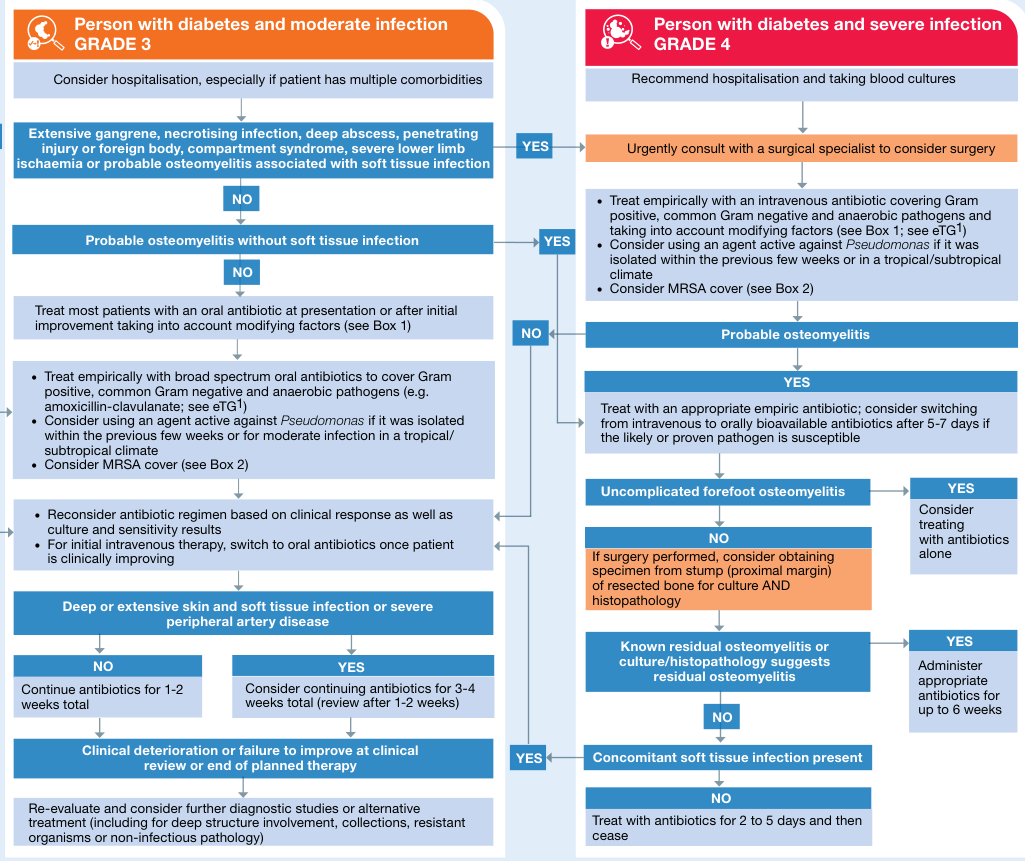
Summary : This flowchart provides a clinical decision-making pathway for the management of diabetic patients with moderate (Grade 3) and severe (Grade 4) infections, focusing on hospitalisation, antibiotic therapy, surgical consultation, and osteomyelitis treatment. flowchart: # Grade 3: Person with diabetes and moderate infection Nodes : • Start (rectangle): "Person with diabetes and moderate infection GRADE 3" • Decision (rectangle): "Consider hospitalisation, especially if patient has multiple comorbidities" • Decision (rectangle): "Extensive gangrene, necrotising infection, deep abscess, penetrating injury or foreign body, compartment syndrome, severe lower limb ischaemia or probable osteomyelitis associated with soft tissue infection" • Decision (rectangle): "Probable osteomyelitis without soft tissue infection" • Process (rectangle): "Treat most patients with an oral antibiotic at presentation or after initial improvement taking into account modifying factors (see Box 1)" • Process (rectangle): "Treat empirically with broad spectrum oral antibiotics to cover Gram positive, common Gram negative and anaerobic pathogens (e.g. amoxicillin-clavulanate; see eTG1)" • Process (rectangle): "Consider using an agent active against Pseudomonas if it was isolated within the previous few weeks or for moderate infection in a tropical/subtropical climate" • Process (rectangle): "Consider MRSA cover (see Box 2)" • Process (rectangle): "Reconsider antibiotic regimen based on clinical response as well as culture and sensitivity results" • Process (rectangle): "For initial intravenous therapy, switch to oral antibiotics once patient is clinically improving" • Decision (rectangle): "Deep or extensive skin and soft tissue infection or severe peripheral artery disease" • Process (rectangle): "Continue antibiotics for 1-2 weeks total" • Process (rectangle): "Consider continuing antibiotics for 3-4 weeks total (review after 1-2 weeks)" • Decision (rectangle): "Clinical deterioration or failure to improve at clinical review or end of planned therapy" • Process (rectangle): "Re-evaluate and consider further diagnostic studies or alternative treatment (including for deep structure involvement, collections, resistant organisms or non-infectious pathology)" # Grade 4: Person with diabetes and severe infection Nodes : • Start (rectangle): "Person with diabetes and severe infection GRADE 4" • Process (rectangle): "Recommend hospitalisation and taking blood cultures" • Decision (rectangle): "Urgently consult with a surgical specialist to consider surgery" • Process (rectangle): "Treat empirically with an intravenous antibiotic covering Gram positive, common Gram negative and anaerobic pathogens and taking into account modifying factors (see Box 1; see eTG1)" • Process (rectangle): "Consider using an agent active against Pseudomonas if it was isolated within the previous few weeks or in a tropical/subtropical climate" • Process (rectangle): "Consider MRSA cover (see Box 2)" • Decision (rectangle): "Probable osteomyelitis" • Process (rectangle): "Treat with an appropriate empiric antibiotic; consider switching from intravenous to orally bioavailable antibiotics after 5-7 days if the likely or proven pathogen is susceptible" • Decision (rectangle): "Uncomplicated forefoot osteomyelitis" • Process (rectangle): "Consider treating with antibiotics alone" • Decision (rectangle): "If surgery performed, consider obtaining specimen from stump (proximal margin) of resected bone for culture AND histopathology" • Decision (rectangle): "Known residual osteomyelitis or culture/histopathology suggests residual osteomyelitis" • Process (rectangle): "Administer appropriate antibiotics for up to 6 weeks" • Decision (rectangle): "Concomitant soft tissue infection present" • Process (rectangle): "Treat with antibiotics for 2 to 5 days and then cease" Connectors : • Arrows indicate decision points (YES/NO) and direct flow to subsequent steps. • YES/NO branches are clearly marked at each decision node. • Some nodes loop back to earlier steps if clinical deterioration or failure to improve occurs. Layout : • Two parallel columns: left for Grade 3 (moderate infection), right for Grade 4 (severe infection). • Each column starts with initial assessment, then branches based on clinical findings and response to therapy. • Decision nodes and process steps are arranged vertically, with arrows connecting them according to clinical logic. Analysis : • The flowchart provides a structured approach for clinicians to manage diabetic infections, distinguishing between moderate and severe cases. • Emphasises early hospitalisation and surgical consultation for severe infections. • Antibiotic therapy is tailored based on infection severity, pathogen risk, and clinical response. • Osteomyelitis management includes both medical and surgical options, with clear criteria for duration and type of antibiotic therapy. • The chart highlights the importance of re-evaluation and diagnostic flexibility in cases of poor clinical response.
DKA diabetic ketoacidosis pathophysiology insulin deficiency ketone body
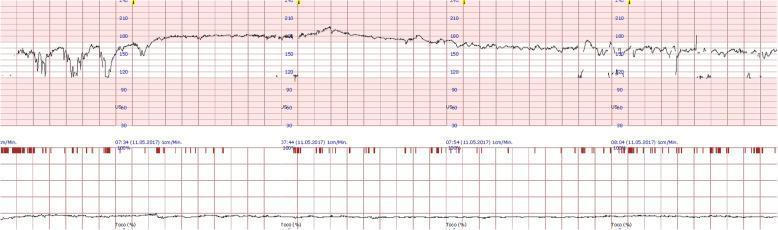
This diagnostic image shows a continuous fetal cardiotocography (CTG) tracing at 27 weeks of gestation, illustrating the impact and subsequent resolution of maternal diabetic ketoacidosis (DKA) on fetal well-being. The top panel displays the fetal heart rate (FHR) in beats per minute (bpm), while the bottom panel shows tocodynamometry (maternal uterine activity). The initial 30-minute segment (left side) demonstrates pathological features: a baseline tachycardia exceeding 160 bpm, significantly reduced baseline variability (flattened tracing), and repetitive variable decelerations characterized by sharp, transient drops in FHR. These findings are clinically significant as they reflect fetal stress or hypoxia secondary to maternal metabolic derangement. Following medical intervention (saline and insulin), the latter half of the tracing shows a clear normalization: the FHR baseline stabilizes around 150-160 bpm, normal beat-to-beat variability reappears, and decelerations resolve. This timeline-based progression serves as an educational example of how maternal acute illness affects fetal heart rate patterns and the rapid response to appropriate clinical stabilization.
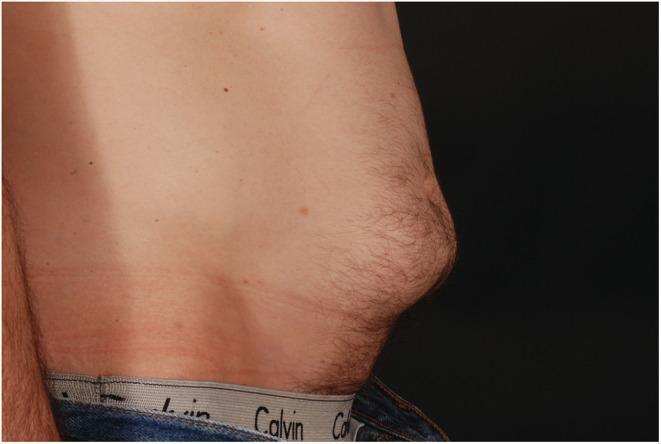
Clinical photograph providing a lateral view of a male torso in an upright position, demonstrating severe insulin-induced lipohypertrophy. The image captures a prominent, circumscribed protrusion of subcutaneous adipose tissue in the lower lateral abdomen. This localized bulge disrupts the natural contour of the abdominal wall, presenting as a firm, raised mass several centimeters in diameter. The overlying skin appears intact and smooth, though it exhibits terminal hair growth consistent with the patient's demographics. Minor skin findings include scattered nevi and faint horizontal skin creases from posture. This visual serves as a classic clinical example of a common complication in patients with long-standing type 1 diabetes who repeatedly inject insulin into the same site. The educational focus is on the physical manifestation of lipohypertrophy, which can impair insulin absorption and lead to poor glycemic control, as seen in clinical scenarios like diabetic ketoacidosis (DKA).
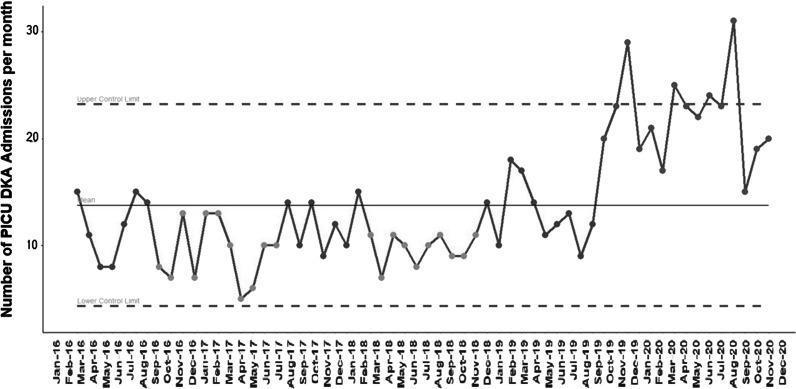
This medical timeline chart is a Statistical Process Control (SPC) chart, specifically a longitudinal line graph illustrating the monthly frequency of Pediatric Intensive Care Unit (PICU) admissions for Diabetic Ketoacidosis (DKA) from January 2016 to December 2020. The chart features three horizontal reference lines: a solid central line representing the mean, and two dashed lines representing the Upper Control Limit (UCL) and Lower Control Limit (LCL). From early 2016 through mid-2019, the data exhibits common-cause variation, with admission numbers remaining stable and generally fluctuating below the mean, rarely approaching the LCL (approximately 5 admissions). A significant shift toward special-cause variation begins in late 2019. Starting around November 2019 and continuing through 2020, there is a sustained increase in both volume and volatility. Multiple data points in 2020 (notably around March, July, and August) exceed the UCL, peaking at over 30 admissions per month. This visual evidence demonstrates a statistically significant upward trend in severe DKA cases requiring intensive care, potentially correlating with healthcare delivery changes or delayed presentations during the COVID-19 pandemic.
Management of Diabetic Ketoacidosis (DKA)
Diagnostic Criteria
| Severity | Glucose (mg/dL) | Arterial pH | Bicarbonate (mmol/L) | Ketones | Mental Status |
|---|---|---|---|---|---|
| Mild | >250 | 7.25-7.30 | 15-18 | Positive | Alert |
| Moderate | >250 | 7.24-7.0 | 10-15 | Positive | Alert/Drowsy |
| Severe | >250 | <7.0 | <10 | Positive | Stupor/Coma |
Treatment Algorithm
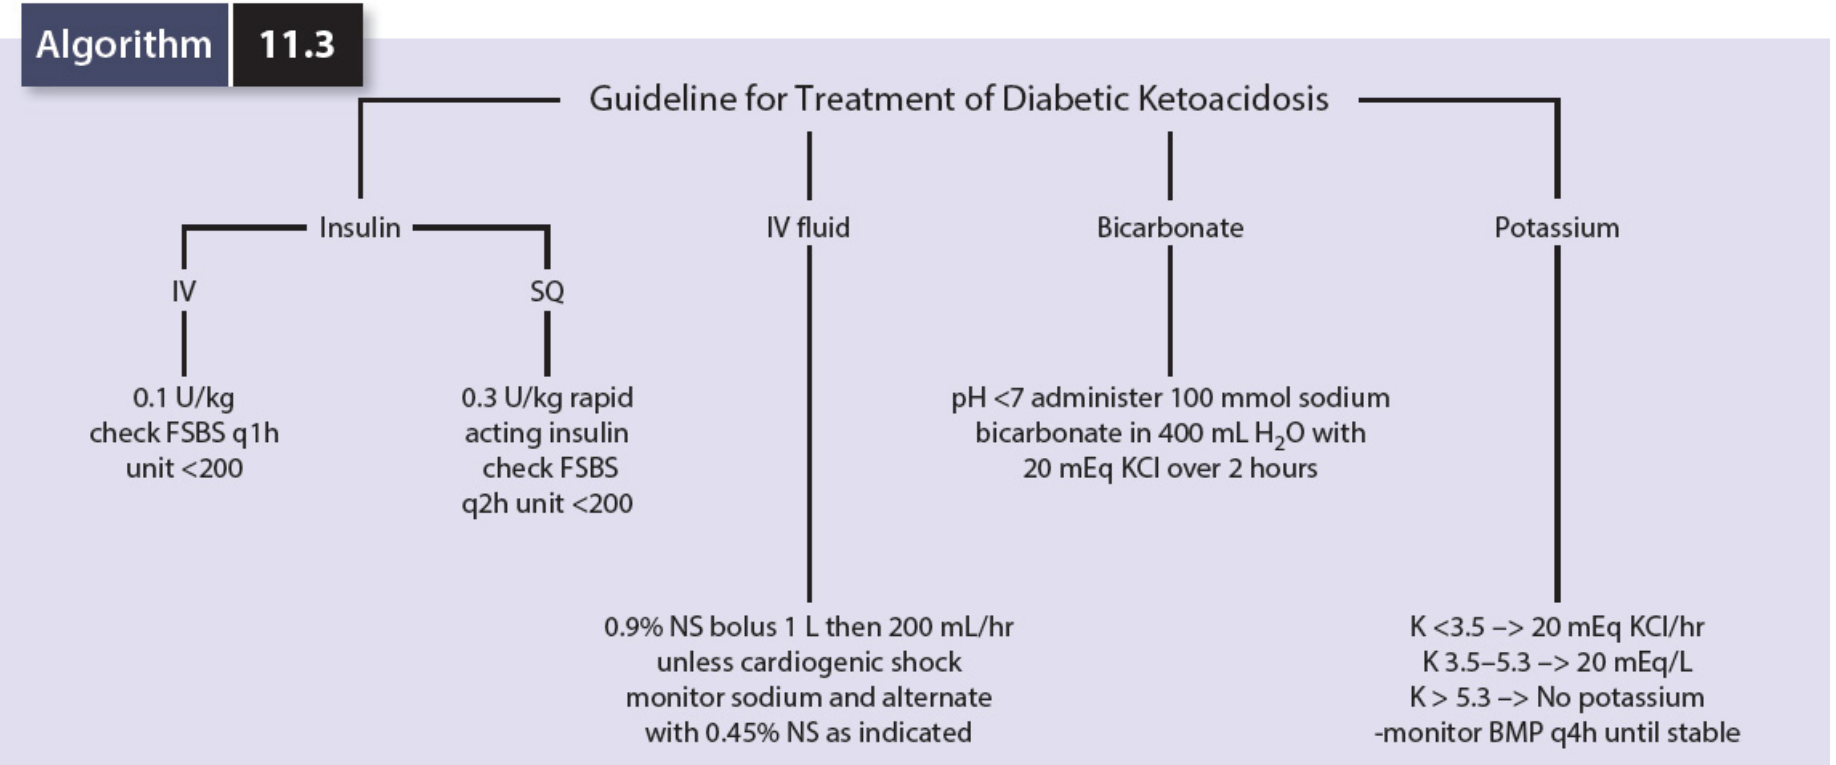
The Four Pillars of DKA Management
1. Fluid Resuscitation
- 0.9% Normal Saline (NS): 1-2 L IV over 1-3 hours (adults)
- Children: 20 mL/kg NS in the first hour
- If hemodynamically unstable, prioritize volume resuscitation urgently
- Continue at 15-20 mL/kg/h after the first hour
- Switch to 0.45% NS or Ringer's lactate for gradual correction of remaining deficits
- Monitor sodium closely - alternate between 0.9% and 0.45% NS as indicated
- Add dextrose 5-10% to IV fluids to allow continued insulin infusion without hypoglycemia
Fluid and electrolyte deficits per kg body weight in severe DKA: Water 70-120 mL/kg, Sodium 8-10 mEq/L, Potassium 5-7 mEq/L - Rosen's Emergency Medicine, 9e
2. Insulin Therapy
- Subcutaneous rapid-acting insulin: 0.3 U/kg, then check blood glucose every 2 hours; target glucose <200 mg/dL
- IV regular insulin infusion: 0.1 U/kg/h (continuous)
- If blood glucose does not fall by ≥10% in the first hour, give a bolus of 0.1 U/kg IV, then resume infusion
- Alternative: 0.1 U/kg IV bolus followed by 0.1 U/kg/h infusion
- Once glucose falls to 250 mg/dL, reduce infusion to 0.05 U/kg/h and add dextrose to IV fluids
- Continue insulin until ketones fall to <1.0 mmol/L (not just until glucose normalizes - ketoacidosis must resolve)
- Allow a 1-2 hour overlap between the first SC dose and stopping the IV infusion to prevent rebound ketosis
- Resume the patient's usual diabetes regimen
Goldman-Cecil Medicine, 2e recommends continuing background long-acting SC insulin throughout if the patient was already on it.
3. Electrolyte Replacement
Potassium (most critical electrolyte)
| Serum K+ | Action |
|---|---|
| <3.3 mEq/L | Hold insulin; give 20-40 mEq KCl/hour IV until K+ ≥3.3 |
| 3.3-5.3 mEq/L | Start insulin; add 20-40 mEq KCl per liter of IV fluid |
| >5.3 mEq/L | Hold potassium; monitor BMP every 4 hours; do not give insulin until K+ confirmed <5.5 |
- ECG monitoring recommended when KCl infusion rate exceeds 10 mEq/h
- As acidosis corrects and insulin is given, K+ shifts intracellularly - expect serum K+ to fall
Phosphate
- Routine phosphate replacement is not generally recommended
- Replace only if severe hypophosphatemia develops (<1.0 mg/dL) causing muscle weakness or impaired ventilation
- Potassium phosphate can be used when both K+ and phosphate deficits coexist
Magnesium
- Check levels; correct with 1-2 g MgSO4 if deficient (serum levels may not reflect total body stores)
Sodium
- Measured serum Na+ is often falsely low due to osmotic water shift from hyperglycemia
- Correct with NS or 0.45% NS as part of fluid therapy
4. Bicarbonate Therapy
- pH <7.0 even without hemodynamic instability, OR
- pH <6.9 with hemodynamic instability
- Patient is not responding to IV fluids and insulin and remains profoundly acidotic
Monitoring (Meticulous Flow Sheets Required)
| Parameter | Frequency |
|---|---|
| Blood glucose | Every 1 hour (IV insulin) or every 2 hours (SC insulin) |
| Serum K+, Na+, HCO3-, Cl-, BUN/Cr | Every 2-4 hours initially |
| Arterial/venous pH | Every 2-4 hours in severe cases |
| Urine output | Continuous |
| Vital signs | Continuous |
| ECG | If K+ abnormal or rapid replacement |
Identify and Treat the Precipitating Cause
- Infection (most common - UTI, pneumonia, sepsis) - elevated WBC reflects metabolic acidosis, not necessarily infection; band neutrophilia is more specific
- Inadequate insulin - omission, pump failure
- New-onset Type 1 DM (~25% of DKA episodes)
- Myocardial infarction
- Medications: SGLT2 inhibitors (euglycemic DKA), corticosteroids, antipsychotics
- Acute pancreatitis (use lipase, not amylase, for diagnosis - amylase is falsely elevated in DKA)
Criteria for Resolution of DKA
- Blood glucose <200 mg/dL
- Serum bicarbonate ≥15 mEq/L
- Venous pH >7.3
- Beta-hydroxybutyrate <1.0 mmol/L (or negative urine ketones)
Special Situations
Euglycemic DKA (SGLT2 inhibitor-associated)
- Blood glucose may be near-normal despite active ketoacidosis
- SGLT2 inhibitor effects persist 10-14 days after stopping the drug
- High risk of DKA relapse postoperatively if nutritional intake is interrupted
- Key: treat the ketoacidosis, not the glucose
Pediatric DKA
- Highest risk of cerebral edema (most feared complication)
- Avoid overly rapid fluid administration
- Rate of fluid correction should not exceed 10 mL/kg/h after initial bolus
- Watch for headache, altered mental status, and bradycardia during treatment
DKA in Pregnancy
- Fetal distress (tachycardia, decelerations) can occur secondary to maternal metabolic derangement
- Fetal heart rate patterns normalize with adequate maternal treatment
- A 2025 systematic review found adverse pregnancy outcomes are common, reinforcing the need for prompt management
Complications of DKA Treatment
| Complication | Cause | Prevention |
|---|---|---|
| Hypokalemia | Insulin + acidosis correction | Aggressive K+ replacement before/during insulin |
| Hypoglycemia | Insulin without dextrose | Add D5W when glucose ≤250 mg/dL |
| Cerebral edema | Rapid osmolar shifts | Gradual fluid/glucose correction (especially in children) |
| Hypophosphatemia | Insulin, acidosis correction | Monitor; replace if severe |
| Venous thrombosis | Dehydration, hyperviscosity | Hydration; consider prophylaxis |
| ARDS | Aspiration, fluid overload | Monitor fluid balance |
| GI bleeding | Stress ulceration | Consider gastric protection |
Recent Evidence (2024-2026)
- Subcutaneous vs. IV insulin: A 2024 meta-analysis (PMID 39090718) confirms subcutaneous insulin is a safe and effective alternative to IV infusion for uncomplicated/mild-moderate DKA.
- Early basal insulin: A 2026 meta-analysis (PMID 41208563) supports adding early subcutaneous basal insulin alongside IV infusion to reduce rebound hyperglycemia and transition time.
Summary Checklist (Rosen's Emergency Medicine)
- Confirm diagnosis with glucose, electrolytes, ketones, ABG, CBC
- Rehydrate - NS 1-2 L over 1-3 h (adults)
- Correct K+ - do not give insulin if K+ <3.3 mEq/L
- Start insulin - 0.1 U/kg/h IV regular insulin
- Add dextrose when glucose ≤300 mg/dL
- Search for and treat the precipitant
- Monitor - meticulous flow sheets of vitals, glucose, electrolytes, urine output
- Admit - ICU for severe DKA, floor for mild-moderate if stable
Difference between DKA and HHNS
DKA vs HHS hyperosmolar hyperglycemic state comparison table
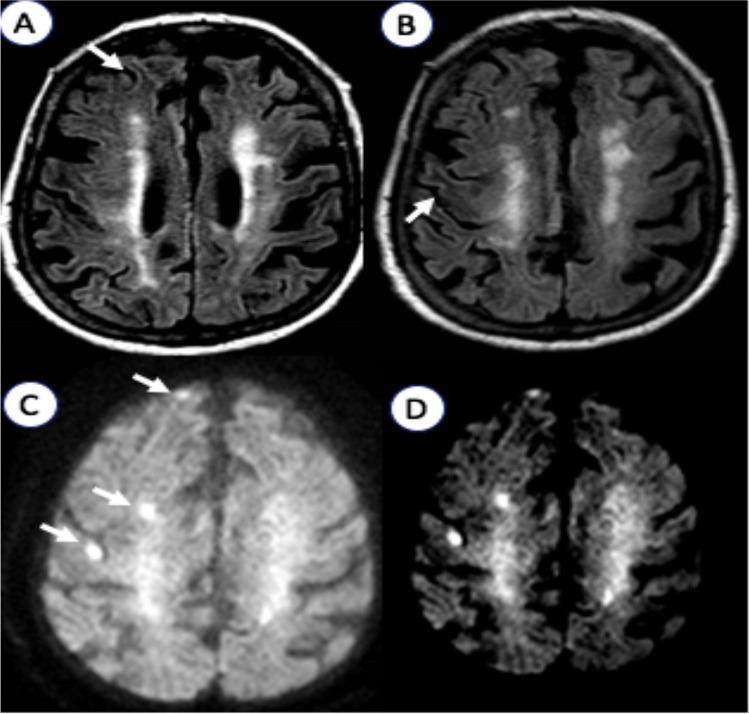
This diagnostic imaging panel presents axial brain MRI sequences from a patient with nonketotic hyperglycemic hyperosmolar state (NKHHS). Panels A and B are T2-FLAIR sequences showing multifocal, subcortical hypointensities predominantly in the right hemisphere's white matter. These areas (marked with arrows) demonstrate decreased signal intensity compared to adjacent brain parenchyma. Panel C illustrates Diffusion-Weighted Imaging (DWI), revealing disseminated hyperintense cortical lesions in the right frontal region. Panel D shows the corresponding Apparent Diffusion Coefficient (ADC) map, where these same regions exhibit signal loss (restricted diffusion). The combination of high DWI signal and low ADC signal indicates cytotoxic edema. These findings are characteristic of hyperglycemia-induced brain injury, where metabolic derangement and hyperosmolarity lead to transient neurological deficits and specific neuroimaging patterns, often localized to the subcortical white matter and overlying cortex.
TABLE 13. Hyperosmolar Therapy: Summary of Evidence <table><thead><tr><th>Reference Type of Trauma Center Geographic Location</th><th>Study Design n Age (yr) Outcomes</th><th>Data Class</th><th>Results</th></tr></thead><tbody><tr><td colspan="4">Class 2 studies</td></tr><tr><td colspan="4">Bolus hypertonic saline to control ICP: recommendation II.1.</td></tr><tr><td>Shein et al (2)ᵃ Children's Hospital University of Pittsburgh Pittsburgh, PA</td><td>Prospective n = 16 in analysis Age: mean, 44 mo; range, 34–124 mo ICP and CPP</td><td>Class 2 Differences in patients by treatment, limited control for confounding</td><td>Hypertonic saline vs other drugs for intracranial hypertension Decrease in ICP; increase in CPP Associated with a two-fold faster resolution of intracranial hypertension than either fentanyl or pentobarbital Adjusted hazard ratio, 2.171 (95% CI, 1.062–4.439) Hypertonic saline may be first-line treatment given favorable hemodynamics and resolution of intracranial hypertension. Comparison drugs: beneficial effects on ICP only Fentanyl: ICP decreased; CPP decreased. Highest rate of treatment failure rate Pentobarbital: ICP decreased; CPP no significant change Note: Mannitol not included due to limited use (seven doses out of 362 total; four out 196 analyzed)</td></tr><tr><td>Fisher et al (95) San Diego Children's Hospital San Diego, CA</td><td>RCT n = 18 Age: mean, 8.3; range, 0.6–14.5 ICP</td><td>Class 2 Randomization and allocation concealment methods not reported; crossover study lacking reporting on first-period comparison of baseline characteristics; small sample size</td><td>3% saline vs 0.9% During the 2-hr trial, hypertonic saline was associated with a lower ICP and reduced need for additional interventions (thiopental and hyperventilation) to control ICP. Serum sodium concentration increased ≈7 mEq/L after 3% saline.</td></tr></tbody></table>
Table 1 Continued. <table><thead><tr><th>Hyperglycemia</th><th>French Endocrine Society 2019 (17)</th><th>Hypoparathyroidism</th></tr></thead><tbody><tr><td></td><td>HbA1c GADA, IA2A, ZnT8A Lipase</td><td>n/a</td></tr><tr><td></td><td>IDSC 2018 (18)</td><td></td></tr><tr><td></td><td>Autoantibodies (GADA, IA, islet-cell ZnT8A) Insulin and c peptide</td><td>n/a</td></tr><tr><td></td><td>British Society for Endocrinology 2018 (acute setting) (19)</td><td></td></tr><tr><td></td><td>Monitor and manage for diabetic ketoacidosis or hyperglycemic hyperosmolar state Pancreatic antibodies (e.g. GADA) C-peptide</td><td>n/a</td></tr><tr><td></td><td>ASCO 2018 (10)</td><td></td></tr><tr><td></td><td>If type 1 diabetes suspected: pH, urine ketones, GADA, IA2A, IAA Insulin and c-peptide levels can assist</td><td>n/a</td></tr><tr><td></td><td>SITC 2017 (78)</td><td></td></tr><tr><td></td><td>Blood or urine ketones Tests for antibodies (GADA, IAA, anti-islet cell, ZnT8A) Insulin and c peptide</td><td>n/a</td></tr></tbody></table>
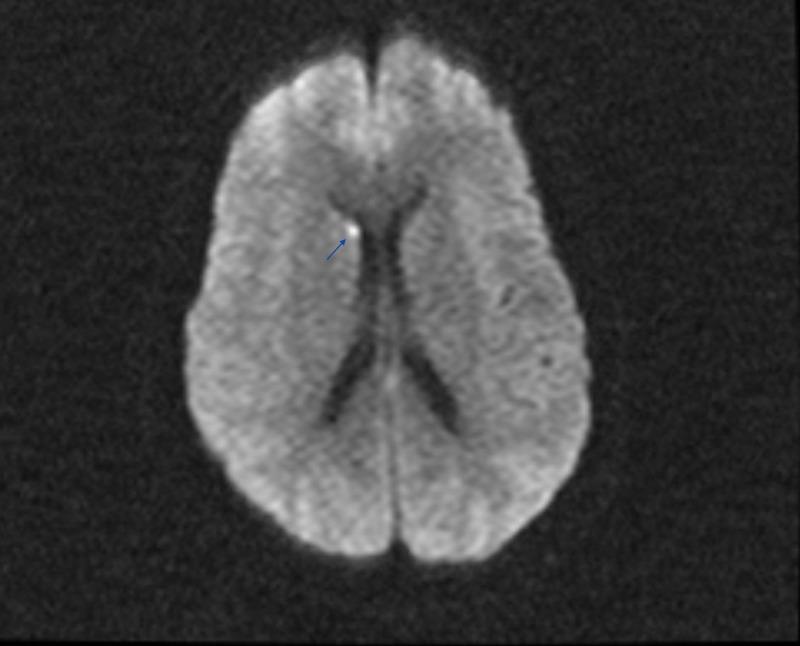
This diagnostic image is an axial slice of a brain MRI, specifically utilizing Diffusion-Weighted Imaging (DWI) or a similar high-contrast sequence to identify acute pathology. The image displays the cerebral hemispheres with visible sulci and gyri and centrally located, hypointense (dark) lateral ventricles. A focal, hyperintense (bright) signal abnormality is identified in the right hemisphere, specifically localized to the head of the caudate nucleus adjacent to the frontal horn of the lateral ventricle. This lesion is highlighted by a blue arrow and is clinically consistent with an acute lacunar infarct. The image is used to demonstrate the localization of small vessel ischemic strokes in patients presenting with encephalopathy or focal neurological deficits, particularly in the context of metabolic derangements like Hyperosmolar Hyperglycemic Syndrome (HHS).
DKA vs HHNS (HHS) - A Comprehensive Comparison
HHNS = Hyperosmolar Hyperglycemic Non-ketotic State, also called HHS (Hyperosmolar Hyperglycemic State). Both terms are used interchangeably in current literature.
1. Core Pathophysiologic Difference
| DKA | HHS | |
|---|---|---|
| Insulin status | Absolute deficiency | Relative deficiency (enough insulin to suppress ketogenesis, not enough to control glucose) |
| Why no ketosis in HHS | N/A | Higher portal vein insulin concentrations suppress hepatic lipolysis and ketone production |
| Net result | Anion-gap metabolic acidosis + hyperglycemia | Extreme hyperglycemia + hyperosmolarity, without significant acidosis |
"Because people with hyperosmolar hyperglycemic state have higher portal vein insulin concentrations than patients with diabetic ketoacidosis, the production of ketones by the liver is quantitatively less, thereby causing only mild acidosis." - Goldman-Cecil Medicine, 2e
2. Side-by-Side Diagnostic Comparison
| Feature | DKA | HHS |
|---|---|---|
| Typical diabetes type | Type 1 (also type 2) | Type 2 |
| Typical age group | All ages (toddler to geriatric) | Elderly (geriatric predominance) |
| Blood glucose | >250 mg/dL (may be lower in euglycemic DKA) | >600 mg/dL (often >1000 mg/dL) |
| Arterial pH | <7.30 (mild) to <7.0 (severe) | >7.30 (rarely drops below 7.30) |
| Serum bicarbonate | <18 mEq/L (mild) to <10 (severe) | >18 mEq/L |
| Serum ketones | Strongly positive | Absent or trace |
| Beta-hydroxybutyrate | >3.0 mmol/L | Absent or mildly elevated |
| Anion gap | Elevated (>10-12 mEq/L) | Normal or slightly elevated |
| Serum osmolality | Mildly-moderately elevated | >320 mOsm/kg (severely elevated) |
| Fluid deficit | 4-10 L | 5-10 L or more (often greater than DKA) |
| Mental status | Alert to stupor/coma | More profound neurological impairment (correlates with degree of hyperosmolarity) |
| Kussmaul breathing | Present (respiratory compensation) | Absent (no acidosis to compensate) |
| Onset speed | Rapid - hours to days | Slower - days to weeks |
| Mortality | 1-5% | 8-25% (historically up to 40-70%) |
3. Clinical Features
DKA Presentation
- Nausea, vomiting, abdominal pain (mimics acute abdomen)
- Kussmaul breathing (deep, rapid respirations)
- Fruity/acetone odor on breath
- Signs of dehydration (tachycardia, orthostatic hypotension)
- Altered mental status in severe cases
HHS Presentation
- Profound neurological dysfunction: reduced Glasgow Coma Score, aphasia, focal motor/sensory deficits, seizures, frank coma
- Severe dehydration
- No Kussmaul breathing (pH is near-normal)
- No acetone breath
- Neurological deficits often correlate directly with degree of hyperosmolarity
"The most notable findings in both DKA and hyperosmolar hyperglycemic state are usually a variety of often reversible neurologic abnormalities." - Goldman-Cecil Medicine, 2e
4. Common Precipitants
| DKA | HHS |
|---|---|
| Insulin omission/non-compliance | Infection (most common) |
| Infection (UTI, pneumonia, sepsis) | Dehydration (inability to drink) |
| Myocardial infarction | Ischemic events (MI, stroke) |
| New-onset Type 1 DM (~25%) | Medications (diuretics, steroids, antipsychotics) |
| SGLT2 inhibitor use (euglycemic DKA) | New-onset Type 2 DM |
| Stress (trauma, surgery) | Renal impairment (reduces glucose clearance) |
5. Osmolality - The Key Marker of HHS
Effective Osmolality = 2[Na⁺] + Glucose/18 (BUN excluded as it is osmotically inactive across cell membranes)
- Normal: 275-295 mOsm/kg
- Values >300 mOsm/kg = significant hyperosmolality
- Values >320 mOsm/kg = commonly associated with altered cognition (HHS range)
- Rate of osmolality correction should not exceed 3.0 mOsm/kg/h (risk of cerebral edema)
6. Mixed DKA-HHS Picture
7. Management: Key Differences
Treatment Algorithm for HHS
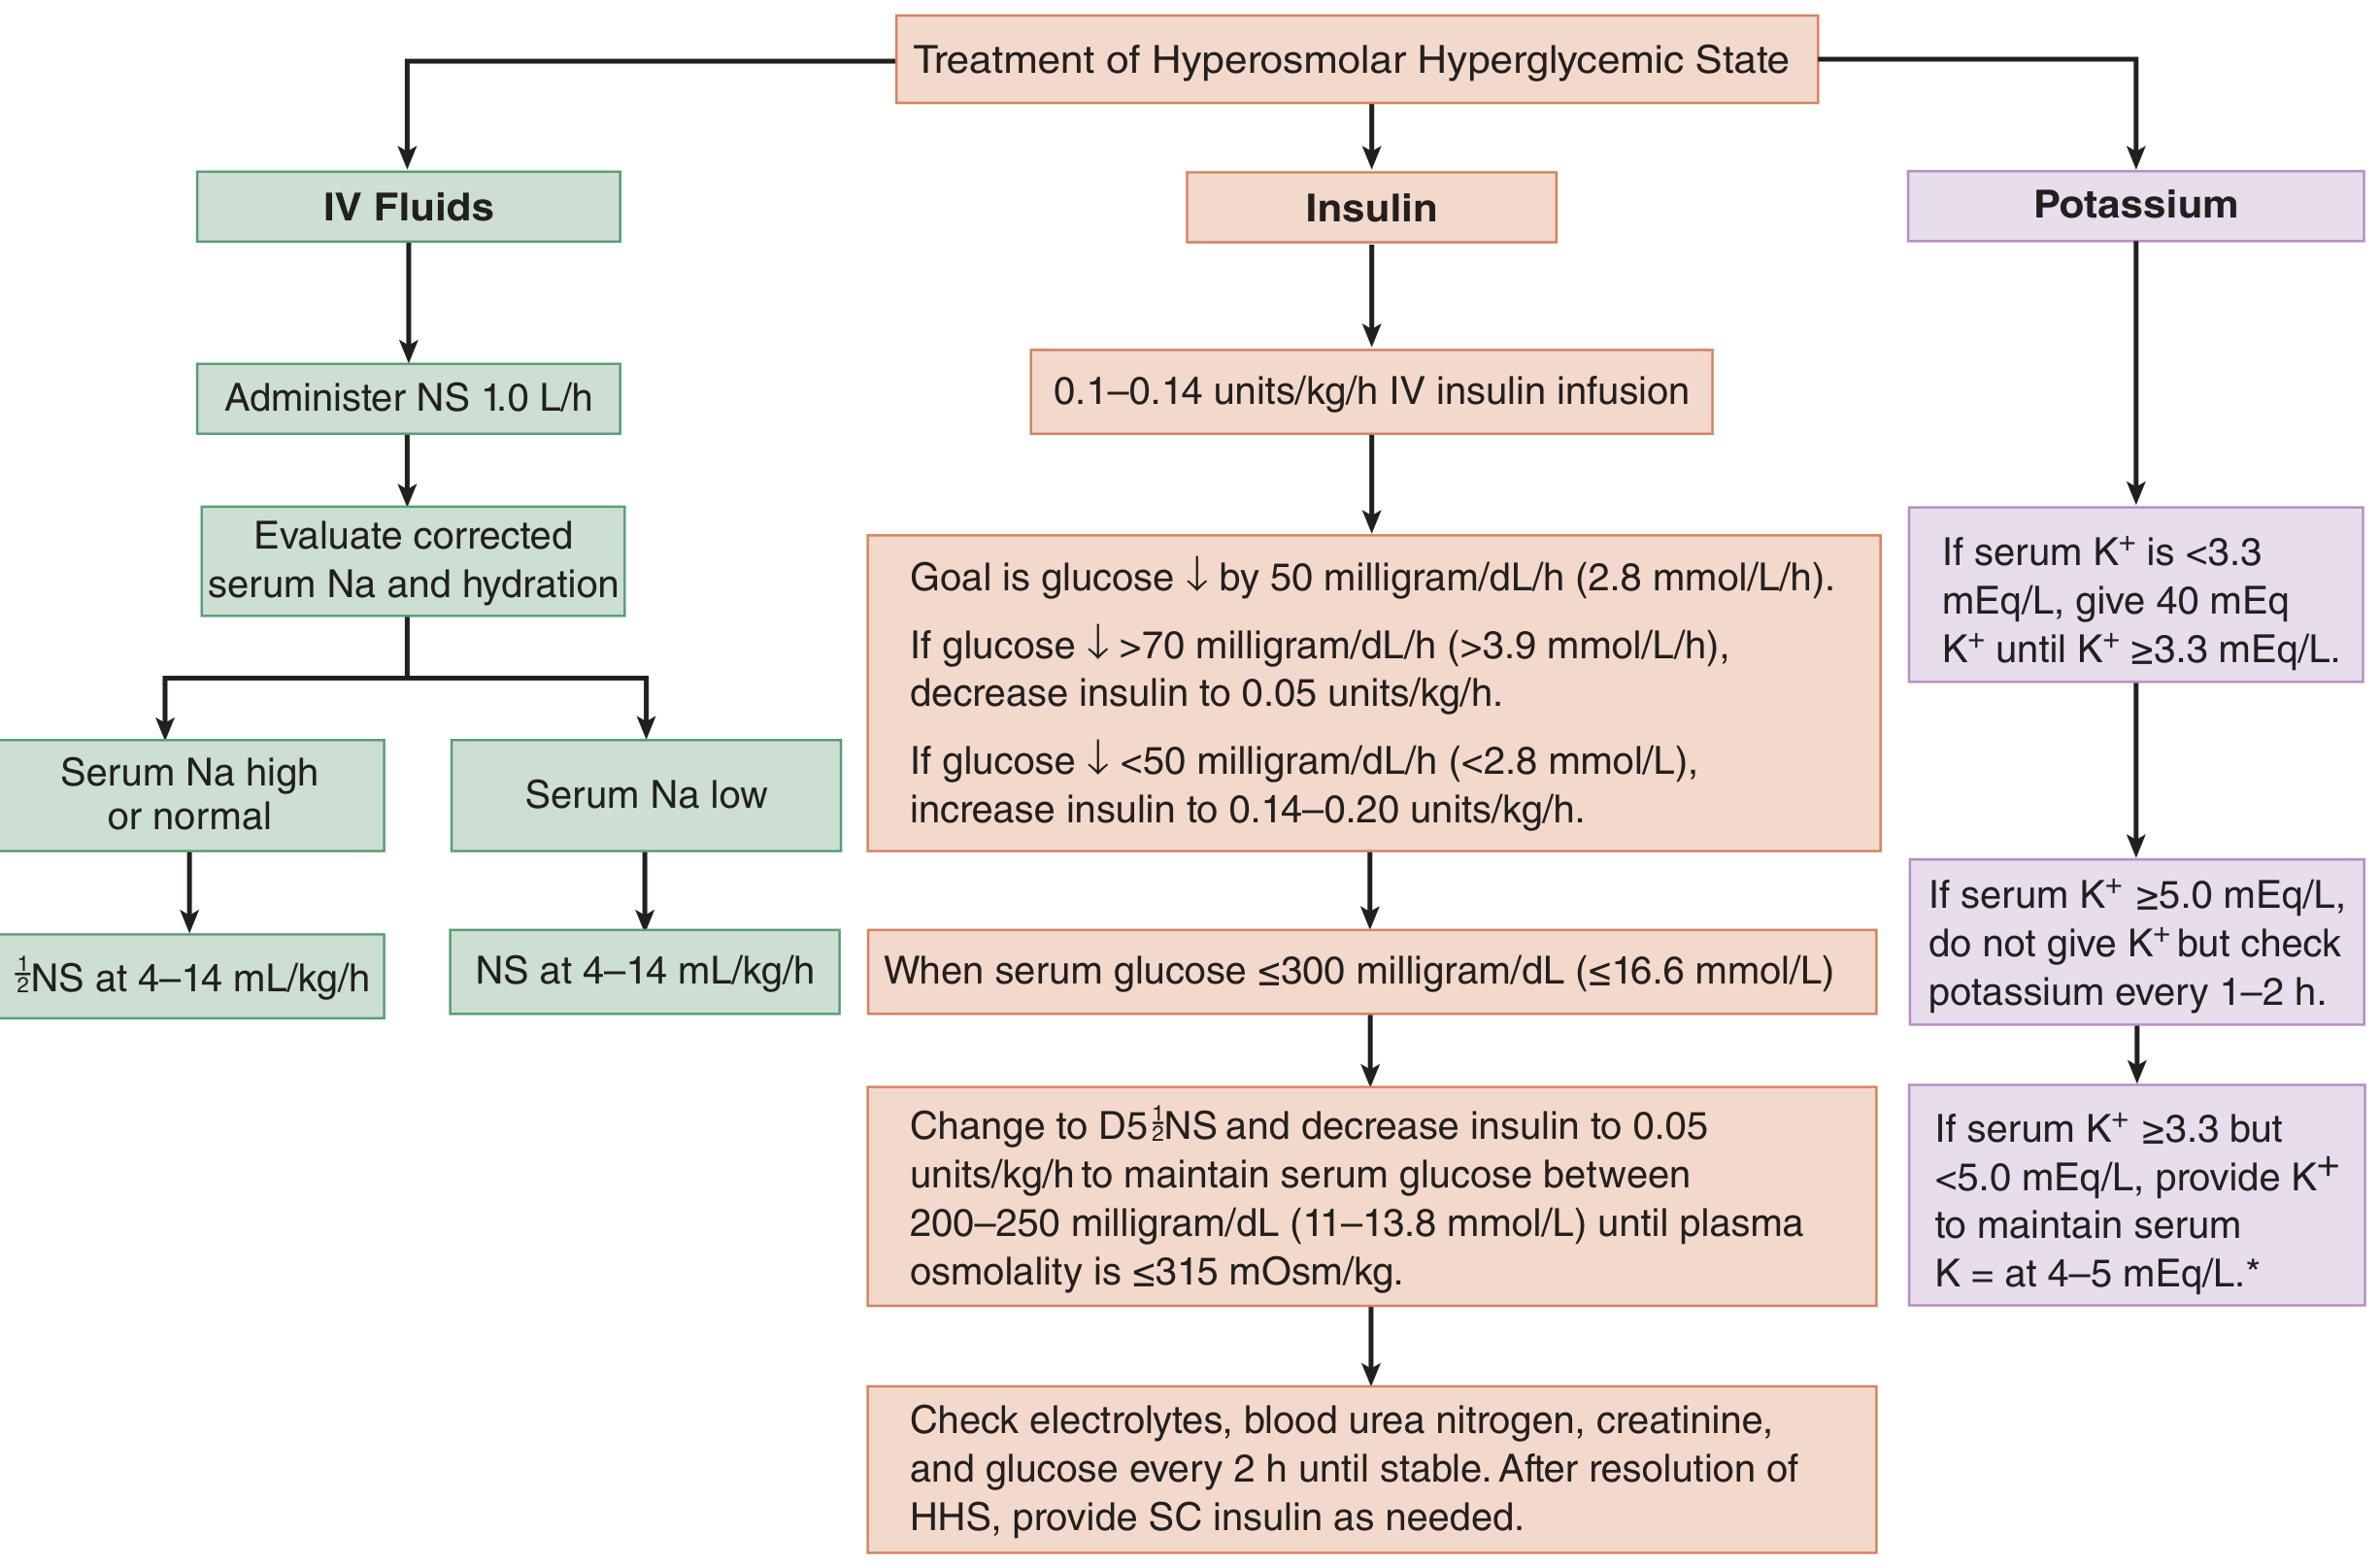
Fluid Resuscitation
| DKA | HHS | |
|---|---|---|
| Initial fluid | 0.9% NS 1-2 L over 1-3 h | 0.9% NS 1.0 L/h (more gradual rate) |
| Choice based on Na+ | Alternate 0.9%/0.45% NS | If Na high/normal: ½NS at 4-14 mL/kg/h; If Na low: NS at 4-14 mL/kg/h |
| Glucose target for dextrose addition | ≤250-300 mg/dL | ≤300 mg/dL |
| Glucose maintenance target | <200 mg/dL | 200-250 mg/dL (until osmolality ≤315 mOsm/kg) |
| Caution | Avoid cerebral edema (especially children) | Overzealous resuscitation causes cerebral edema and osmotic demyelination |
Insulin
| DKA | HHS | |
|---|---|---|
| IV infusion required? | Yes (for moderate/severe) | Not always - IV fluids alone can lower glucose initially |
| When to start insulin in HHS | Immediately (once K+ ≥3.3) | When glucose stops falling with fluids alone |
| Starting dose | 0.1 U/kg/h | 0.05 U/kg/h (lower - less aggressive) |
| Goal glucose fall | ≥10% in first hour | 50 mg/dL/h (titrate infusion accordingly) |
| Glucose target before dextrose | ≤250 mg/dL | ≤300 mg/dL |
"In hyperosmolar hyperglycemic state, intravenous fluid alone is the treatment of choice and will result in an initial decline in glucose because of increased absolute glycosuria. When the glucose level stops dropping, a fixed-rate IV insulin infusion should start at 0.05 units/kg/hour." - Goldman-Cecil Medicine, 2e
Potassium
- Both conditions: hold insulin if K+ <3.3 mEq/L
- In DKA: acidosis masks total body K+ deficit (serum K+ looks falsely normal/high)
- In HHS: K+ levels more accurately reflect total body stores because acidosis is less - potassium losses average 4-6 mEq/kg
- HHS target: maintain serum K+ at 4-5 mEq/L
Bicarbonate
- DKA: consider only if pH <7.0
- HHS: not indicated (no significant acidosis)
Special HHS Considerations
- Anticoagulation: Low-dose SC heparin is recommended - dehydration, hyperviscosity, hypotension, and inactivity all increase thrombotic risk
- Seizures: Phenytoin is contraindicated - often ineffective and impairs endogenous insulin release; use benzodiazepines instead
- Osmolality correction rate: Do not exceed 3 mOsm/kg/h - rapid correction risks cerebral edema and osmotic demyelination syndrome
8. Complications
| Complication | DKA | HHS |
|---|---|---|
| Cerebral edema | Common in children | Children with HHS have a higher incidence of fatal cerebral edema than adults |
| Hypokalemia | Very common | Common |
| Thromboembolism | Uncommon | More common (hyperviscosity, dehydration) |
| Rhabdomyolysis | Rare | Occurs with severe hyperosmolality |
| Osmotic demyelination | Rare | Risk with too-rapid correction |
| Mortality | 1-5% | 8-25% (higher due to older patients, comorbidities) |
9. Criteria for Resolution
| DKA | HHS | |
|---|---|---|
| Glucose | <200 mg/dL | <300 mg/dL |
| pH | >7.3 | >7.3 |
| Bicarbonate | ≥15 mEq/L | ≥15 mEq/L |
| Ketones | Beta-hydroxybutyrate <1.0 mmol/L | Not applicable (no significant ketosis) |
| Osmolality | Not primary target | ≤315 mOsm/kg |
| Mental status | Alert | Alert, back to baseline |
Quick Summary
| DKA | HHS | |
|---|---|---|
| Core defect | Absolute insulin deficiency + ketogenesis | Relative insulin deficiency + extreme hyperglycemia |
| Defining lab | Ketones + acidosis | Osmolality >320 mOsm/kg |
| Glucose | >250 mg/dL | >600 mg/dL |
| Ketones | +++ | Absent/trace |
| pH | <7.30 | >7.30 |
| Insulin urgency | Immediate (after K+ checked) | Fluids first; insulin only if glucose not falling |
| Mortality | Lower (1-5%) | Higher (8-25%) |