
Tranverse myelitis
transverse myelitis MRI spinal cord
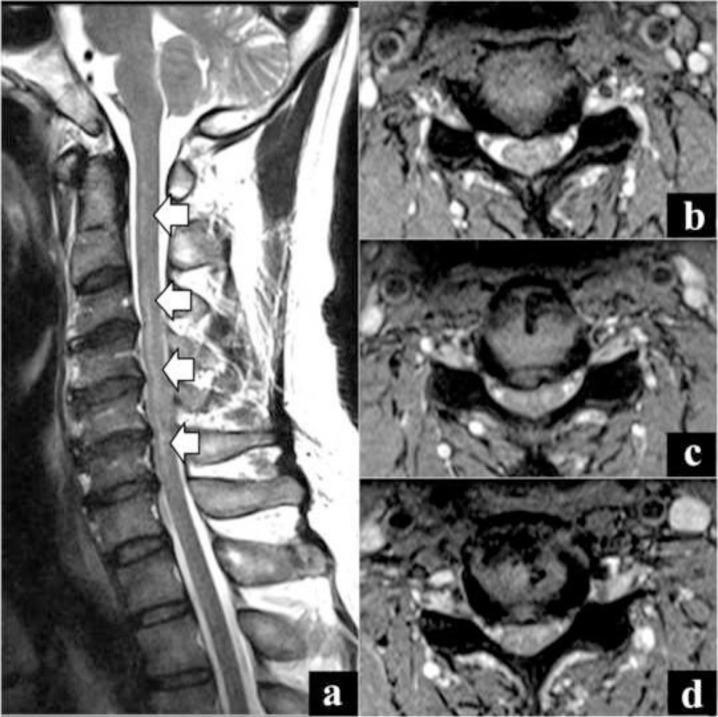
Magnetic Resonance Imaging (MRI) of the cervical spine illustrating a diagnostic view of transverse myelitis. Image (a) is a sagittal T2-weighted sequence showing extensive, longitudinal intramedullary hyperintensity within the spinal cord extending from the C2 to C7 levels, marked by white arrows. This indicates significant edema or inflammation without significant cord expansion. Images (b), (c), and (d) provide axial T2-weighted cross-sections at the C3-C4, C4-C5, and C5-C6 levels respectively. These axial views demonstrate a central, bright signal change within the cord parenchyma that appears hyperintense relative to normal cord tissue and is similar in intensity to the surrounding cerebrospinal fluid (CSF). There is mild evidence of spinal canal stenosis, but the primary pathology is the centrally located, diffuse signal abnormality. The findings are characteristic of longitudinal extensive transverse myelitis (LETM), often used in the differential diagnosis of neuroinflammatory conditions such as Neuromyelitis Optica (NMO) or multiple sclerosis.
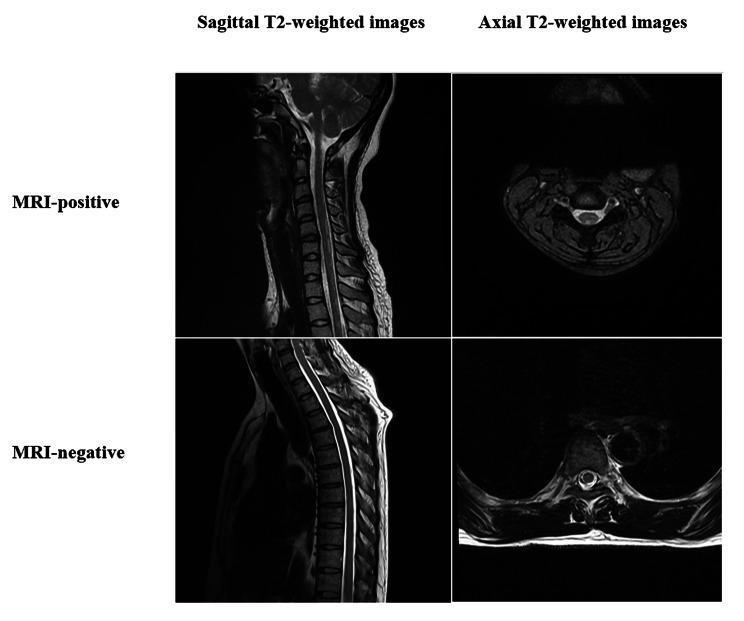
This diagnostic comparison chart displays four T2-weighted magnetic resonance imaging (MRI) scans of the spinal cord, illustrating Idiopathic Acute Transverse Myelitis (IATM). The image is organized into a 2x2 grid comparing MRI-positive and MRI-negative patients across sagittal and axial planes. In the MRI-positive sagittal view of the cervical spine, a distinct longitudinal area of hyperintense (bright) signal is visible within the spinal cord, indicating inflammation or edema characteristic of active transverse myelitis. The corresponding axial image confirms centrally located high signal intensity within the cord. In contrast, the MRI-negative sagittal and axial views show a spinal cord with normal morphology and uniform, low-to-intermediate signal intensity, demonstrating a clinical scenario where diagnostic criteria for IATM are met (e.g., via CSF analysis or clinical symptoms) despite unremarkable imaging. These images serve as educational examples for neuroradiology and neurology to differentiate between visible inflammatory lesions and MRI-negative clinical presentations of spinal cord disorders.
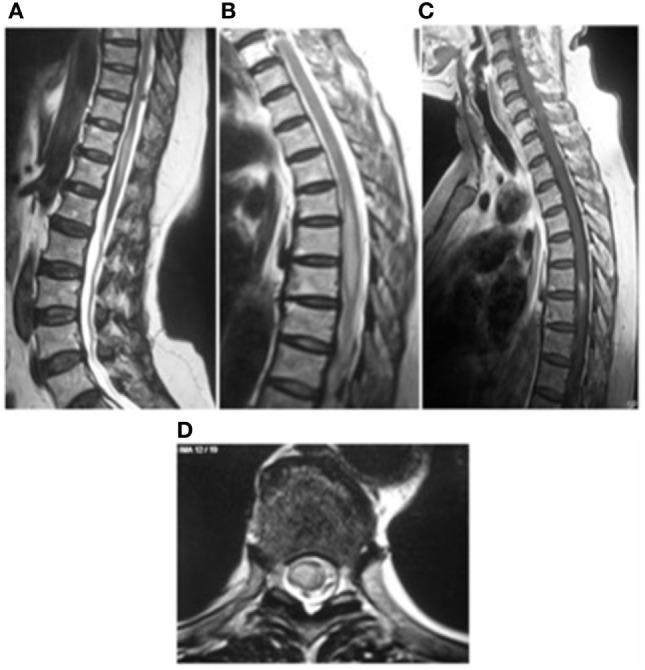
This diagnostic image set consists of MRI scans of the thoracic spine illustrating transverse myelitis. Panels A and B are sagittal T2-weighted images showing longitudinally extensive high signal intensity within the spinal cord, specifically spanning the T5-T7 and T10-T12 vertebral levels. These areas of hyperintensity are accompanied by mild cord swelling and enlargement, characteristic of inflammatory edema. Panel C presents a sagittal T1-weighted post-contrast image demonstrating focal enhancement within the affected cord segments, indicating a breach in the blood-spinal cord barrier. Panel D provides an axial view confirming the intramedullary location of the high signal intensity, which involves a significant cross-sectional area of the cord. These findings are clinically significant for diagnosing inflammatory or infectious myelopathies, such as spinal toxocariasis or idiopathic transverse myelitis, by identifying the extent of cord involvement and the presence of active inflammation through gadolinium enhancement.
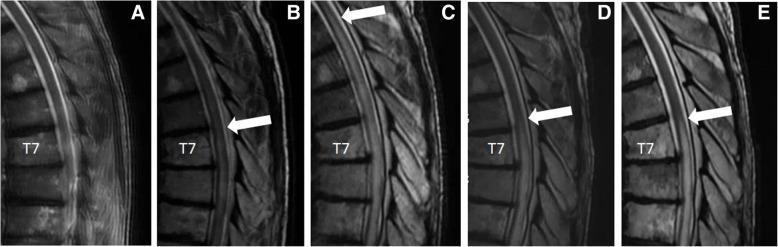
This series of five T2-weighted sagittal MRI images (labeled A through E) illustrates the longitudinal progression and treatment response of transverse myelitis in the thoracic spine. Image A serves as a baseline, showing normal spinal cord signal intensity without lesions. Image B demonstrates the emergence of increased intramedullary T2 signal intensity (hyperintensity) localized near the T7 vertebral level, indicative of early cord changes. Image C reveals significant cephalad extension (ascending) of the lesion, with a white arrow marking the superior border of the transverse myelitis, which now spans multiple vertebral segments. Images D and E show sequential follow-up after the initiation of immunotherapy (infliximab). Image D displays a marked reduction in the longitudinal extent and intensity of the T2 signal abnormality, suggesting a positive therapeutic response. Image E demonstrates a stable but persistent area of mild hyperintensity near T7, reflecting residual cord changes. This radiographic series is a classic educational example of immune-mediated or radiation-induced myelopathy and its monitoring through MRI imaging.
"transverse myelitis"[MeSH Terms] AND diagnosis AND treatment
Transverse Myelitis
Definition
- Goldman-Cecil Medicine, p. 3995
- Rosen's Emergency Medicine, p. 1508
- Adams and Victor's Principles of Neurology, 12th ed., p. 926
Etiology and Classification
| Category | Examples |
|---|---|
| Autoimmune / Demyelinating | Multiple sclerosis, NMOSD (AQP4-IgG+), MOG antibody disorder |
| Connective tissue diseases | SLE, Sjögren syndrome, antiphospholipid syndrome, mixed CTD |
| Vasculitis | Eosinophilic granulomatosis with polyangiitis |
| Infectious / Postinfectious | Viral infections (~30% of cases), direct infection |
| Vascular | Antiphospholipid antibody syndrome, dural venous fistula |
| Idiopathic | No cause identified in ~30% |
-
Acute Complete TM (ACTM): symmetrical, severe loss of function, distinct spinal cord level
-
Acute Partial TM (APTM): incomplete deficit, more commonly associated with MS
-
Rosen's Emergency Medicine, p. 1508
-
Goldman-Cecil Medicine, p. 3995
Pathogenesis
- Postinfectious immune-mediated demyelination (preceding viral infection in ~30%)
- Anti-AQP4 (aquaporin-4) antibody mediated injury, particularly in NMOSD
- Direct infectious invasion of cord parenchyma
- Inflammation disrupts ascending and descending tracts
Clinical Features
- Motor dysfunction - rapidly evolving paraparesis or paraplegia (over hours to days); bilateral Babinski signs; hypertonia and hyperreflexia develop after initial flaccidity
- Sensory deficit - ascending paresthesias, loss of deep sensation in feet, a distinct sensory level on the trunk
- Autonomic/Sphincter dysfunction - bowel, bladder, and sexual dysfunction; autonomic instability (hyper/hypotension, tachy/bradycardia) in cervical and high thoracic cases
-
Back pain and low-grade fever may be present
-
Up to one-third report a preceding infectious illness
-
The thoracic cord is most commonly affected (60-70%); cervical involvement is rare
-
Rosen's Emergency Medicine, p. 1508-1509
-
Adams and Victor's, p. 926
Key Concept: Longitudinally Extensive Transverse Myelitis (LETM)
Diagnosis
MRI (Investigation of Choice)
- T2 hyperintensity within the cord (intramedullary)
- Gadolinium enhancement (indicates active inflammation / blood-cord barrier breach)
- Cord swelling/expansion in acute phase
- LETM pattern (≥3 vertebral segments) raises suspicion for NMOSD
CSF Analysis
- Normal in 40% of cases
- Remaining 60%: mild lymphocytic pleocytosis or elevated protein
- Oligoclonal bands may be present (associated with MS)
Serology
- Anti-AQP4 IgG (NMO-IgG): diagnostic of NMOSD
- Anti-MOG IgG: MOG antibody-associated disorder
- ANA, antiphospholipid antibodies: screen for CTD
- Anti-Ro/La (SSA/SSB): Sjögren syndrome
Key exclusions to rule out first:
- Spinal cord compression (disc herniation, epidural malignancy, fracture)
- Spinal epidural abscess (SEA)
- Spinal cord infarct / anterior spinal artery syndrome
- Epidural hematoma
- Metastatic spinal neoplasm
Differential Diagnosis Summary
| Condition | Distinguishing Feature |
|---|---|
| MS | Short, asymmetric cord lesion; brain lesions on MRI |
| NMOSD | LETM (≥3 segments); anti-AQP4 IgG positive |
| Spinal cord infarct | Acute onset; anterior cord syndrome; DWI restriction |
| Spinal epidural abscess | Fever, back pain, raised inflammatory markers |
| MOG antibody disorder | MOG-IgG positive; often conus involvement |
| Vitamin B12 deficiency | Subacute combined degeneration; posterior cord |
Treatment
Acute Treatment
- High-dose IV methylprednisolone - 1000 mg/day for 3-5 days (first-line)
- Plasma exchange (PLEX) - for steroid-refractory cases
- IVIG - alternative in refractory disease
- Cyclophosphamide - considered in refractory cases
NMOSD-Specific Maintenance Therapy (preventing relapses)
- Satralizumab (anti-IL-6R): 120 mg SC at 0, 2, 4 weeks, then every 4 weeks
- Eculizumab (terminal complement inhibitor): 900 mg IV weekly x4, then 1200 mg every 2 weeks
- Tocilizumab (IL-6R inhibitor): 8 mg/kg IV every 4 weeks
Connective Tissue Disease-Associated TM
- High-dose corticosteroids + immunosuppressive agents (e.g., SLE-related, Sjögren-related TM)
Prognosis
- Prognosis is worse than MS: significant recovery occurs in fewer than 50% of patients
- Recovery typically begins within 1-3 months; maximal improvement by 3-6 months
- 30% good recovery | 25% fair recovery | 30% poor outcome | 15% mortality at 5 years
- Patients with rapid onset (spinal shock) tend to have worse outcomes
- Fewer than half develop disseminated MS within 5 years of initial attack
Relationship to Other Demyelinating Diseases
| Feature | TM in MS | Idiopathic TM | TM in NMOSD |
|---|---|---|---|
| Cord lesion length | Short (<3 segments) | Variable | LETM (≥3 segments) |
| Cross-section | Partial, asymmetric | Complete | Complete cross-section |
| Brain lesions | Yes (periventricular, Dawson fingers) | No | Area postrema, brainstem |
| Biomarker | Oligoclonal bands | None specific | AQP4-IgG / MOG-IgG |
| Recurrence | Yes (relapsing-remitting) | Monophasic | High relapse risk |
- Bradley and Daroff's Neurology, p. 1741
- Goldman-Cecil Medicine, p. 3995
- Rosen's Emergency Medicine, p. 1508