
Explain the cardiac cycle in easy way with flow chart and diagrams mbbs physiology
cardiac cycle diagram phases systole diastole
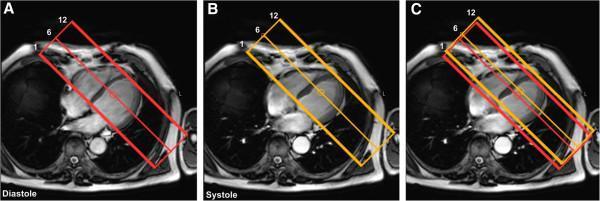
Diagnostic Cardiac MRI (CMR) acquisition planning diagram for 3D myocardial perfusion imaging. The image displays three axial 4-chamber cine frames (Panels A, B, and C) used to coordinate slice positioning during different phases of the cardiac cycle. In Panel A (Diastole), a red rectangular volume stack containing 12 slices is positioned over the heart, with markers for slices 1, 6, and 12 indicating coverage from the atria toward the ventricular apex. Panel B (Systole) demonstrates a yellow rectangular volume stack planned on the end-systolic frame. Panel C shows both the red (diastolic) and yellow (systolic) stacks superimposed on a single systolic frame, highlighting the longitudinal displacement and lengthening of the heart. This visualizes the necessity of phase-specific planning to account for cardiac motion, ensuring accurate quantification of myocardial blood flow (MBF) and myocardial perfusion reserve (MPR) in patients with suspected coronary artery disease (CAD). The images represent key technical steps in 3D-perfusion CMR protocols for medical students and radiology residents specializing in cardiovascular imaging.
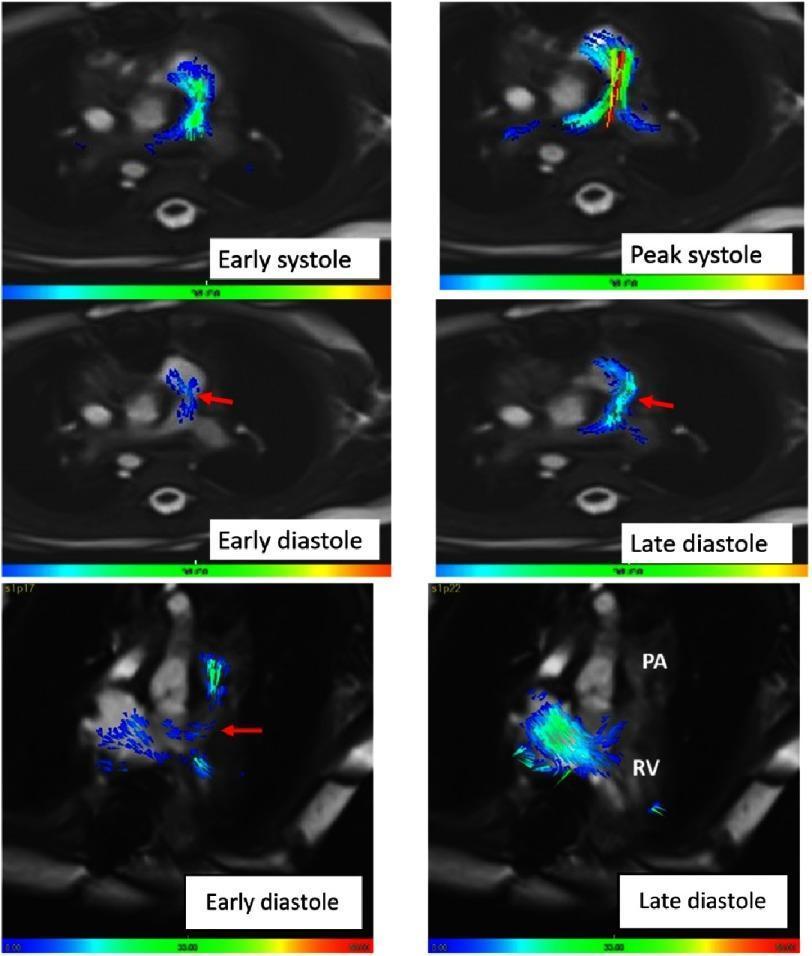
This diagnostic visual consists of multiple panels of functional cardiovascular magnetic resonance (CMR) imaging with 4D flow mapping, illustrating hemodynamic patterns in a post-operative neo-pulmonary artery (PA). The panels are organized by cardiac cycle phases: early systole, peak systole, early diastole, and late diastole. In early systole, flow is laminar and concentrated at the right ventricular (RV) outflow tract. During peak systole, velocity increases, indicated by a color shift from blue to yellow/red and elongated streamlines extending into the PA bifurcation. Early diastole shows a marked reduction in flow length with emerging direction changes. Late diastole demonstrates a distinct reversal of flow from the neo-pulmonary artery back toward the right ventricle, marked by red arrows and retrograde streamlines. These images evaluate post-surgical outcomes in complex congenital heart disease (such as truncus arteriosus repair), specifically assessing the efficiency of the neo-pulmonary conduit and the presence of diastolic regurgitation. The flow mapping provides critical data on velocity gradients and volumetric flow across the cardiac cycle.
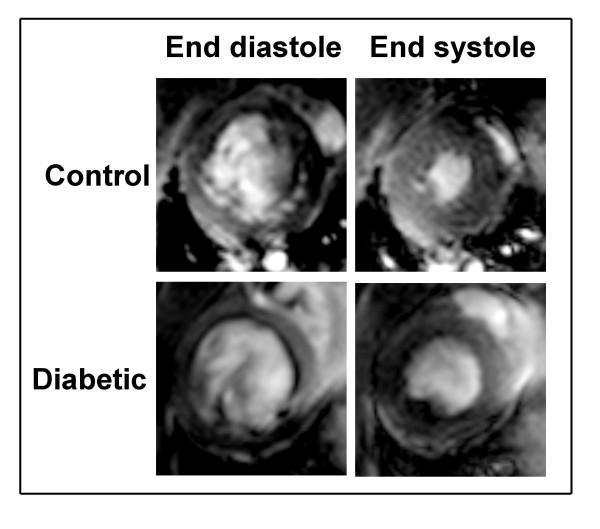
A 2x2 grid of cardiac MRI scans presenting short-axis cine images of the left ventricle (LV) in a rodent model of diabetic cardiomyopathy. The top row displays 'Control' subjects and the bottom row displays 'Diabetic' subjects. The columns categorize the cardiac cycle phases: 'End diastole' (maximum relaxation/filling) on the left and 'End systole' (maximum contraction/emptying) on the right. In the control group, there is a marked reduction in the high-signal (bright) blood pool area from diastole to systole, indicating robust ejection fraction. In the diabetic group, the LV end-diastolic volume appears smaller than the control, while the end-systolic volume appears relatively larger, suggesting impaired contractility and altered cardiac geometry characteristic of diabetic heart disease. The high-resolution imaging demonstrates clear contrast differentiation between the bright ventricular blood pool and the darker, surrounding myocardial wall. This image serves as a diagnostic comparison of ventricular function and volumetric changes across the cardiac cycle in a pathological model.
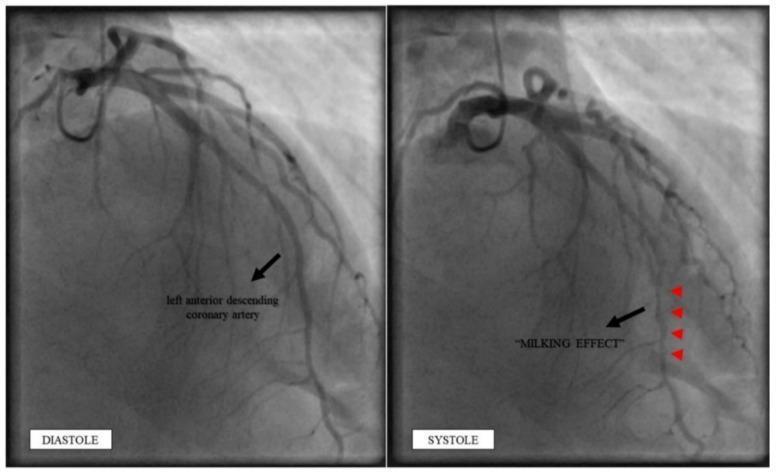
This diagnostic image displays a side-by-side comparison of invasive coronary angiography frames in a patient with myocardial bridging. The panels represent the cardiac cycle phases: 'DIASTOLE' (left) and 'SYSTOLE' (right). The focus is on the Left Anterior Descending (LAD) coronary artery. In the diastole phase, the LAD demonstrates a normal, uniform caliber. In the systole phase, the mid-portion of the LAD shows a significant, focal reduction in vessel diameter, indicated by red arrowheads. This characteristic visual finding is known as the 'milking effect,' where the overlying myocardial muscle bridge compresses the coronary artery during ventricular contraction. This dynamic stenosis is a hallmark diagnostic feature of myocardial bridging, differentiating it from fixed atherosclerotic lesions. The images are essential for demonstrating the pathophysiology of exercise-induced ischemia or angina in patients with anomalous intramyocardial arterial courses.
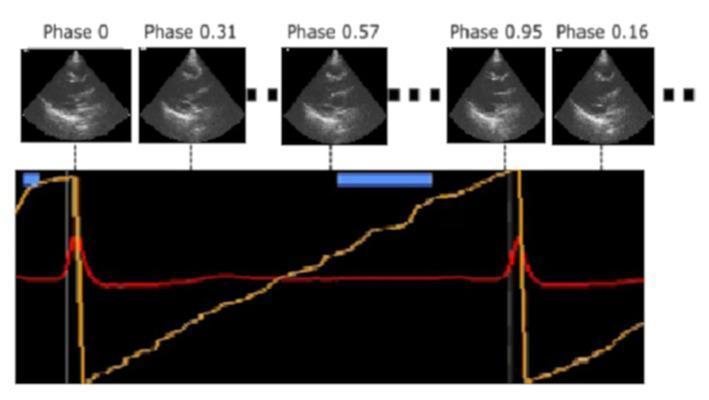
This composite educational graphic illustrates the real-time identification of cardiac cycle phases using an artificial intelligence algorithm integrated with echocardiography. The top row features a temporal sequence of five B-mode ultrasound frames, likely in a parasternal long-axis view, labeled sequentially by cardiac phase (ranging from Phase 0 to Phase 0.95 and returning to Phase 0.16). These frames demonstrate the dynamic anatomical changes of the heart chambers throughout diastole and systole. Below the images is a synchronized graph displaying two key traces: a red Electrocardiogram (ECG) trace showing the R-peak intervals, and a yellow linear mapping trace. The yellow trace represents a normalized temporal scale (0 to 1) between consecutive R-waves. Vertical dashed lines connect specific points on the linear mapping to their corresponding ultrasound frames, demonstrating how the AI algorithm assigns a specific cardiac phase to each ultrasound frame based on its exact temporal position within the R-R interval. This visualization highlights the application of computer-aided diagnostic tools in automating the gating and temporal alignment of cardiac imaging.
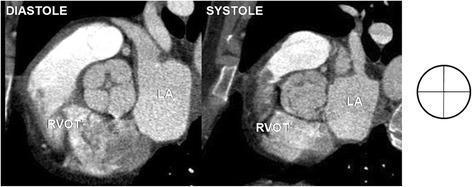
This diagnostic image displays axial cardiac computed tomography (CT) scans illustrating a rare congenital heart anomaly: a quadricuspid aortic valve (QAV). The content is presented in two side-by-side frames depicting different phases of the cardiac cycle. The left frame, labeled 'DIASTOLE', shows the aortic valve in its closed state, characterized by four distinct leaflets meeting at a central point to form a 'cross' or 'X' shape closure line. The right frame, labeled 'SYSTOLE', demonstrates the valve in its open configuration, revealing a central orifice for blood ejection. Anatomical landmarks are labeled for spatial orientation: the Right Ventricular Outflow Tract (RVOT) is positioned inferiorly and the Left Atrium (LA) is situated laterally to the central aortic valve. A schematic diagram to the far right further clarifies the four-quadrant geometric arrangement of the leaflets. This comparison is clinically significant for diagnosing valvular morphology and assessing potential functional impairments like aortic regurgitation or stenosis associated with non-tricuspid variants.
Wiggers diagram cardiac cycle pressure volume heart sounds ECG
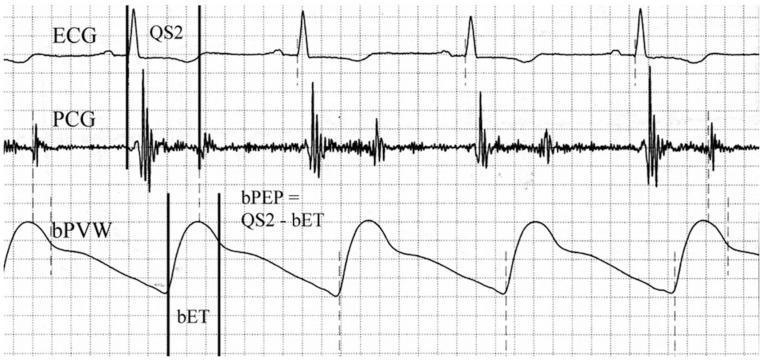
This physiological waveform diagram displays a simultaneous recording of three cardiac parameters used for assessing cardiovascular hemodynamics. The top trace is an Electrocardiogram (ECG) showing standard QRS complexes representing ventricular depolarization. The middle trace is a Phonocardiogram (PCG) capturing acoustic vibrations of heart sounds, specifically the S1 and S2 sounds. The bottom trace is a Brachial Pulse Volume Waveform (bPVW) illustrating the peripheral arterial pressure pulse. Vertical markers indicate temporal relationships between these signals to calculate systolic time intervals. The 'QS2' interval is marked from the onset of the QRS complex on the ECG to the aortic component of the second heart sound on the PCG, representing the total electromechanical systolic interval. The 'bET' (Brachial Ejection Time) is delineated on the bPVW from the waveform foot to the dicrotic notch. An annotated formula shows the calculation of the Brachial Pre-ejection Period (bPEP) as the difference between QS2 and bET (bPEP = QS2 - bET). This diagram is an educational tool for understanding the non-invasive assessment of cardiac systolic function and arterial stiffness.
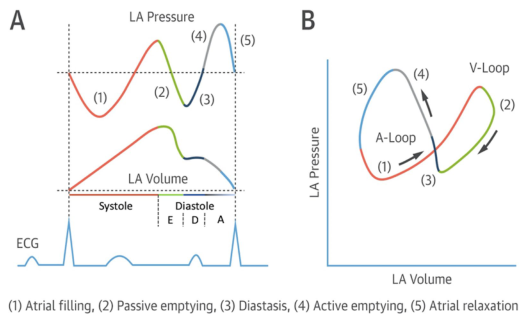
Summary : This figure illustrates the left atrial (LA) pressure-volume relationship during the cardiac cycle, showing both time-course traces and a pressure-volume loop, with key phases of atrial function annotated and correlated with the ECG. line plot and loop diagram: # Panel A: LA Pressure and Volume Traces • Top trace: LA Pressure (y-axis, arbitrary units) over time. • Middle trace: LA Volume (y-axis, arbitrary units) over time. • Bottom trace: ECG waveform for temporal reference. • X-axis: Cardiac cycle phases, with systole and diastole labeled; diastole further subdivided into E, D, and A phases. • Five phases are color-coded and numbered: – (1) Atrial filling (red) – (2) Passive emptying (green) – (3) Diastasis (black) – (4) Active emptying (blue) – (5) Atrial relaxation (gray) • Vertical dashed lines demarcate transitions between phases. # Panel B: LA Pressure-Volume Loop • X-axis: LA Volume (arbitrary units). • Y-axis: LA Pressure (arbitrary units). • The loop is traced in a counterclockwise direction, with arrows indicating the sequence. • The same five phases (1–5) are color-coded as in Panel A. • The loop is divided into two segments: A-Loop (phases 1, 3, 4, 5) and V-Loop (phase 2). # Design Encodings : • Distinct colors for each phase (red, green, black, blue, gray). • Arrows on the loop indicate the direction of the cardiac cycle. • ECG trace provides timing reference for the pressure and volume changes. # Analysis : • The LA pressure and volume traces show cyclical changes corresponding to atrial filling, emptying, and relaxation. • The pressure-volume loop visually summarizes the dynamic relationship between LA pressure and volume, with distinct segments for passive and active phases. • The figure highlights the temporal coordination between atrial events and the ECG, emphasizing the mechanical and electrical coupling in the cardiac cycle.
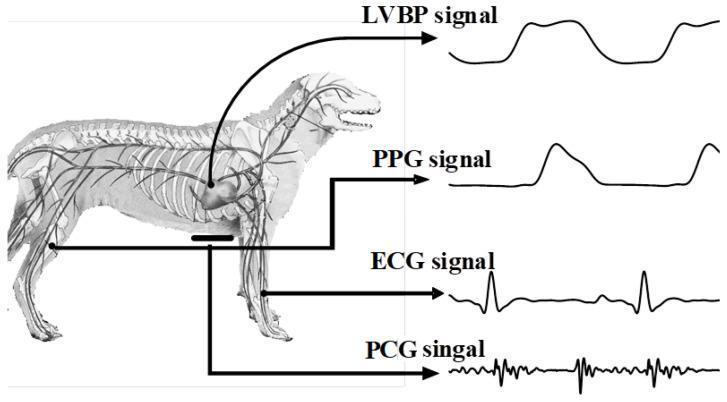
An educational anatomical and physiological diagram illustrating the synchronous collection of multiple cardiovascular biosignals in a canine model. The left side features a lateral-view anatomical illustration of a canine, highlighting the skeletal system, the heart, and major peripheral arteries. Four distinct biosignal waveforms are displayed on the right, with arrows tracing each to its anatomical point of acquisition: 1) LVBP (Left Ventricular Blood Pressure) signal, showing a rhythmic pressure waveform originating from the heart. 2) PPG (Photoplethysmogram) signal, a pulsatile volume waveform traced to the femoral artery. 3) ECG (Electrocardiogram) signal, showing characteristic P-QRS-T complexes with a prominent R-wave, traced to the forelimbs (Lead I configuration). 4) PCG (Phonocardiogram) signal, depicting high-frequency oscillations representing heart sounds, recorded from the cardiac apex. The diagram demonstrates the integration of invasive and non-invasive hemodynamic monitoring, useful for teaching comparative physiology and cardiovascular signal processing.
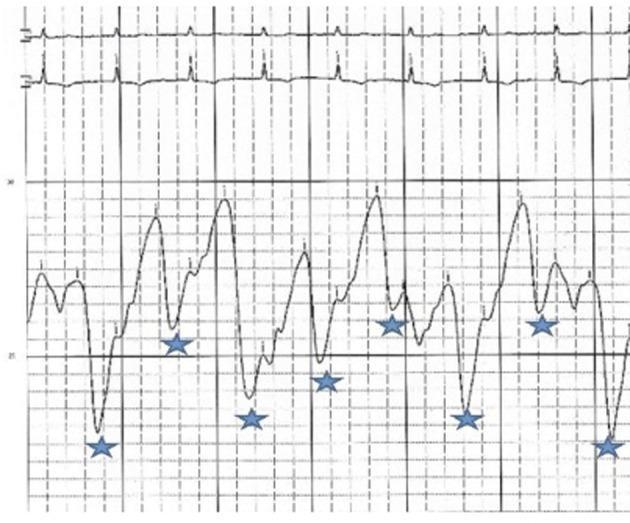
This diagnostic hemodynamic tracing displays a right atrial (RA) pressure waveform alongside a concurrent electrocardiogram (ECG) lead. The upper section shows a standard ECG rhythm with regular QRS complexes, which serve as a temporal reference for the mechanical events of the cardiac cycle. The lower section depicts the RA pressure tracing, characterized by a significantly elevated mean pressure (approximately 33 mmHg) persisting after pericardiocentesis. The most notable morphologic feature is the presence of sharp, deep 'y' descents, indicated by blue asterisks on the tracing. These descents represent rapid atrial emptying during early ventricular diastole. The combined findings of elevated RA pressure and prominent 'y' descents are visually characteristic of constrictive or effusive-constrictive pericarditis. The tracing illustrates the loss of normal pressure-volume relationships in the right heart due to external restriction, providing a classic example of hemodynamic 'tamponade-like' physiology transitioning toward constriction.
isovolumetric contraction relaxation ventricular ejection filling phases heart valves
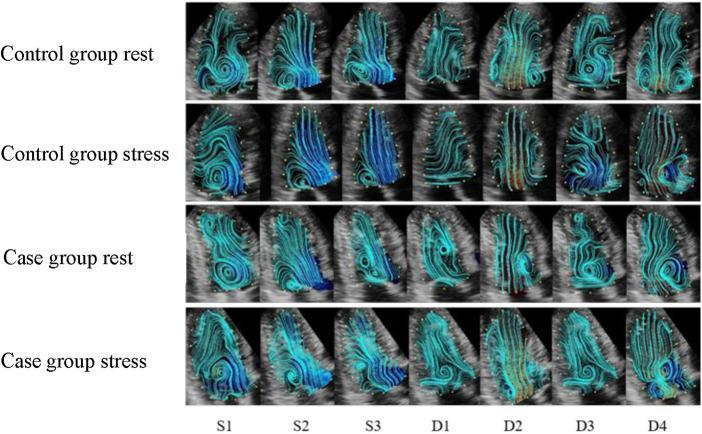
This diagnostic image represents a comparative analysis of left ventricular (LV) hemodynamics using vector flow mapping (VFM) technology. The visual presents a 4x7 grid comparing four cohorts: 'Control group rest', 'Control group stress', 'Case group rest', and 'Case group stress' across seven phases of the cardiac cycle: isovolumetric contraction (S1), rapid ejection (S2), slow ejection (S3), isovolumetric relaxation (D1), rapid filling (D2), slow filling (D3), and atrial systole (D4). Blue streamlines visualize the intracardiac blood flow patterns and vortex formation. Key educational features include the visualization of normal vortex formation at the basal segment during S1 and D4 in the control group, and the alteration of these patterns under pharmacological or exercise stress. The comparison highlights variations in streamline density, directionality, and organization between healthy controls and cases (potentially coronary artery disease or heart failure), specifically noting the more disordered streamlines and reduced apical flow density in the case groups during rapid filling (D2) and isovolumetric relaxation (D1). This imaging modality is used to evaluate cardiac efficiency and diastolic function through vortex area and circulation parameters.
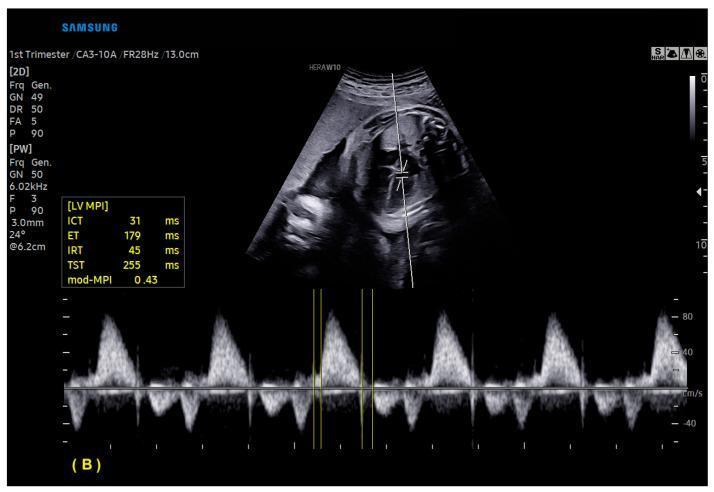
This diagnostic image displays a fetal ultrasound from the first trimester of pregnancy, demonstrating advanced cardiac functional assessment. The composite view includes a grayscale two-dimensional (2D) ultrasound of the fetal heart in a four-chamber view (top) and a spectral Doppler waveform (bottom). A vertical white line in the 2D image indicates the Doppler sample volume placement across the left ventricle (LV) inflow and outflow tracts. The spectral Doppler waveform illustrates ventricular filling and ejection phases with automated timing markers. A data table on the left presents calculated functional parameters for the Left Ventricle Myocardial Performance Index (LV MPI), including Isovolumetric Contraction Time (ICT: 31 ms), Ejection Time (ET: 179 ms), Isovolumetric Relaxation Time (IRT: 45 ms), Total Systolic Time (TST: 255 ms), and the modified Myocardial Performance Index (mod-MPI: 0.43). This visual demonstrates the use of artificial intelligence software (MPI+) for automated fetal echocardiography measurements.
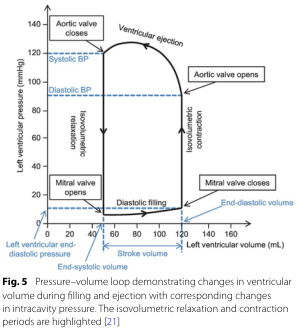
Summary : This figure shows a pressure–volume loop for the left ventricle, illustrating how ventricular volume and pressure change during the cardiac cycle, with key phases and valve events annotated. The isovolumetric relaxation and contraction periods are highlighted, and systolic/diastolic blood pressures are marked. pressure–volume loop diagram: # Title & Axes : • No explicit title on the figure, but the legend describes it as a "Pressure–volume loop demonstrating changes in ventricular volume during filling and ejection with corresponding changes in intracavity pressure." • X-axis: "Left ventricular volume (mL)" with tick marks at 0, 20, 40, 60, 80, 100, 120, 140, 160. • Y-axis: "Left ventricular pressure (mmHg)" with tick marks at 0, 20, 40, 60, 80, 100, 120, 140. • Additional axis labels: "Left ventricular end-diastolic pressure" (blue, left), "End-diastolic volume" (blue, bottom right), "Stroke volume" (black, bottom center). # Phases & Events : • Isovolumetric relaxation: vertical line at low volume, pressure drops, labeled. • Diastolic filling: horizontal line at low pressure, volume increases, labeled. • Isovolumetric contraction: vertical line at high volume, pressure rises, labeled. • Ventricular ejection: curved line, volume decreases as pressure peaks and falls, labeled. • Valve events: – Mitral valve opens (bottom left corner, low pressure/volume). – Mitral valve closes (bottom right corner, high volume/low pressure). – Aortic valve opens (top right corner, high volume/high pressure). – Aortic valve closes (top left corner, low volume/high pressure). # Blood Pressure Markers : • Systolic BP: horizontal dashed blue line at ~120 mmHg. • Diastolic BP: horizontal dashed blue line at ~80 mmHg. # Design Encodings : • Black solid lines for the loop. • Blue dashed lines for blood pressure markers. • Blue text for end-diastolic volume/pressure. • Labeled arrows for direction of phases and valve events. # Analysis : • The loop traces the cardiac cycle, starting at low pressure/volume (end-systolic), filling during diastole, rising sharply during isovolumetric contraction, ejecting blood during ventricular ejection, and dropping pressure during isovolumetric relaxation. • Systolic and diastolic blood pressures are marked, showing the pressure range during ejection. • The width of the loop (horizontal distance) represents stroke volume. • The figure clearly distinguishes the four main phases and the timing of valve openings/closings, providing a comprehensive view of ventricular mechanics during a heartbeat.
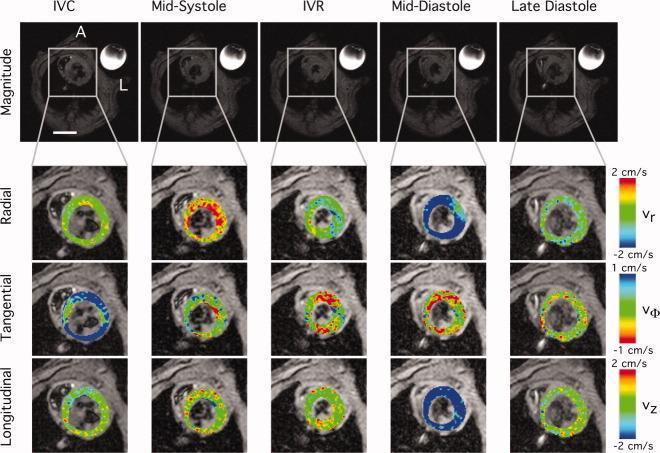
This diagnostic composite shows mid-ventricular Tissue Phase Mapping (TPM) MRI of a heart across five cardiac phases: Isovolumetric Contraction (IVC), Mid-Systole, Isovolumetric Relaxation (IVR), Mid-Diastole, and Late Diastole. The top row displays magnitude images showing the left ventricle's (LV) morphology, where the lumen decreases in size during mid-systole and expands toward late diastole. The subsequent three rows provide color-coded velocity maps for myocardial motion analysis. The Radial Velocity (Vr) row uses a red-to-blue scale (2 to -2 cm/s), illustrating peak contraction (red) in mid-systole and relaxation (blue) in mid-diastole. The Tangential Velocity (Vφ) row (1 to -1 cm/s) depicts rotational mechanics, showing clockwise rotation (blue) during IVC and counter-clockwise rotation (red/yellow) during mid-systole/IVR. The Longitudinal Velocity (Vz) row (2 to -2 cm/s) tracks base-to-apex motion, with red indicating systolic shortening and blue indicating diastolic lengthening. These images facilitate the assessment of transmural wall motion and regional myocardial strain, particularly relevant for diagnosing ischemia or cardiomyopathy.
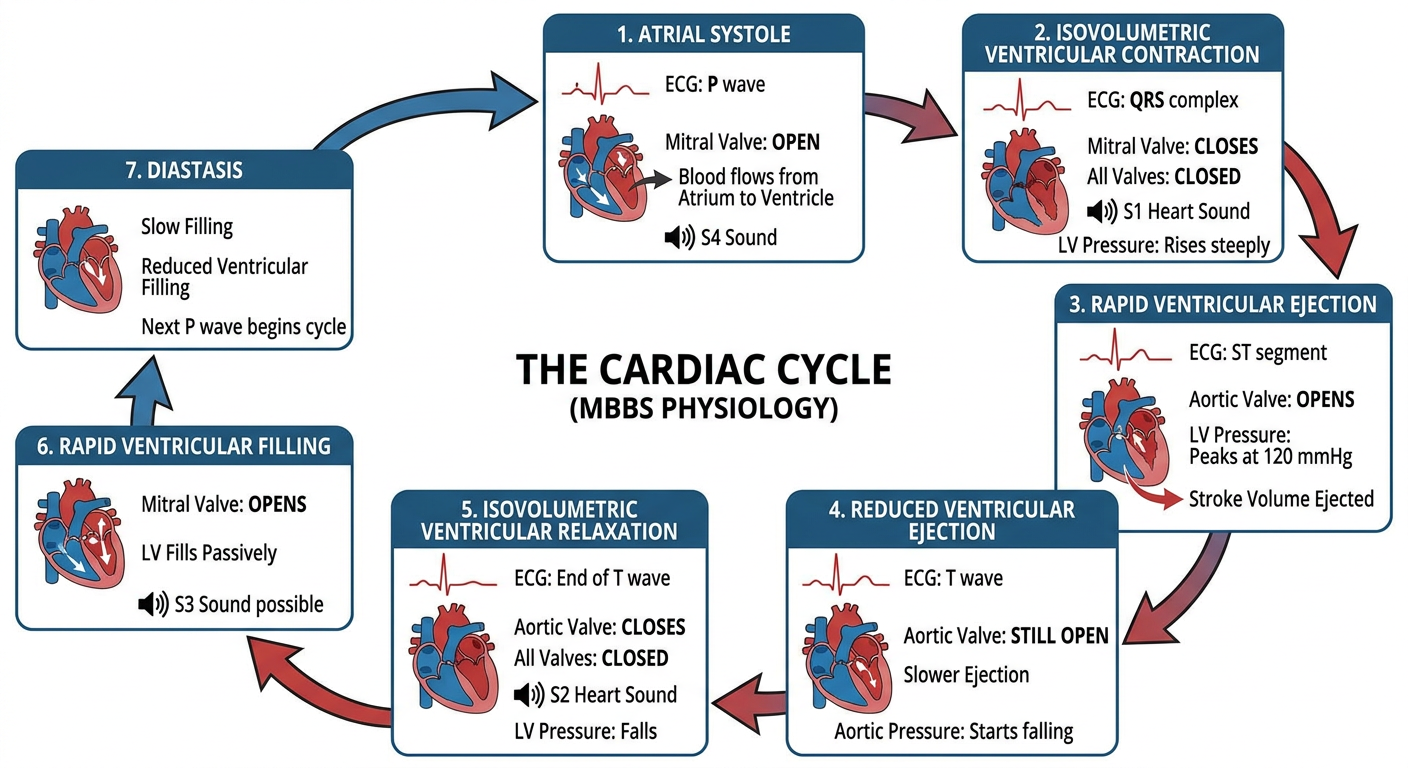
A detailed flowchart of the cardiac cycle for MBBS physiology students showing all 7 phases in sequence: (1) Atrial Systole - P wave on ECG, mitral valve open, blood flows from atrium to ventricle, S4 sound; (2) Isovolumetric Ventricular Contraction - QRS complex, mitral valve closes, all valves closed, S1 heart sound, LV pressure rises steeply; (3) Rapid Ventricular Ejection - aortic valve opens, LV pressure peaks at 120 mmHg, stroke volume ejected, ST segment; (4) Reduced Ventricular Ejection - T wave, aortic valve still open, slower ejection, aortic pressure starts falling; (5) Isovolumetric Ventricular Relaxation - end of T wave, aortic valve closes, S2 heart sound, all valves closed, LV pressure falls; (6) Rapid Ventricular Filling - mitral valve opens, LV fills passively, S3 sound possible; (7) Diastasis - slow filling, reduced ventricular filling, next P wave begins cycle. Include key pressures, valve status (open/closed), ECG correlation, and heart sounds (S1-S4) for each phase. Clean educational medical diagram with arrows showing cycle continuity.
The Cardiac Cycle - Complete MBBS Guide
What Is the Cardiac Cycle?
- Systole = ventricular contraction
- Diastole = ventricular relaxation + filling
The Cardiac Cycle Flowchart
The Classic Cardiac Cycle Diagram (Wiggers/Costanzo Diagram)
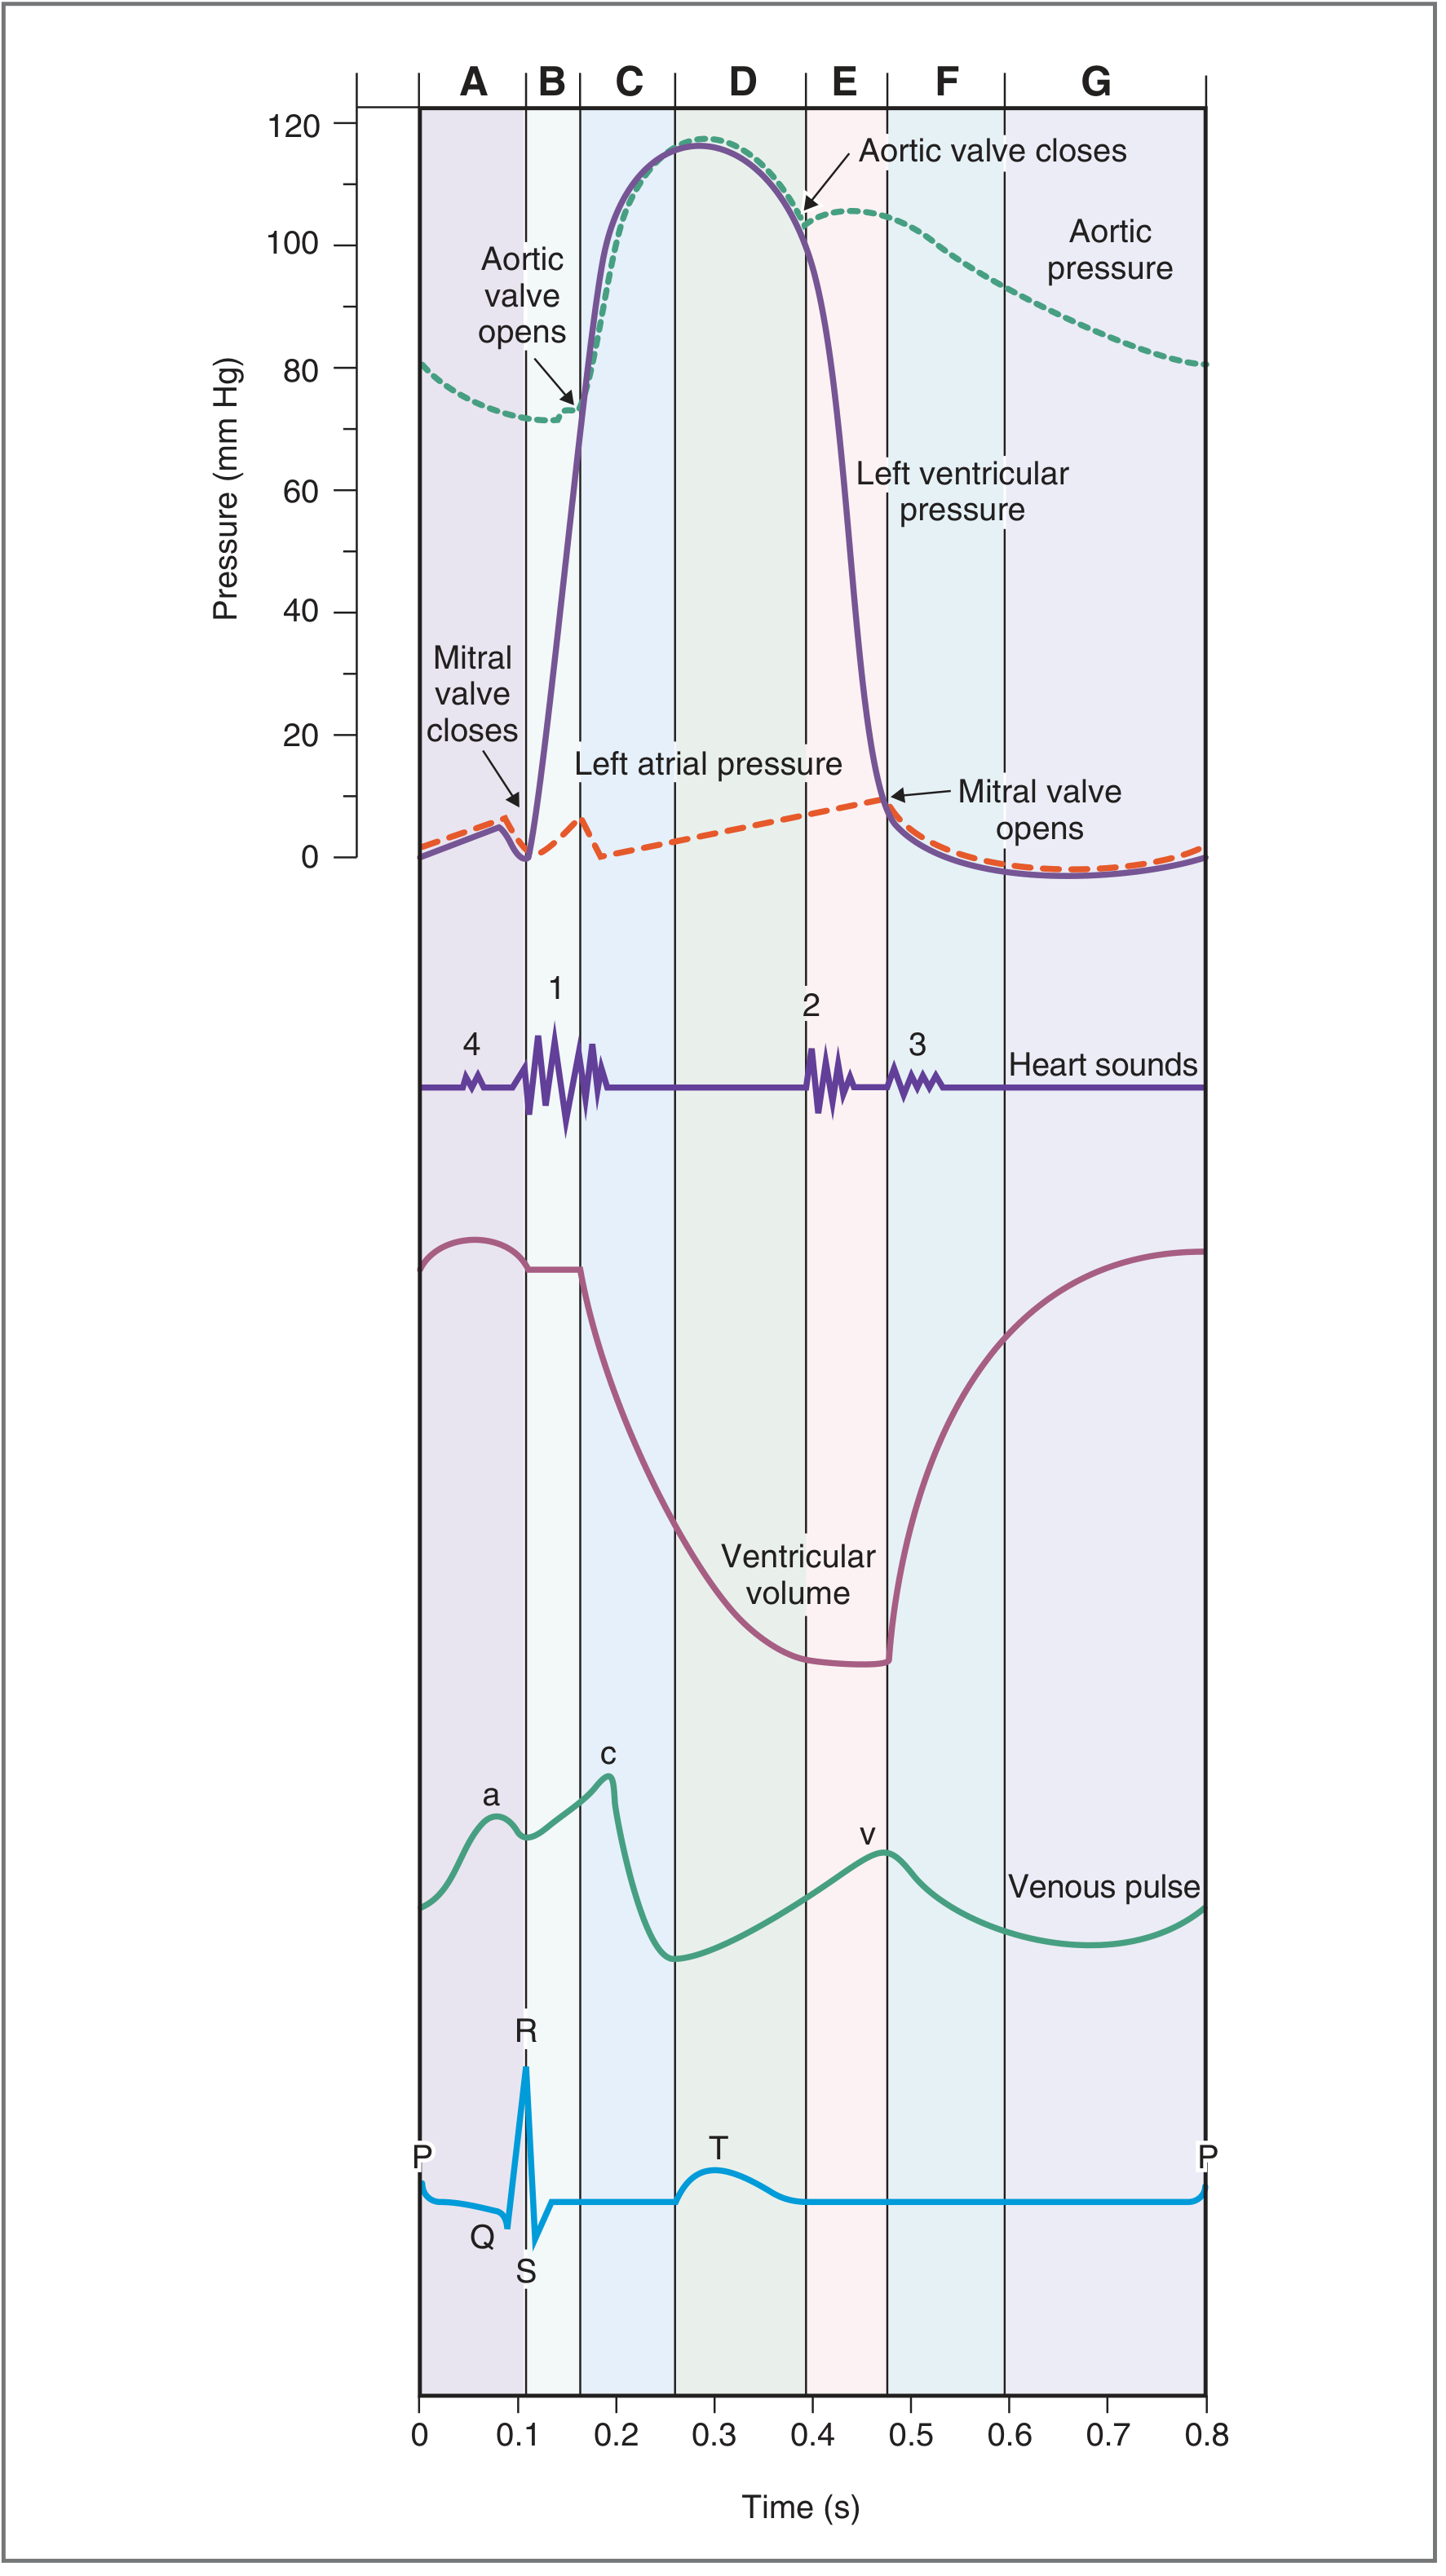
Phase-by-Phase Breakdown
Phase A - Atrial Systole
| Parameter | What Happens |
|---|---|
| ECG | P wave (atrial depolarization) |
| Valves | Mitral valve OPEN, aortic valve CLOSED |
| Mechanism | Atria contract → push remaining blood into ventricle |
| LV Volume | Increases slightly (adds ~20% of final volume) |
| Heart Sound | S4 (not audible normally; heard in stiff ventricle) |
| Key Point | Even without atrial systole, ventricles are ~80% filled passively |
Phase B - Isovolumetric Ventricular Contraction (IVC)
| Parameter | What Happens |
|---|---|
| ECG | QRS complex (ventricular depolarization) |
| Valves | ALL VALVES CLOSED (mitral just closed, aortic not yet open) |
| Mechanism | LV pressure rises sharply but volume stays CONSTANT |
| LV Pressure | Rises from ~0 → ~80 mmHg |
| Heart Sound | S1 ("lub") - caused by mitral (and tricuspid) valve closure |
| Key Point | "Iso" = same; "volumetric" = volume. Volume doesn't change because no blood can enter or leave |
Exam tip: IVC is the phase with the greatest rate of pressure rise (dP/dt max) - a marker of contractility.
Phase C - Rapid Ventricular Ejection
| Parameter | What Happens |
|---|---|
| ECG | ST segment |
| Valves | Aortic valve OPENS (when LV pressure > aortic pressure ~80 mmHg) |
| Mechanism | Blood rapidly ejected into aorta |
| LV Pressure | Peaks at ~120 mmHg (systolic BP) |
| LV Volume | Falls sharply (~70% of stroke volume ejected here) |
| Heart Sound | None |
| Key Point | Aortic pressure also rises as blood enters aorta |
Phase D - Reduced Ventricular Ejection
| Parameter | What Happens |
|---|---|
| ECG | T wave begins (ventricular repolarization) |
| Valves | Aortic valve still OPEN |
| Mechanism | Ventricles beginning to relax, ejection continues but slower |
| LV Pressure | Starts to fall |
| LV Volume | Continues to fall but slower |
| Heart Sound | None |
| Key Point | Aortic pressure also starts falling as blood "runs off" into arteries |
End of systole: LV volume at its minimum = End-Systolic Volume (ESV) ~50 mL. Stroke Volume = EDV - ESV = 120 - 50 = 70 mL
Phase E - Isovolumetric Ventricular Relaxation (IVR)
| Parameter | What Happens |
|---|---|
| ECG | After T wave ends |
| Valves | ALL VALVES CLOSED (aortic just closed, mitral not yet open) |
| Mechanism | LV pressure falls rapidly; volume stays CONSTANT |
| LV Pressure | Falls from ~80 → ~0 mmHg |
| Heart Sound | S2 ("dub") - caused by aortic (then pulmonic) valve closure |
| Key Point | The dicrotic notch on aortic pressure trace = aortic valve closure |
Splitting of S2: Aortic valve closes slightly before pulmonic. During inspiration, pulmonic closure is further delayed → wide splitting heard.
Phase F - Rapid Ventricular Filling
| Parameter | What Happens |
|---|---|
| ECG | After T wave (early diastole) |
| Valves | Mitral valve OPENS (when LV pressure falls below LA pressure ~5-8 mmHg) |
| Mechanism | Blood rushes from LA into LV passively (pressure gradient) |
| LV Volume | Rises rapidly |
| Heart Sound | S3 (can be heard; normal in children/young adults, pathological in elderly = sign of heart failure) |
| Key Point | ~80% of ventricular filling happens passively in this phase |
Phase G - Reduced Ventricular Filling (Diastasis)
| Parameter | What Happens |
|---|---|
| ECG | Between T wave and next P wave |
| Valves | Mitral valve OPEN |
| Mechanism | Slow, passive equalization of LA and LV pressures |
| LV Volume | Rises slowly |
| Heart Sound | None |
| Key Point | This phase is most shortened when heart rate increases |
Quick Reference Table
| Phase | ECG | Mitral Valve | Aortic Valve | Volume | Heart Sound |
|---|---|---|---|---|---|
| A - Atrial Systole | P wave | Open | Closed | ↑ slightly | S4 |
| B - IVC | QRS | Closed | Closed | Constant | S1 |
| C - Rapid Ejection | ST | Closed | Open | ↓↓ | - |
| D - Reduced Ejection | T wave | Closed | Open | ↓ | - |
| E - IVR | Post-T | Closed | Closed | Constant | S2 |
| F - Rapid Filling | - | Open | Closed | ↑↑ | S3 |
| G - Diastasis | TP interval | Open | Closed | ↑ slowly | - |
Pressure-Volume (P-V) Loop
- Diastolic filling (bottom, right side) - Mitral valve open, LV fills from ~50 mL → 120 mL
- Isovolumetric Contraction (right vertical line) - Mitral closes, pressure rises, volume constant
- Ventricular Ejection (top, curved) - Aortic valve open, LV empties, volume falls
- Isovolumetric Relaxation (left vertical line) - Aortic closes, pressure falls, volume constant
Width of loop = Stroke Volume (70 mL). Area inside loop = Stroke Work.
Key Numbers to Remember
| Parameter | Value |
|---|---|
| Heart rate (normal) | 72 bpm |
| Cycle duration | 0.833 sec |
| Systole | ~0.3 sec |
| Diastole | ~0.5 sec |
| End-Diastolic Volume (EDV) | 120-130 mL |
| End-Systolic Volume (ESV) | 50-60 mL |
| Stroke Volume (SV = EDV - ESV) | ~70 mL |
| Ejection Fraction (EF = SV/EDV) | ~55-65% |
| Aortic valve opens | LV pressure > ~80 mmHg |
| Aortic valve closes (dicrotic notch) | ~100 mmHg |
| Peak systolic pressure | ~120 mmHg |
Heart Sounds - Simple Memory Aid
| Sound | Timing | Cause | Mnemonic |
|---|---|---|---|
| S1 - "Lub" | Start of systole | Mitral + tricuspid valve closure | "MiTral cloS1es" |
| S2 - "Dub" | Start of diastole | Aortic + pulmonic valve closure | "Aortic + Pulmonic cloS2es" |
| S3 | Early diastole | Rapid ventricular filling, ventricular wall vibration | Normal in young; heart failure in elderly |
| S4 | Late diastole | Atrial contraction against stiff LV | Always abnormal (LVH, hypertension) |
Clinical Correlations (Exam Favorite)
- Increased heart rate mainly shortens diastole (particularly diastasis), reducing filling time
- Aortic stenosis → LV must generate higher pressure → IVC phase prolonged → LV hypertrophy
- Mitral stenosis → LA pressure elevated → a, c, v waves on venous pulse distorted
- Heart failure → S3 gallop (rapid filling into dilated LV causes wall vibration)
- LV hypertrophy → S4 gallop (stiff ventricle resists atrial filling)
- Wide splitting of S2 → Right bundle branch block or pulmonary stenosis (delays pulmonic closure)
- Fixed splitting of S2 → ASD (atrial septal defect)
- Paradoxical splitting of S2 → Aortic stenosis or LBBB (aortic closure delayed, happens after pulmonic)
Sources
- Costanzo Physiology 7th Edition - Fig. 4.25, Table 4.5
- Guyton and Hall Textbook of Medical Physiology - Chapter 9, Fig. 9.8