
A pt presented with paralysis of leg and aphasia .. artery involved?
anterior cerebral artery territory stroke brain diagram
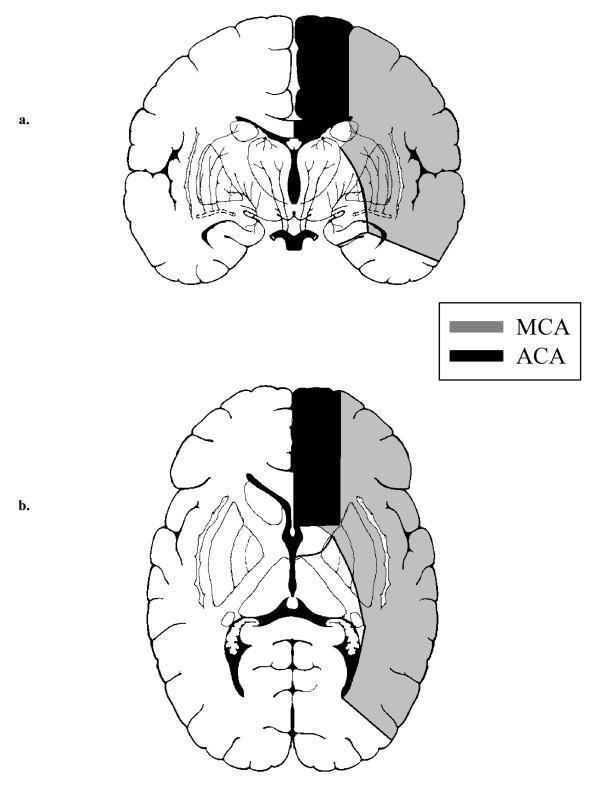
This medical illustration depicts the vascular territories of the cerebral arteries in the human brain across two anatomical planes: (a) a coronal section and (b) an axial section. The diagram utilizes a grayscale coding scheme to differentiate the arterial supply of the cerebral hemispheres. The anterior cerebral artery (ACA) territory is highlighted in black, primarily occupying the medial aspect of the frontal and parietal lobes, including the cingulate gyrus and the frontal pole. The middle cerebral artery (MCA) territory is shaded in gray, covering the expansive lateral surfaces of the frontal, parietal, and temporal lobes, as well as deep structures like the basal ganglia and internal capsule. The educational focus is on the spatial distribution and boundaries between these major vascular zones, which is critical for clinical localization in neurovascular conditions like ischemic stroke. The presence of anatomical landmarks such as the ventricles and subcortical nuclei provides context for the depth and extent of the arterial perfusion areas.
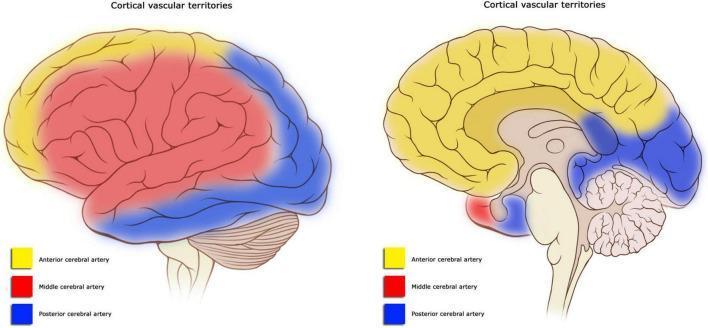
This anatomical diagram illustrates the cortical vascular territories of the human brain through lateral (left) and midsagittal (right) views. The territories are color-coded to differentiate the areas supplied by the three major cerebral arteries. The Anterior Cerebral Artery (ACA) territory, highlighted in yellow, encompasses the medial surface of the frontal and parietal lobes, extending to the superior border of the lateral surface. The Middle Cerebral Artery (MCA) territory, shown in red, dominates the lateral surface, covering the majority of the frontal, parietal, and temporal lobes, including the primary motor and sensory cortices. The Posterior Cerebral Artery (PCA) territory, marked in blue, supplies the occipital lobe, the inferior portion of the temporal lobe, and the posterior medial surface. The diagram serves as a clinical education tool for understanding stroke syndromes and neuroanatomical localization, highlighting the watershed zones where these arterial territories meet. Key structures visible include the cerebral cortex, cerebellum, and brainstem.
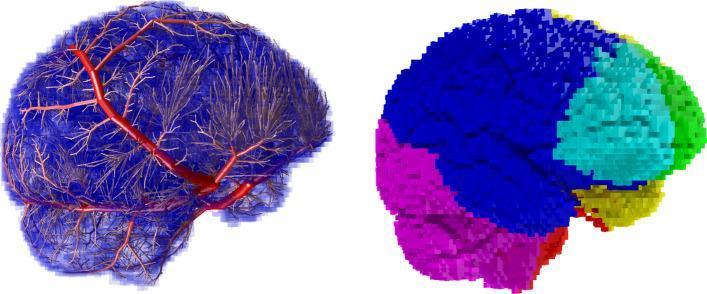
Anatomical diagram and comparison chart displaying an in silico model of human cerebral vasculature and its corresponding perfusion territories. The left panel shows a complex 3D arterial tree with hierarchical branching, where proximal major arteries are highlighted in red, extending into a dense network of distal vessels covering a semi-transparent blue brain volume. The right panel illustrates the same brain volume divided into color-coded perfusion territories mapped via a voxelated grid. The Anterior Cerebral Artery (ACA) territories are represented in green and turquoise (anterior/superior); the Middle Cerebral Artery (MCA) territories are shown in dark blue and yellow (lateral surface); and the Posterior Cerebral Artery (PCA) territory and cerebellum are depicted in purple and red (posterior/inferior). This visual provides an educational framework for understanding cerebrovascular anatomy, blood supply distribution, and the physiological basis for embolic stroke localization across major arterial zones.
Answer: Anterior Cerebral Artery (ACA)
Why ACA?
Classic ACA Stroke Features (textbook summary):
| Feature | Explanation |
|---|---|
| Contralateral leg/foot paralysis | Paracentral lobule (leg area of motor cortex) - leg > arm |
| Expressive aphasia (Broca's) | Left (dominant) hemisphere ACA involvement |
| Urinary incontinence | Frontal lobe micturition control |
| Mental status changes | Confusion, amnesia, personality changes, apathy, abulia |
| Contralateral sensory loss | Somatosensory cortex (medial) |
| Apraxia | Supplementary motor area involvement |
| Primitive reflexes | Grasp and suck reflexes return |
| Gait dysfunction | Frontal lobe gait center |
Key Distinguishing Point vs. MCA:
- ACA: Leg > arm weakness + aphasia (medial cortex)
- MCA: Arm + face > leg weakness + aphasia (lateral cortex) - the far more common stroke
Anatomical Basis:
Swanson's Family Medicine Review: "Signs and symptoms of ACA stroke include... foot and leg deficits (more frequent than arm deficits) and contralateral leg or foot paralysis; expressive aphasia (for left hemisphere only)."
Rosen's Emergency Medicine: "Paralysis and hypaesthesia of the lower limb opposite the side of the lesion are characteristic. Leg weakness is more pronounced than arm weakness in anterior cerebral distribution stroke."
A patient having pansystolic murmur at the aortic area with plateau pulse. Likely cause is A. Tricuspid incompetence B. ASD C. Aortic stenosis D. PDA E. VSD
aortic stenosis pulse waveform plateau pulsus parvus tardus
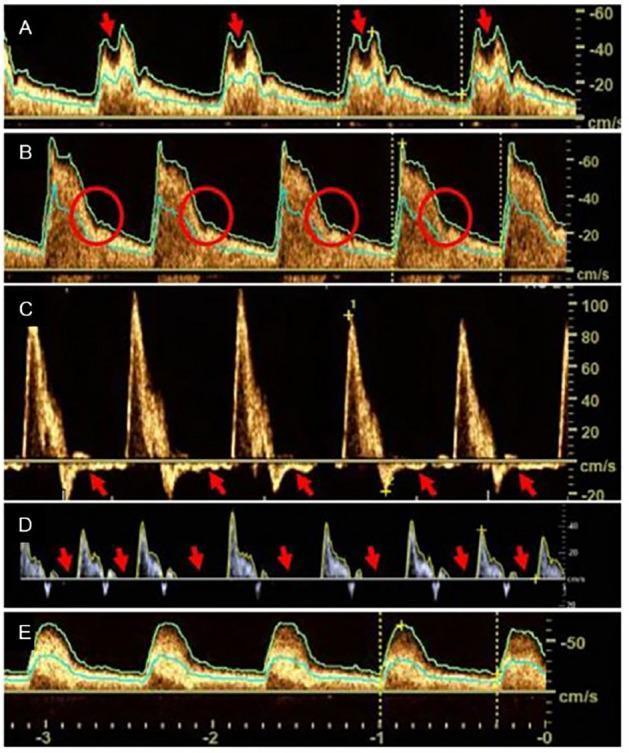
This diagnostic image set consists of five neurovascular ultrasound (nvUS) spectral Doppler waveforms (Panels A–E) illustrating pathological flow profiles in the carotid arteries associated with aortic valve disease. Panel A displays a 'bisferious pulse' (pulsus bisferiens) in the internal carotid artery (ICA), characterized by two systolic peaks marked by red arrows. Panel B shows the ICA with an absent dicrotic notch, indicated by red circles during the early diastolic phase. Panel C demonstrates 'diastolic reversal' in the common carotid artery (CCA), with red arrows highlighting retrograde flow below the baseline during diastole, a classic sign of severe aortic regurgitation. Panel D shows 'zero diastole,' where diastolic flow velocity reaches the baseline (red arrows), indicating high resistance or significant valvular pathology. Panel E illustrates 'pulsus tardus et parvus' in the ICA, characterized by a prolonged systolic upstroke (tardus) and low peak systolic velocity (parvus), typically indicative of aortic valve stenosis. These Doppler waveforms serve as clinical markers for secondary hemodynamic effects of valvular heart disease on cerebral perfusion.
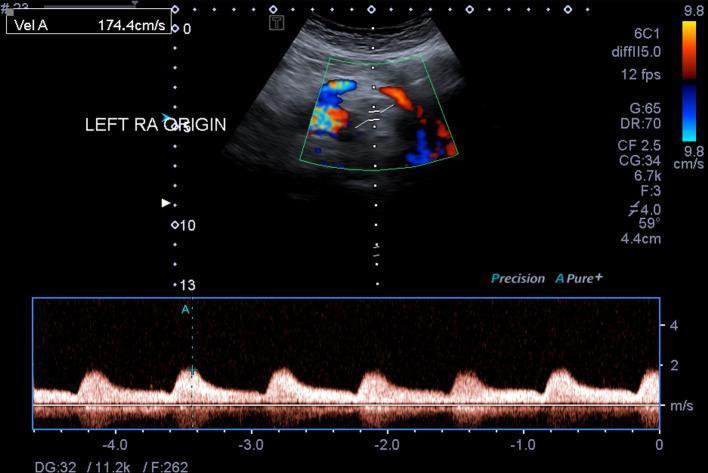
This diagnostic image is a duplex ultrasound combining color Doppler and spectral pulse wave Doppler of the abdominal aorta at the level of the left renal artery (RA) origin. The upper panel displays a color Doppler image showing a mosaic pattern of red, blue, and yellow hues within the vessel, indicating turbulent flow and aliasing. The lower panel displays a spectral waveform characterized by a 'tardus parvus' morphology. This pattern is defined by a delayed systolic upstroke (prolonged acceleration time) and low-amplitude, rounded peaks with a decreased peak systolic velocity (PSV), here measured at approximately 174.4 cm/s. Such hemodynamic findings are clinically significant as they typically occur distal to a high-grade arterial stenosis or obstruction, representing the dampening of the pulse wave as it passes through a narrowed segment of the aorta. This educational visual is essential for understanding vascular hemodynamics and the diagnostic criteria for aortic or renal artery pathology in radiology and vascular medicine.
Answer: C. Aortic Stenosis
The Two Key Clues Explained:
1. Plateau Pulse (Pulsus Parvus et Tardus)
- This is the pathognomonic pulse of aortic stenosis
- "Parvus" = small amplitude (low pulse pressure due to fixed obstruction)
- "Tardus" = slow rising, with a sustained plateau before falling
- The plateau character reflects the slow, sustained ejection of blood through a narrowed aortic valve against high resistance
- It is felt as a weak, slow-rising, sustained pulse at the carotid or radial artery
2. "Pansystolic Murmur at the Aortic Area"
- In severe/critical AS, the murmur may become prolonged enough to fill the entire systole, effectively sounding "pansystolic" clinically
- It is loudest at the aortic area (right 2nd intercostal space) and radiates to the carotids
- Combined with the plateau pulse, this firmly points to aortic stenosis
Bailey & Love's Surgery: "Auscultation demonstrates an ejection systolic murmur that is typically harsh and best heard over the aortic area with radiation to the carotids."
Why the Other Options Are Wrong:
| Option | Murmur Type | Location | Pulse |
|---|---|---|---|
| A. Tricuspid incompetence | Pansystolic | Lower left sternal edge | Normal |
| B. ASD | Ejection systolic | Pulmonary area (left 2nd ICS) | Normal |
| C. Aortic stenosis ✓ | Ejection systolic (harsh, at aortic area) | Right 2nd ICS | Plateau (parvus et tardus) |
| D. PDA | Continuous "machinery" | Left 2nd ICS | Collapsing/waterhammer pulse |
| E. VSD | Pansystolic | Left 3rd-4th ICS | Normal |
Memory Hook:
Plateau pulse = AS (the valve barely opens, blood squeezes through slowly = sustained, flat upstroke) Collapsing/waterhammer pulse = AR/PDA (blood rushes in then falls back quickly)
https://www.instagram.com/reel/DbdQKUMToya/?igsh=MWY5cmR4dXpseTZjbQ==
- If it's a medical MCQ or concept from the reel, just type it out and I'll explain it in full detail
- If it's an image or screenshot from the reel, you can upload it here and I'll analyse it
- If it's a topic you want me to cover, just mention the subject