


im a medical student. answer this question for me and help me understand in simple way
You have 5 study guides here covering a lot of ground. Which one(s) do you want me to focus on?
coagulation cascade clotting factors diagram
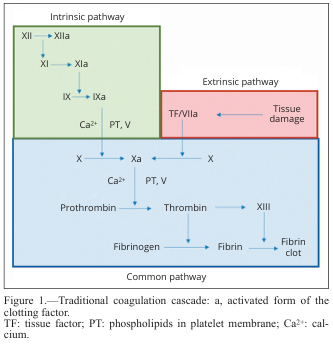
Summary : This diagram illustrates the traditional coagulation cascade, detailing the sequence of events and factors involved in blood clotting via the intrinsic, extrinsic, and common pathways. flowchart: # Pathways : • Intrinsic pathway (green box): Initiated by factor XII, proceeds through XI, IX, and VIII, with activation steps indicated by "a" (e.g., XIIa, XIa, IXa). • Extrinsic pathway (red box): Initiated by tissue damage, which activates tissue factor (TF) and factor VIIa. • Common pathway (blue box): Both intrinsic and extrinsic pathways converge at factor X, leading to the activation of prothrombin to thrombin, which then converts fibrinogen to fibrin, forming a fibrin clot. # Nodes : • XII → XIIa (Intrinsic) • XI → XIa (Intrinsic) • IX → IXa (Intrinsic) • Ca²⁺, PT, V (Intrinsic, Common) • TF/VIIa (Extrinsic) • Tissue damage (Extrinsic) • X → Xa (Common) • Prothrombin → Thrombin (Common) • Fibrinogen → Fibrin (Common) • XIII (Common) • Fibrin clot (Common) # Connectors : • Arrows indicate the direction of activation or conversion between factors. • Intrinsic and extrinsic pathways both feed into the activation of factor X in the common pathway. • Ca²⁺ and PT, V are required cofactors at specific steps. # Layout : • Three main colored sections: green (intrinsic, top left), red (extrinsic, top right), blue (common, bottom). • Flow proceeds from top (initiation) to bottom (clot formation). • Arrows show sequential activation and convergence of pathways. # Analysis : • The diagram clearly separates the intrinsic and extrinsic initiation mechanisms, both converging on the common pathway at factor X. • The cascade is highly sequential, with each activated factor catalyzing the next step. • Calcium ions (Ca²⁺) and phospholipids (PT) are essential cofactors at multiple steps. • The final outcome is the formation of a stable fibrin clot, highlighting the coordinated nature of the coagulation process.
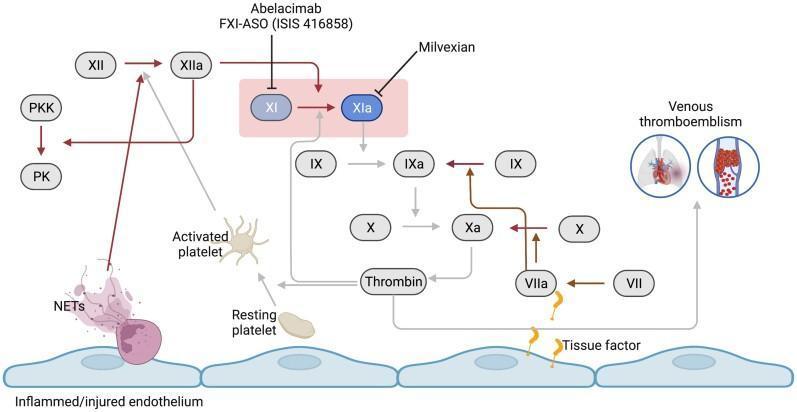
This pathophysiology diagram illustrates the coagulation cascade focusing on the central role of Factor XI (FXI) in venous thromboembolism. The visual depicts an inflamed/injured endothelial layer at the base, leading to the activation of the contact pathway (via FXII and NETs) and the extrinsic pathway (via Tissue Factor and FVII). Key clotting factors, including FXII, FXI, FIX, FX, and Thrombin, are shown as oval nodes interconnected by arrows representing biochemical activation. A highlighted pink box focuses on the conversion of FXI to FXIa, noting pharmacologic inhibitors like Abelacimab, FXI-ASO, and Milvexian. The diagram differentiates between resting and activated platelets and includes an icon for venous thromboembolism featuring pulmonary embolism and deep vein thrombosis. Dark brown arrows indicate pathways unaffected by FXI inhibition, while lighter grey arrows signify the attenuated thrombin formation pathway. This educational material is designed for medical students and clinicians studying hematology, pharmacology, and cardiovascular medicine.
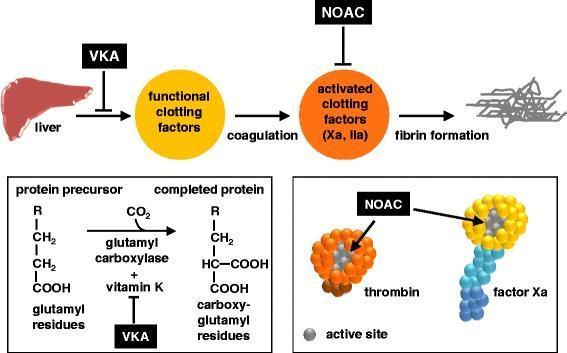
A multi-panel pathophysiology diagram illustrating the mechanism of action of oral anticoagulants on the coagulation cascade. The top panel shows a linear pathway: the liver produces functional clotting factors, which undergo coagulation to become activated clotting factors (Xa and IIa/thrombin), ultimately leading to fibrin formation. Vitamin K antagonists (VKA) are shown inhibiting the liver's production of functional factors, while non-vitamin K antagonist oral anticoagulants (NOACs) inhibit the activated factors. The bottom-left panel details the biochemical mechanism of VKAs, showing they inhibit the glutamyl carboxylase and vitamin K-dependent conversion of glutamyl residues on protein precursors into carboxy-glutamyl residues on completed clotting proteins. The bottom-right panel provides a molecular-level view of NOAC action, depicting thrombin (orange sphere) and factor Xa (yellow head with blue tail) being inhibited at their respective active sites (indicated by grey coloring). This educational graphic highlights the distinction between indirect synthesis inhibition by VKAs and direct enzymatic inhibition by NOACs/DOACs.
leg compartments anatomy muscles diagram
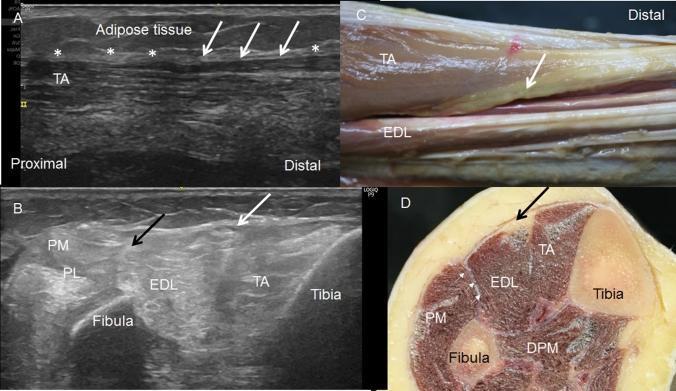
Educational multi-panel figure demonstrating the musculoskeletal anatomy of the anterior and lateral leg compartments through ultrasound and cadaveric correlation. Panel A shows a long-axis ultrasound view of the tibialis anterior (TA) muscle at its origin from the crural fascia (marked by asterisks), highlighting a hypoechogenic area (arrows) corresponding to adipose tissue. Panel B presents a short-axis ultrasound at the middle third of the leg, identifying the tibialis anterior (TA), extensor digitorum longus (EDL), and peroneus longus (PL) muscles, with the tibia and fibula as primary osseous landmarks. A hypoechogenic region (white arrow) separates the TA and EDL, while a septum (black arrow) divides the EDL from the PL. Panels C and D provide gross anatomical correlation, including a longitudinal dissection and a transverse cross-section, respectively. These confirm the presence of adipose tissue (arrows) between the TA and EDL and the fascial septa separating the anterior, lateral (PM), and deep posterior muscle (DPM) compartments.
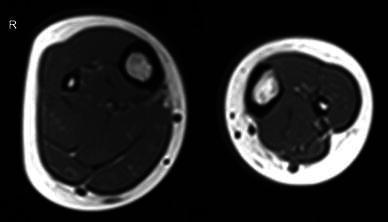
This diagnostic image is an axial T1-weighted spin-echo MRI sequence (TE-11, TR-656) through the proximal segment of the lower limbs, presenting a comparative view of muscle compartment anatomy. The right leg (marked 'R') displays a normal anatomical distribution of the superficial and deep posterior muscle compartments. In contrast, the left leg demonstrates a congenital absence of the majority of the superficial posterior compartment, specifically the medial gastrocnemius and soleus muscles. A small, atrophied lateral gastrocnemius is the only visible remnant of this compartment. To compensate for the absent musculature, there is visible hypertrophy of the deep posterior compartment and the peroneal compartment muscles on the left side. This image illustrates developmental musculoskeletal anomalies and secondary compensatory muscular changes, relevant for clinical education in orthopedics, radiology, and congenital disorders.
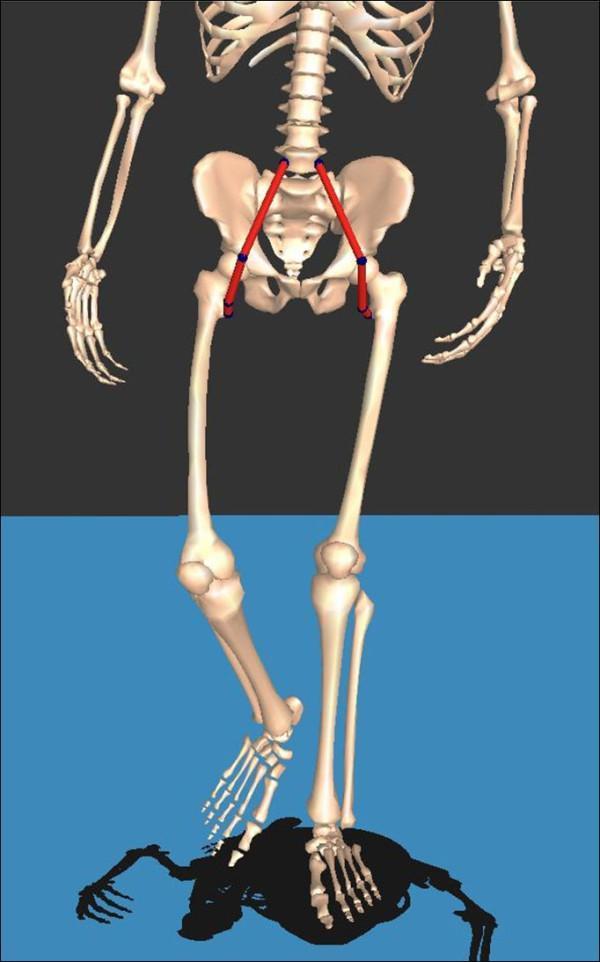
This musculoskeletal diagram features a 3D anatomical model of the human skeleton from an anterior view, illustrating the biomechanics of the psoas muscles during gait. The model is shown in mid-stride: the left leg is in the stance phase (straight and planted), while the right leg is in the swing phase (flexed at the hip and knee with dorsiflexion of the foot). The psoas major muscles are represented by bilateral red vector lines. Each muscle path is defined by three blue markers: the origin at the transverse processes of the lumbar spine (L5 region), a mid-path 'via point' at the pelvic brim (iliopectineal eminence), and the insertion at the lesser trochanter of the femur. This visualization highlights the dynamic changes in muscle length and the relationship between the lumbar spine, pelvis, and femur during locomotion. The image is designed for orthopedic and physical therapy education, specifically focusing on kinesiology, muscle modeling, and the functional anatomy of the hip flexors.
platelet plug formation primary haemostasis
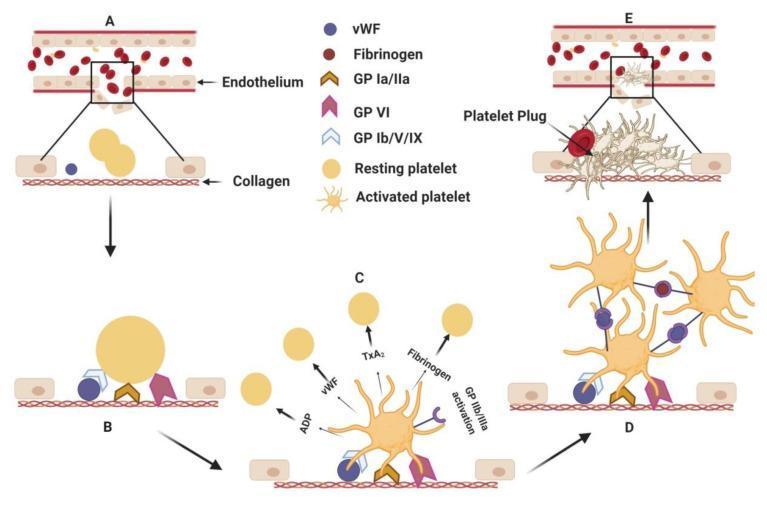
This hematology diagram illustrates the multistep pathophysiology of primary hemostasis following endothelial injury. The process is divided into five sequential stages (A–E). (A) Endothelial disruption exposes subendothelial collagen. (B) Platelet adhesion occurs as resting platelets (smooth, discoid) bind to collagen via surface glycoprotein receptors GP Ia/IIa, GP VI, and GP Ib/V/IX mediated by von Willebrand factor (vWF). (C) Platelet activation results in a dramatic morphological transformation, with platelets developing multiple cytoplasmic pseudopodia (starburst shape). This stage shows the release of granular contents including ADP, TxA2, vWF, and fibrinogen, which recruit additional platelets. (D) Platelet aggregation is shown, where activated GP IIb/IIIa receptors form cross-links between adjacent platelets using vWF and fibrinogen as molecular bridges. (E) The sequence concludes with the formation of a stable platelet plug at the injury site, effectively sealing the vascular breach. This educational visual explains the cellular signaling and mechanical interactions required for initial thrombus formation.
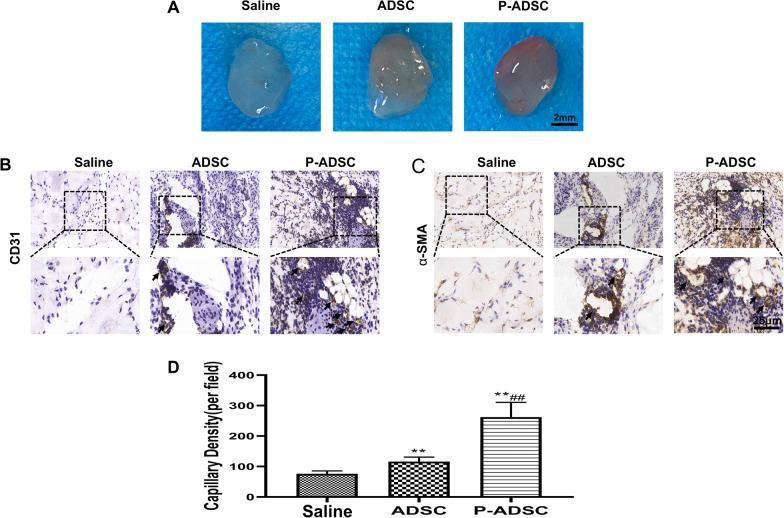
A multi-panel figure illustrating the results of a Matrigel plug assay investigating angiogenesis. Panel A shows macroscopic clinical photographs of harvested Matrigel plugs from three groups: Saline (clear/translucent), ADSC (adipose-derived stem cells, slightly opaque), and P-ADSC (platelet extracellular vesicle-preconditioned ADSCs, noticeably reddish/pink). Panels B and C present immunohistochemical (IHC) staining of plug sections for CD31 (endothelial marker) and alpha-smooth muscle actin (alpha-SMA, pericyte/mature vessel marker), respectively. The P-ADSC group exhibits the highest density of brown chromogen staining, indicating increased vessel formation. Each IHC panel includes high-magnification insets highlighting specific vascular structures. Panel D provides a quantitative bar graph of capillary density per field, statistically demonstrating that P-ADSCs significantly enhance angiogenesis compared to saline (**p < 0.01) and standard ADSCs (##p < 0.01). This content demonstrates the proangiogenic potential of preconditioned stem cells in regenerative medicine applications.
wound healing stages inflammation proliferation
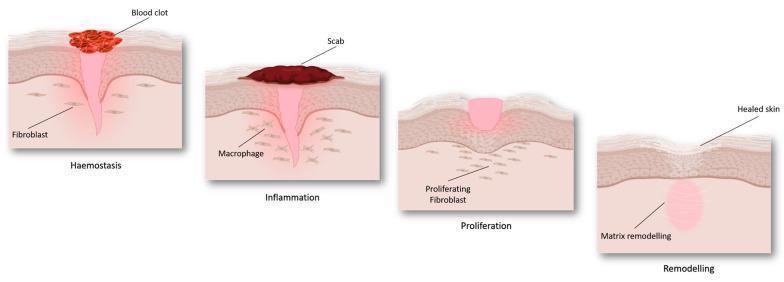
An anatomical pathophysiology diagram illustrating the four sequential stages of cutaneous wound healing: haemostasis, inflammation, proliferation, and remodeling. The illustration depicts a cross-section of the skin layers (epidermis and dermis). During 'Haemostasis', a red blood clot forms on the surface above a funnel-shaped injury, with fibroblasts visible in the surrounding dermis. In the 'Inflammation' stage, a dark-colored scab replaces the initial clot, and macrophages are identified in the underlying tissue. The 'Proliferation' stage demonstrates the formation of pinkish granulation tissue filling the wound gap, accompanied by 'proliferating fibroblasts' migrating into the site. Finally, the 'Remodeling' stage shows 'healed skin' with a restored epidermal surface and an underlying zone of 'matrix remodeling' replacing the previous injury site. The diagram serves as an educational summary of tissue repair mechanisms and cellular involvement at different phases of recovery.
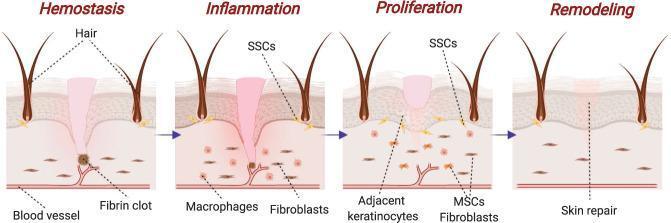
A pathophysiology diagram illustrating the four chronological stages of skin wound healing: Hemostasis, Inflammation, Proliferation, and Remodeling. The visual depicts a cross-section of the integumentary system including the epidermis, dermis, hair follicles, and vasculature. 1) Hemostasis: Shows a fibrin clot formation at the site of vascular injury to stop bleeding. 2) Inflammation: Characterized by the presence of macrophages for phagocytosis and fibroblasts beginning to migrate into the wound site; skin stem cells (SSCs) are indicated near the hair follicles. 3) Proliferation: Displays the migration and activity of adjacent keratinocytes, mesenchymal stem cells (MSCs), and fibroblasts to form a provisional extracellular matrix. 4) Remodeling: Demonstrates the final 'skin repair' phase where tissue integrity is restored, collagen fibers are realigned, and the wound site is closed. This diagram serves as an educational tool for medical students to understand the cellular and structural progression of cutaneous tissue repair.
📋 Blood Module 1.07 - Complete Study Guide Answers
🦴 STUDY GUIDE 1 - Anatomy of the Leg and Foot
1. Bones of the Leg
- Tibia - the big, weight-bearing bone. You can feel its sharp edge (shin) under the skin. It has a medial malleolus at the bottom.
- Fibula - the thin, lateral bone. It does NOT bear weight significantly, but forms the lateral malleolus at the ankle. It's mainly for muscle attachment and ankle stability.
| Group | Bones |
|---|---|
| Tarsals (7) | Calcaneus (heel), Talus, Navicular, Cuboid, 3x Cuneiforms |
| Metatarsals (5) | The long bones of the foot |
| Phalanges (14) | Toes (2 in big toe, 3 in each other) |
2. The 3 Compartments of the Leg
Anterior Compartment (FRONT of leg)
- Main muscles: Tibialis anterior, Extensor digitorum longus, Extensor hallucis longus, Peroneus tertius
- Action: Dorsiflexion of foot (pulling toes up), toe extension
- Nerve: Deep peroneal (fibular) nerve
- Blood supply: Anterior tibial artery
Lateral Compartment (OUTSIDE of leg)
- Main muscles: Peroneus (fibularis) longus and brevis
- Action: Eversion of foot (turning sole outward)
- Nerve: Superficial peroneal (fibular) nerve
- Blood supply: Peroneal artery
Posterior Compartment (BACK of leg) - divided into superficial and deep
- Superficial: Gastrocnemius, Soleus, Plantaris
- Action: Plantar flexion (pointing toes down, like pushing a car pedal)
- This is the "calf"
- Deep: Tibialis posterior, Flexor digitorum longus, Flexor hallucis longus
- Action: Inversion of foot (turning sole inward), toe flexion
- Nerve: Tibial nerve
- Blood supply: Posterior tibial artery + Peroneal artery
"Anterior = Dorsiflexion | Lateral = Eversion | Posterior = Plantarflexion + Inversion"
3. Movements of the Foot - Summary Table
| Movement | Definition | Main Muscles |
|---|---|---|
| Dorsiflexion | Pull foot/toes UP | Tibialis anterior, EDL, EHL |
| Plantar flexion | Point foot DOWN | Gastrocnemius, Soleus |
| Eversion | Sole faces OUT (lateral) | Peroneus longus & brevis |
| Inversion | Sole faces IN (medial) | Tibialis posterior, Tibialis anterior |
4. Blood Supply of the Leg
- Anterior tibial artery → becomes the dorsalis pedis on the top of the foot
- Posterior tibial artery → runs behind the medial malleolus → divides into medial & lateral plantar arteries in the sole
- Peroneal (fibular) artery → supplies lateral compartment
5. Major Nerves
| Nerve | Where it goes | What it does |
|---|---|---|
| Sciatic nerve | Back of thigh → splits into... | Parent nerve |
| Tibial nerve | Posterior leg | Motor: posterior compartment; Sensory: sole |
| Common peroneal nerve | Wraps around fibula head (vulnerable to injury!) | Splits into superficial + deep |
| Superficial peroneal | Lateral compartment | Motor: evertors; Sensory: dorsum of foot |
| Deep peroneal | Anterior compartment | Motor: dorsiflexors; Sensory: 1st web space |
| Saphenous nerve | Medial leg | Sensory only (medial leg + foot) |
6. Knee Joint Anatomy
- Articular surfaces: Distal femur (2 condyles) + Proximal tibia (tibial plateau) + Patella (patellofemoral joint)
- Menisci: Fibrocartilage C-shaped pads (medial = less mobile, lateral = more mobile). Function: shock absorbers, deepen the joint, spread synovial fluid
- Ligaments:
- ACL (anterior cruciate) - prevents tibia sliding forward
- PCL (posterior cruciate) - prevents tibia sliding backward
- MCL (medial collateral) - resists valgus stress
- LCL (lateral collateral) - resists varus stress
- Muscles crossing the knee:
- Flexors: Hamstrings (biceps femoris, semimembranosus, semitendinosus), Gastrocnemius, Popliteus
- Extensors: Quadriceps (via patellar tendon)
🩸 STUDY GUIDE 2 - How Does Bleeding Normally Stop? (Haemostasis)
What is Haemostasis?
Injury → Vasoconstriction → Platelet plug (primary) → Coagulation (secondary) → Fibrin clot
Step 1: Vasoconstriction (Vasospasm)
- Reflex nervous response
- Local chemicals released from damaged cells (endothelin, thromboxane A2)
Step 2: Primary Haemostasis - The Platelet Plug
- Adhesion - Platelets stick to collagen via von Willebrand factor (vWF) using the GP Ib/V/IX receptor
- Activation - Platelets change shape (sprout little arms called pseudopods) and release granules:
- Alpha granules: growth factors (TGF-β, PDGF, VEGF), fibrinogen, vWF
- Dense granules: ADP, ATP, serotonin, calcium
- Aggregation - Released ADP and TXA2 recruit more platelets. They bind to each other via GP IIb/IIIa receptor using fibrinogen as a bridge → forms the platelet plug
Step 3: Secondary Haemostasis - The Coagulation Cascade
The 3 Pathways:
- Triggered by tissue factor (TF) released when vessel is cut
- TF + Factor VII → Factor VIIa
- This activates Factor X
- Triggered by contact with collagen (Factor XII activation)
- XII → XI → IX → VIII (with calcium and phospholipid)
- This also activates Factor X
- Factor Xa + Va → converts Prothrombin (II) → Thrombin (IIa)
- Thrombin converts Fibrinogen → Fibrin
- Factor XIIIa cross-links fibrin → stable clot
Step 4: Clot Retraction and Fibrinolysis
- Clot retraction: Platelets contain actin/myosin. They contract, pulling wound edges together and squeezing serum out. This makes the clot firm.
- Fibrinolysis: Once healing is complete, plasmin (activated from plasminogen by tPA) digests the fibrin clot. This prevents the clot from growing too large.
Natural Anticoagulants (to stop clotting getting out of control)
| Anticoagulant | Mechanism |
|---|---|
| Antithrombin III | Inhibits thrombin and Factor Xa |
| Protein C & S | Inactivate Factors Va and VIIIa |
| Tissue factor pathway inhibitor (TFPI) | Blocks TF/VIIa complex |
| Prostacyclin (PGI2) | Released by healthy endothelium; inhibits platelet aggregation |
❌ STUDY GUIDE 3 - What Causes Abnormal Bleeding and Clotting?
Types of Haemorrhage
| Type | Source | Appearance |
|---|---|---|
| Arterial | Artery | Bright red, spurting, pulsatile - HIGH pressure |
| Venous | Vein | Dark red, steady ooze - lower pressure |
| Capillary | Capillaries | Slow ooze, usually stops on its own |
Causes of Abnormal Bleeding
A. Blood Vessel Wall Abnormality
- Vasculitis (inflammation of vessels)
- Connective tissue disorders (e.g., Ehlers-Danlos syndrome) - weak vessel walls
- Scurvy (Vitamin C deficiency) - poor collagen synthesis
B. Platelet Abnormalities
-
Inadequate numbers (Thrombocytopenia) - platelet count < 150,000/µL
- Causes: decreased production (bone marrow failure), increased destruction (ITP, heparin-induced), splenic sequestration
- Bleeding risk rises significantly below 50,000; spontaneous bleeding below 20,000
-
Deficient platelet factors - e.g., Bernard-Soulier syndrome (no GP Ib), Glanzmann thrombasthenia (no GP IIb/IIIa)
-
Drugs interfering with function:
- Aspirin - irreversibly blocks COX, reducing TXA2 production
- Clopidogrel - blocks ADP receptor (P2Y12)
- NSAIDs - reversible COX inhibition
C. Clotting Factor Abnormalities
-
Inadequate production:
- Vitamin K deficiency: Factors II, VII, IX, X are vitamin K-dependent. Deficiency from poor diet, malabsorption, warfarin therapy, or newborns (no gut flora) - prolonged PT/INR
- Liver disease: Liver makes almost all clotting factors. Severe liver failure = inability to clot + risk of major bleeding
-
Inherited genetic abnormalities:
- Haemophilia A: Factor VIII deficiency (X-linked recessive - affects males)
- Haemophilia B: Factor IX deficiency (also X-linked)
- von Willebrand disease: Most common inherited bleeding disorder - reduced/abnormal vWF
Abnormal Clotting (Hypercoagulable States / Thrombophilia)
- Stasis (slow blood flow) - e.g., immobility, heart failure
- Endothelial damage - e.g., trauma, atherosclerosis, surgery
- Hypercoagulability - e.g., inherited (Factor V Leiden, protein C deficiency) or acquired (cancer, pregnancy, OCP use)
- Factor V Leiden mutation (most common inherited thrombophilia)
- Protein C or Protein S deficiency
- Antithrombin III deficiency
- Antiphospholipid syndrome (acquired)
- Used to PREVENT or TREAT abnormal clots (DVT, PE, stroke, AF)
- Heparin - activates antithrombin III; given IV/SC; fast acting; used in hospital
- Warfarin - inhibits Vitamin K-dependent factors; oral; slow onset; monitored by INR
- DOACs (rivaroxaban, apixaban, dabigatran) - directly inhibit Factor Xa or thrombin; predictable dosing, no routine monitoring needed
🥗 STUDY GUIDE 4 - Nutrition in Wound Healing and Recovery
Why Nutrition Matters
- Inflammation (immune response)
- New tissue synthesis (collagen, cells)
- Immune function (fighting infection)
Key Nutrients and Their Roles
| Nutrient | Role in Wound Healing |
|---|---|
| Protein | Collagen synthesis, immune cells (antibodies), tissue repair. Deficiency = poor wound healing, pressure sores |
| Carbohydrates | Primary energy source. Without energy, protein gets "burned" as fuel instead of used for repair |
| Vitamin A | Stimulates fibroblast proliferation and collagen synthesis. Promotes epithelial cell growth. Deficiency = impaired healing |
| Vitamin C | Needed for collagen hydroxylation (collagen won't hold together without it). Also an antioxidant. Deficiency (scurvy) = wounds that won't heal, capillary fragility |
| Vitamin D | Immune modulation, anti-inflammatory. Deficiency linked to impaired immune response |
| Iron | Needed for oxygen transport (haemoglobin) AND collagen synthesis (hydroxylation step requires Fe²⁺) |
| Zinc | Co-factor for many enzymes in DNA synthesis and protein synthesis. Deficiency = delayed wound healing, impaired immune function |
In Malnutrition
- Low protein → can't make new collagen or mount an immune response
- Low vitamins → enzymatic pathways for tissue repair break down
- Low calorie intake → body catabolises muscle for energy
🩹 STUDY GUIDE 5 - Principles of Wound Management
Types of Wounds
| Type | Description |
|---|---|
| Incision | Clean cut (e.g., surgical knife) - straight edges, heals well |
| Laceration | Torn/jagged wound - Rivai's wound! Irregular edges |
| Abrasion | Superficial scrape - loss of epidermis |
| Excoriation | Scratch removing superficial skin |
| Avulsion/Degloving | Full-thickness skin torn away from underlying tissue |
| Puncture | Small entry point, deep track (e.g., nail) |
- Haematoma - blood collects in tissue
- Contusion/Ecchymosis - bruise - tissue damage without skin break
- Crush injury - massive force compresses tissue
Assessing a Wound - What to Consider
- Location - over a joint? Near a nerve/vessel?
- Force of injury - Low impact vs high impact (high = more deep tissue damage)
- Type of force - sharp cut vs blunt/crush
- Size - length, width, depth
- Blood loss - how much?
- Contamination - dirty wound? Risk of infection/tetanus
- Deeper structures involved - tendon? Bone? Nerve?
- Time since injury - wounds > 6-8 hours old are contaminated and not suitable for primary closure
- Open fracture? - bone communicating with the outside = surgical emergency
Wound Closure - The 3 Options
| Method | When to Use |
|---|---|
| Primary closure | Clean wound, < 6-8 hours old, no significant contamination, minimal tension. Sutures, staples, or glue used immediately |
| Delayed primary closure | Contaminated wound that needs cleaning first. Leave open 3-5 days, then close when clean |
| Secondary closure | Highly contaminated wounds or large tissue loss. Leave open and let it heal by granulation from the inside out (takes weeks but safer) |
Principles of Wound Management
- Thorough washing with normal saline under pressure
- Removes debris, bacteria, foreign material
- Most important step in preventing infection
- Removal of dead (necrotic), contaminated, or damaged tissue
- You can't heal over dead tissue - it will become infected
- Sharp debridement (surgical) or enzymatic
- Protects wound from further contamination
- Maintains moist environment (speeds healing)
- Absorbs exudate
- Types: simple gauze, hydrocolloid, foam, alginate (for heavy exudate)
- Tetanus prophylaxis for contaminated wounds
- Antibiotics if infected or high-risk
- Pain management
- Elevation to reduce swelling
🔑 Quick Big Picture Summary
Rivai cuts his leg
↓
Guide 1: ANATOMY - understand what structures are at risk
(vessels, nerves, muscles, compartments)
↓
Guide 2: HAEMOSTASIS - his body immediately starts stopping the bleeding
(vasoconstriction → platelet plug → coagulation cascade → fibrin clot)
↓
Guide 3: ABNORMAL BLEEDING - if clotting fails (haemophilia, warfarin, liver disease)
or if abnormal clotting develops (DVT post-injury due to Virchow's triad)
↓
Guide 4: NUTRITION - adequate protein, Vitamin C, zinc, iron needed to heal the wound
↓
Guide 5: WOUND MANAGEMENT - clean, debride, close (primary/secondary), dress