
Generate images for graphs of AP of skeletal muscle, smooth muscle, nerves and cardiac muscle with all informations
Generate images for graphs of AP of skeletal muscle, smooth muscle, nerves and cardiac muscle with all informations
A physiology textbook style line graph showing the action potential of skeletal muscle fiber. X-axis labeled "Time (milliseconds)" ranging 0 to 5 ms, Y-axis labeled "Membrane Potential (mV)" ranging from -90 mV to +30 mV. The curve starts at a resting membrane potential clearly labeled "-90 mV (Resting Membrane Potential)", shows a sharp rapid depolarization spike labeled "Depolarization: rapid Na+ influx through voltage-gated Na+ channels" rising to about +20 to +30 mV labeled "Peak/Overshoot", followed by a fast repolarization phase labeled "Repolarization: K+ efflux, Na+ channel inactivation" returning quickly back down to resting potential, with a small labeled "brief hyperpolarization (undershoot)" dip below resting level before returning to baseline. Total duration label "Duration: 2-5 milliseconds, no plateau". Include a small side annotation box listing: Threshold approximately -55 mV, All-or-none spike potential, Absolute refractory period, triggers excitation-contraction coupling via T-tubules and sarcoplasmic reticulum Ca2+ release. Clean scientific medical diagram, labeled axes, grid lines, annotated curve with arrows pointing to each phase, white background, textbook illustration style.
A physiology textbook style line graph showing the action potential of smooth muscle (unitary/visceral type). X-axis labeled "Time (seconds)", Y-axis labeled "Membrane Potential (mV)" ranging from -60 mV to +10 mV. Show a slow wavy baseline labeled "Slow Wave Potentials (pacemaker potentials, rhythmic fluctuations from Interstitial Cells of Cajal)" oscillating gradually, with several spike action potentials riding on top of the slow waves when depolarization crosses threshold, each spike labeled "Spike action potential: Ca2+ influx through voltage-gated Ca2+ channels (slower than Na+ channels), duration 10-50 milliseconds". Label resting potential around "-50 to -60 mV (unstable, fluctuating resting potential)". Include annotation box listing: no true stable resting potential, spikes generated by calcium channels not sodium channels, longer duration than skeletal muscle or nerve, can be graded/modulated by hormones and stretch, found in GI tract, ureter, uterus, small blood vessels. Clean scientific medical diagram, labeled axes, grid lines, annotated curve with arrows, white background, textbook illustration style.
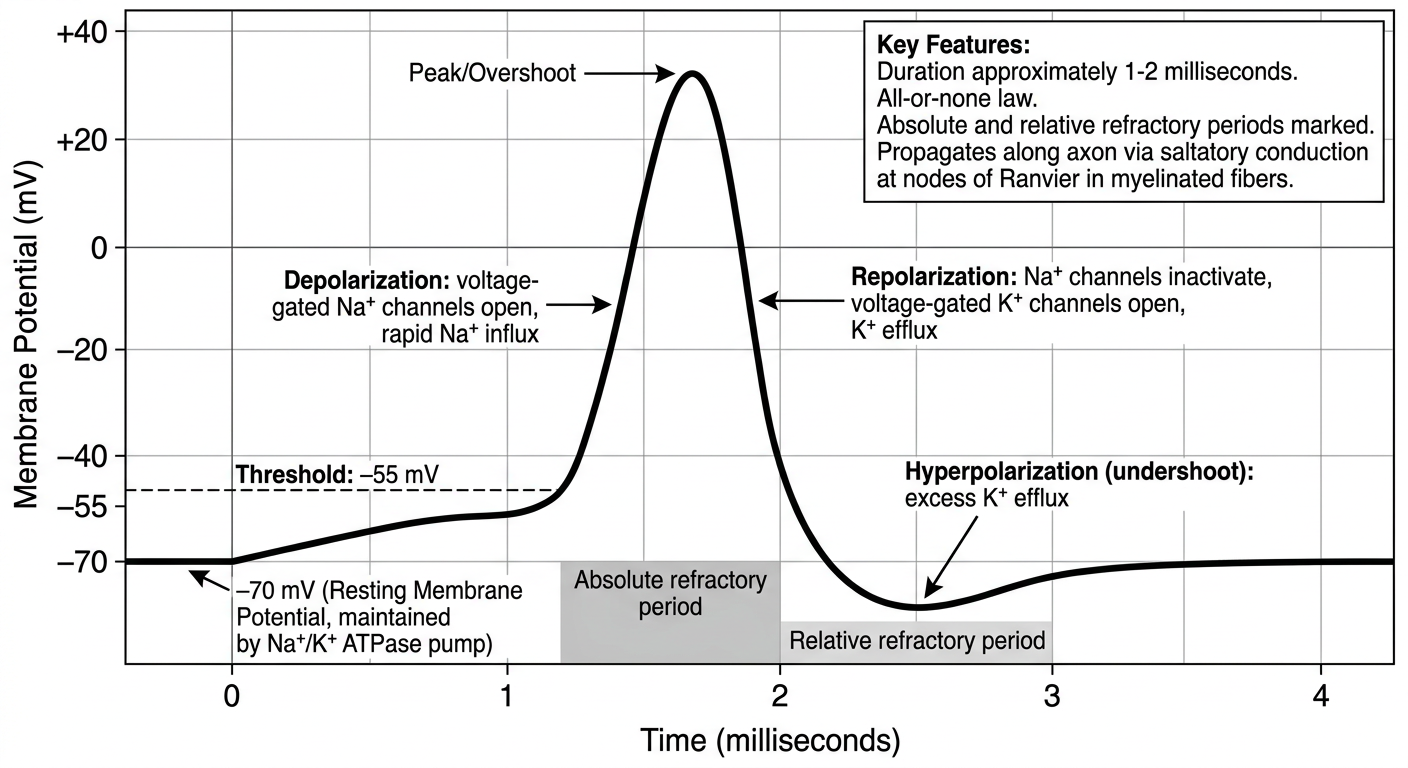
A physiology textbook style line graph showing the action potential of a nerve fiber (neuron axon). X-axis labeled "Time (milliseconds)" ranging 0 to 4 ms, Y-axis labeled "Membrane Potential (mV)" ranging from -70 mV to +40 mV. Curve starts at resting membrane potential labeled "-70 mV (Resting Membrane Potential, maintained by Na+/K+ ATPase pump)", then a labeled "Threshold: -55 mV" marker, followed by rapid depolarization phase labeled "Depolarization: voltage-gated Na+ channels open, rapid Na+ influx" rising steeply to about +30 to +40 mV labeled "Peak/Overshoot", then repolarization phase labeled "Repolarization: Na+ channels inactivate, voltage-gated K+ channels open, K+ efflux" falling back down, followed by a labeled "Hyperpolarization (undershoot): excess K+ efflux" dip slightly below resting potential before returning to baseline. Include annotation box listing: Duration approximately 1-2 milliseconds, All-or-none law, Absolute and relative refractory periods marked, propagates along axon via saltatory conduction at nodes of Ranvier in myelinated fibers. Clean scientific medical diagram, labeled axes, grid lines, annotated curve with arrows pointing to each labeled phase, white background, textbook illustration style.
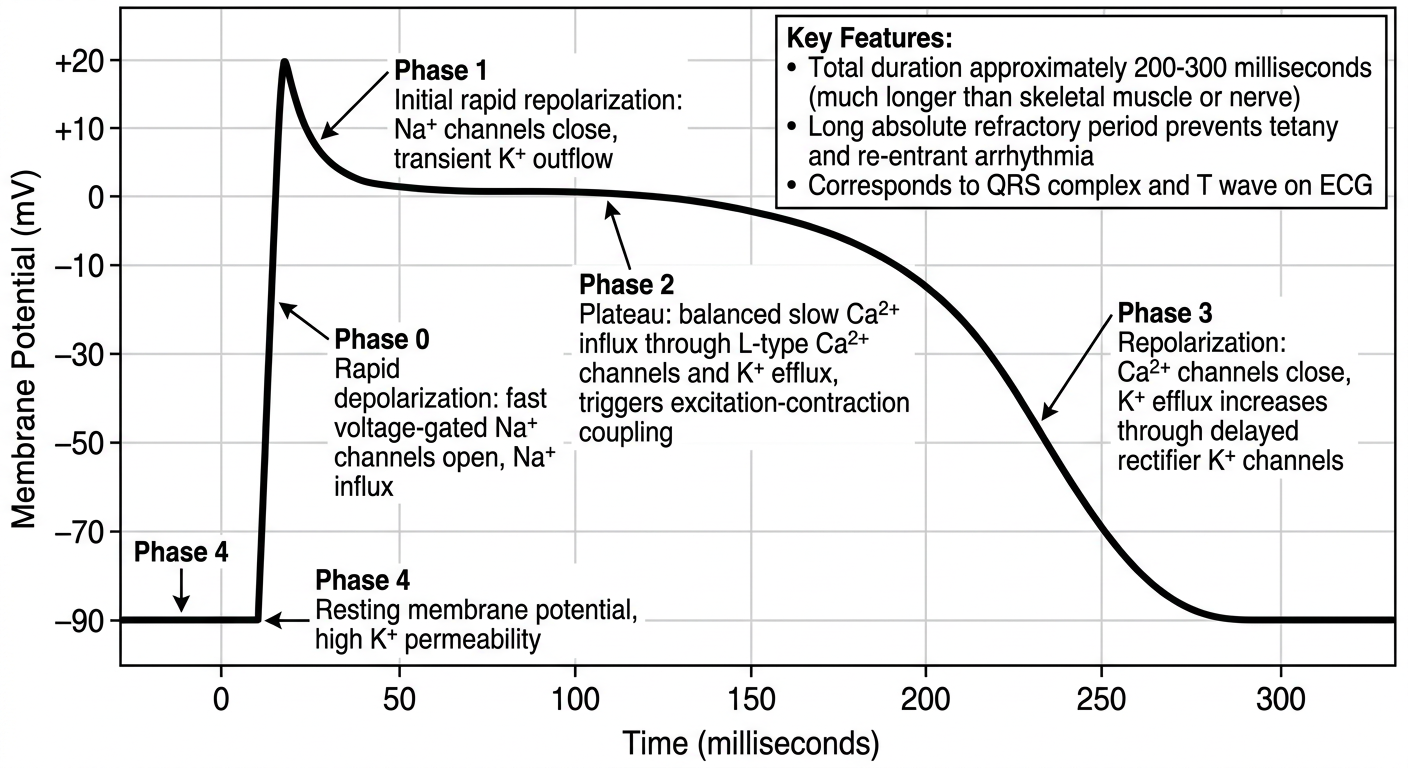
A physiology textbook style line graph showing the cardiac muscle action potential (ventricular myocyte) with five numbered phases 0 through 4. X-axis labeled "Time (milliseconds)" ranging 0 to 300 ms, Y-axis labeled "Membrane Potential (mV)" ranging from -90 mV to +20 mV. Show: "Phase 4" flat resting potential at -90 mV labeled "Resting membrane potential, high K+ permeability"; "Phase 0" a very rapid steep upstroke to about +20 mV labeled "Rapid depolarization: fast voltage-gated Na+ channels open, Na+ influx"; "Phase 1" a brief slight downward notch labeled "Initial rapid repolarization: Na+ channels close, transient K+ outflow"; "Phase 2" a long flat plateau around 0 to +10 mV lasting roughly 200 milliseconds labeled "Plateau: balanced slow Ca2+ influx through L-type Ca2+ channels and K+ efflux, triggers excitation-contraction coupling"; "Phase 3" a steady downward slope back to resting potential labeled "Repolarization: Ca2+ channels close, K+ efflux increases through delayed rectifier K+ channels". Include annotation box listing: total duration approximately 200-300 milliseconds (much longer than skeletal muscle or nerve), long absolute refractory period prevents tetany and re-entrant arrhythmia, corresponds to QRS complex and T wave on ECG. Clean scientific medical diagram, clearly labeled numbered phases with arrows, grid lines, white background, textbook illustration style similar to Guyton and Hall physiology figures.
Quick answer
- Resting membrane potential: -90 mV
- Threshold: ~-55 mV, triggered by acetylcholine at the neuromuscular junction
- Rapid depolarization from Na+ influx (voltage-gated Na+ channels), overshoot to +20/+30 mV
- Fast repolarization from K+ efflux and Na+ channel inactivation, with a brief after-hyperpolarization
- Duration: 2-5 ms, no plateau, all-or-none, triggers excitation-contraction coupling via T-tubules
- Unstable resting potential (-50 to -60 mV) with slow wave (pacemaker) potentials generated by interstitial cells of Cajal
- Spike potentials fire when slow waves cross threshold, driven mainly by Ca2+ influx (not Na+), so they are slower (10-50 ms)
- Graded, can be modulated by stretch, hormones, and autonomic input
- Found in GI tract, ureter, uterus, and vascular smooth muscle
- Resting potential: -70 mV, threshold: -55 mV
- Rapid depolarization via voltage-gated Na+ channels, overshoot to +30/+40 mV
- Repolarization via K+ efflux as Na+ channels inactivate and K+ channels open
- Brief after-hyperpolarization (undershoot)
- Duration: ~1-2 ms; propagates via saltatory conduction at nodes of Ranvier in myelinated fibers; obeys all-or-none law with absolute/relative refractory periods
- Phase 4: resting potential -90 mV
- Phase 0: rapid depolarization (fast Na+ channels), spike to +20 mV
- Phase 1: initial rapid repolarization (transient K+ outflow, Na+ channel closure)
- Phase 2: plateau (~200 ms) from balanced slow Ca2+ influx (L-type channels) and K+ efflux - this is what drives excitation-contraction coupling and corresponds to the ST segment on ECG
- Phase 3: repolarization as Ca2+ channels close and K+ efflux increases
- Total duration ~200-300 ms, far longer than nerve/skeletal muscle, producing a long refractory period that prevents tetany and re-entrant arrhythmias