
Propofol
propofol mechanism of action anesthesia
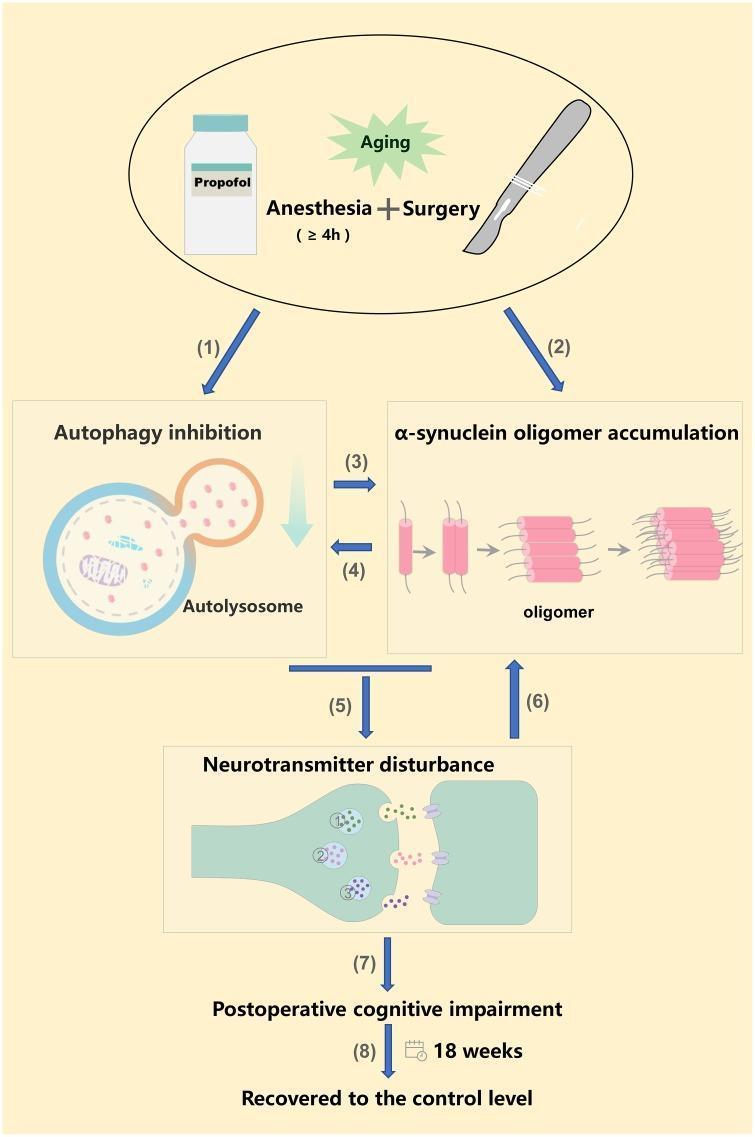
This pathophysiology diagram illustrates a proposed mechanism for Postoperative Cognitive Impairment (POCD) in the context of aging. The entry point shows a combination of long-term propofol anesthesia (≥ 4h) and surgery acting as triggers. The pathway branches into two concurrent pathological processes: (1) Autophagy inhibition, visualized by an inhibited autolysosome structure, and (2) α-synuclein oligomer accumulation. These two processes exhibit a positive feedback loop (steps 3 and 4), where autophagy failure promotes oligomerization and vice versa. These hippocampal cellular dysfunctions lead to (5) Neurotransmitter disturbance, depicted at a synaptic cleft with imbalances in (1) Norepinephrine, (2) Dopamine, and (3) 5-hydroxytryptamine (serotonin). This synaptic instability further exacerbates α-synuclein aggregation (6), ultimately resulting in (7) Postoperative cognitive impairment. A final timeline (8) indicates a progression toward recovery at 18 weeks post-intervention. The diagram serves as an educational tool for understanding neurodegenerative-like mechanisms in geriatric anesthesia and perioperative medicine.
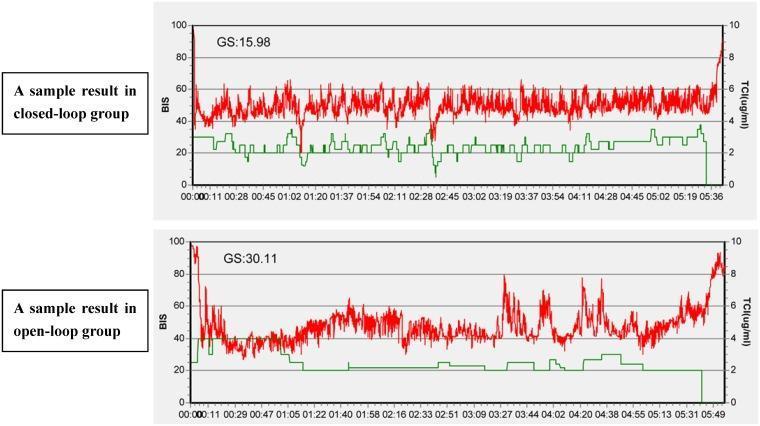
This medical comparison chart illustrates the trends of Bispectral Index (BIS) and target-controlled infusion (TCI) of propofol during anesthesia in two different clinical groups: closed-loop and open-loop systems. The visual content consists of two time-series graphs with time on the x-axis, BIS values (0-100) on the left y-axis, and propofol concentration (μg/ml) on the right y-axis. The red line represents the BIS trend, while the green line indicates the calculated propofol target concentration. In the closed-loop group (top graph, GS=15.98), the BIS values demonstrate greater stability, fluctuating within a narrow target range of 40-60 throughout the induction and maintenance phases. The propofol concentration shows frequent, small adjustments, suggesting responsive automated titration. In contrast, the open-loop group (bottom graph, GS=30.11) exhibits larger oscillations in BIS values and less frequent propofol dosage adjustments, characterized by longer periods of steady-state infusion despite BIS drift. This comparison highlights the efficiency of closed-loop anesthetic delivery in maintaining a consistent depth of anesthesia and reducing glycemic variability or hemodynamic instability associated with over- or under-sedation.
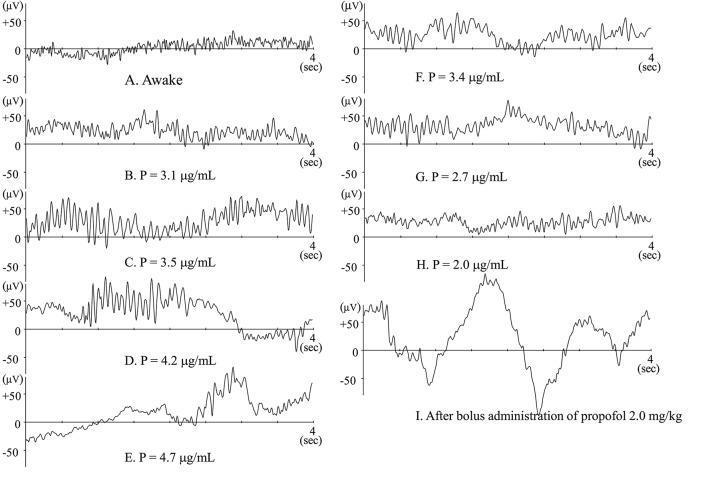
A multi-panel series of raw electroencephalogram (EEG) tracings illustrating changes in brainwave morphology during propofol anesthesia induction, maintenance, and recovery. Panels A–E demonstrate the progression from an 'Awake' state—characterized by low-amplitude, high-frequency activity—to deep anesthesia at increasing effect-site concentrations (P) ranging from 3.1 to 4.7 µg/mL. As concentration increases, the EEG shows a clear transition from fast beta/gamma activity to high-amplitude alpha spindles (Panel C) and finally to dominant slow-wave theta and delta activity with emerging burst-suppression features (Panel E). Panels F–H show the symmetrical reversal of these patterns during recovery as propofol concentration decreases. Panel I highlights a specific clinical scenario: the immediate post-bolus state (2.0 mg/kg), which displays distinct high-amplitude delta waves and significant frequency slowing, often correlating with low Bispectral Index (BIS) values. The Y-axis for all tracings measures voltage in microvolts (µV) from -50 to +50, and the X-axis represents a 4-second time interval. This educational visual demonstrates the dose-dependent neurophysiological effects of intravenous anesthetics on cortical electrical activity.
propofol pharmacology anesthesia
Propofol
Structure & Formulation
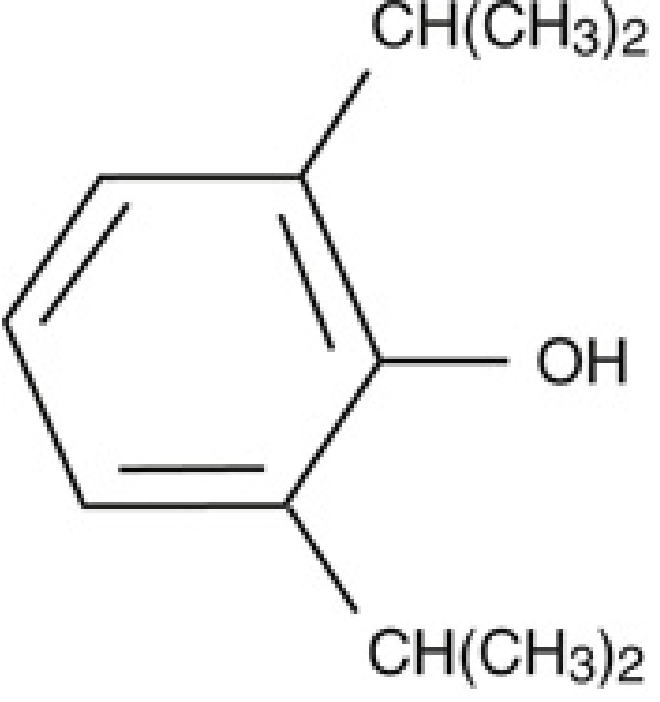
- 1% propofol (active drug)
- 10% soybean oil (vehicle)
- 1.2% purified egg phospholipid (emulsifier)
- 2.25% glycerol (tonicity agent)
- EDTA (bacteriostatic)
- pH 7, milky white appearance
- Miller's Anesthesia, 10e, p. 2458-2459
History
Mechanism of Action
- Blockade of sodium channels
- Modulation of NMDA receptors
- Inhibition of hyperpolarization-activated cyclic nucleotide-gated (HCN1) channels
Pharmacokinetics
| Parameter | Value |
|---|---|
| Initial distribution half-life | 2-8 minutes |
| Slow distribution half-life | 30-70 minutes |
| Elimination half-life | 4-23.5 hours |
| Context-sensitive half-time (8 hr infusion) | <40 minutes |
| Volume of distribution (central) | 6-40 L |
| Volume of distribution (steady-state) | 150-700 L |
| Clearance | >1.5 L/min |
| Protein binding | ~98% |
- Kidneys account for up to 30% of clearance
- Lungs contribute 20-30% first-pass elimination after bolus
- <1% excreted unchanged in urine
- Miller's Anesthesia, 10e, p. 2460-2461
Dosing
| Indication | Dose |
|---|---|
| Induction (healthy adult) | 1.5-2.5 mg/kg IV |
| Induction (elderly/debilitated) | 1-1.5 mg/kg IV (reduced) |
| Maintenance (TIVA) | 100-200 mcg/kg/min (6-12 mg/kg/hr) |
| Sedation (ICU/procedural) | 25-75 mcg/kg/min |
| PRIS-risk threshold | ≥4 mg/kg/hr for ≥48 hours |
Effects on Organ Systems
Central Nervous System
- Produces dose-dependent CNS depression from sedation to general anesthesia
- Decreases cerebral metabolic rate (CMRO2), cerebral blood flow, and ICP - making it useful in neurosurgery
- At high doses causes burst suppression on EEG
- Anticonvulsant properties; also used to terminate refractory status epilepticus
- Antiemetic at sub-anesthetic doses (5-10 mg bolus or infusion at 10-20 mcg/kg/min) - this is one of propofol's distinctive advantages
- Antipruritic effects
- EEG shows progression from beta activity (awake) → alpha spindles → slow-wave delta → burst suppression as dose increases

Cardiovascular System
- Decreases blood pressure - primarily via decreased systemic vascular resistance and, to a lesser extent, negative inotropy and decreased preload
- Reduces myocardial blood flow and oxygen consumption proportionally - the global myocardial oxygen supply-to-demand ratio is likely preserved
- Possible cardioprotective effect via preconditioning (compared to volatile anesthetics - this remains a topic of active debate)
- Heart rate usually unchanged or slightly decreased
Respiratory System
- Potent respiratory depressant - causes dose-dependent reduction in tidal volume and respiratory rate
- Apnea is common after induction doses
- Blunts laryngeal reflexes, facilitating LMA/intubation
- Bronchodilator - useful in asthmatic patients
Other Effects
- No effect on evoked electromyogram or twitch tension
- Does NOT trigger malignant hyperthermia (safe in susceptible patients)
- Produces no significant neuromuscular blockade, but good intubating conditions after propofol alone have been reported
- Has antioxidant properties due to its phenol structure
Advantages
- Rapid, smooth induction and emergence
- Significantly lower incidence of PONV compared to inhalational agents
- Excellent for total IV anesthesia (TIVA) and target-controlled infusion (TCI)
- Antiemetic properties make it useful for high-risk PONV patients
- Clear-headed emergence without "hangover"
- Suitable for day-case/ambulatory surgery
Side Effects and Contraindications
Pain on Injection
- Common (up to 70% without prevention measures)
- Minimized by: IV lidocaine 20-40 mg beforehand, using antecubital vein, mixing lidocaine with propofol, or using a larger vein
Propofol Infusion Syndrome (PRIS)
-
Associated with infusions at ≥4 mg/kg/hr for ≥48 hours, though cases at lower doses exist
-
Clinical features: metabolic acidosis, ECG/conduction abnormalities, rhabdomyolysis, lipemia, renal failure, hepatomegaly
-
Mechanism: impairment of mitochondrial respiratory chain and fatty acid oxidation
-
Particularly dangerous in critically ill patients and children
-
Management: stop propofol, supportive care (may require dialysis, ECMO in severe cases)
-
Miller's Anesthesia, 10e, p. 1322-1323
Other Adverse Effects
- Hypotension (most significant clinical concern)
- Apnea (have airway equipment ready)
- Bradycardia
- Involuntary movements/excitatory phenomena during induction
- Hypertriglyceridemia with prolonged infusion (the emulsion provides ~1.1 kcal/mL)
Contraindications / Cautions
- Egg/soy allergy - relative contraindication (true anaphylaxis rare; allergy to eggs is usually to egg white protein, not lecithin)
- Pediatric ICU sedation - FDA has NOT approved propofol for long-term sedation of children due to PRIS risk
- Pregnancy - FDA (Dec 2016) issued a warning about potential fetal brain developmental effects with prolonged use of general anesthetics including propofol; animal data show concerns with repetitive or prolonged exposure
- Hypovolemia / shock - extreme caution due to hypotension risk
- Patients with disorders of fat metabolism
Clinical Uses
| Setting | Use |
|---|---|
| OR - induction | Most common IV induction agent worldwide |
| OR - maintenance | TIVA, often with remifentanil |
| ICU | Short-term sedation (NOT for long-term pediatric ICU use) |
| Endoscopy/procedural | Monitored anesthesia care, deep sedation |
| Antiemetic | Sub-anesthetic doses for refractory PONV |
| Status epilepticus | Refractory cases |
| Electroconvulsive therapy | Preferred induction agent (attenuates seizure duration) |
Comparison with Remimazolam (Recent Evidence)
- A 2025 meta-analysis (PMID 40503766) found remimazolam has comparable anesthetic efficacy to propofol with a better hemodynamic profile and lower incidence of hypotension
- A 2024 meta-analysis in elderly patients (PMID 39069837) in Eur J Anaesthesiol found remimazolam superior in terms of cardiovascular stability in older patients
- A 2025 systematic review on target-controlled infusion (PMID 40289063) confirmed that TCI propofol remains effective but newer agents may challenge its dominance, particularly in high-risk patients