
Cholinergic ester
cholinergic ester drugs muscarinic receptor mechanism
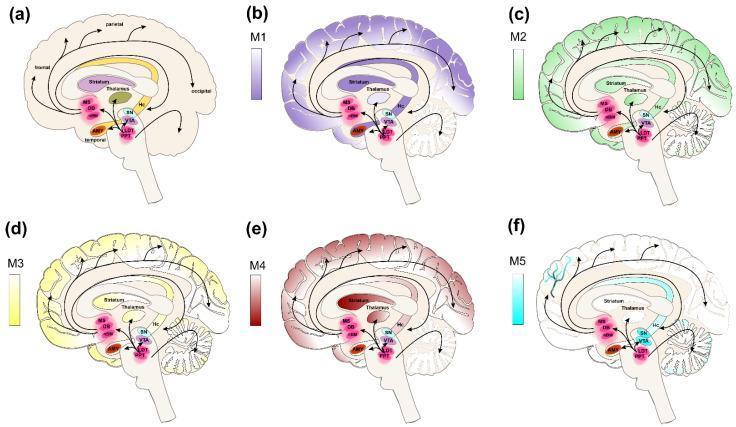
This medical illustration comprises six sagittal-view diagrams of the human brain (a–f) detailing cholinergic pathways and the distribution of muscarinic receptor subtypes (M1–M5). Diagram (a) maps primary cholinergic inputs, illustrating projections from basal forebrain nuclei, including the medial septum (MS), diagonal band of Broca (DB), and nucleus basalis magnocellularis (nBM), toward the neocortex (frontal, parietal, occipital), amygdala (AMY), and hippocampus (Hc). Brainstem cholinergic projections from the pedunculopontine nucleus (PPN) and laterodorsal tegmentum (LDT) are shown targeting the thalamus and basal forebrain. Panels (b) through (f) utilize color-coded heatmaps to indicate the expression density of muscarinic receptor subtypes: M1 (purple) and M2 (green) show high cortical and hippocampal density; M3 (yellow) is localized primarily in the cortex and basal ganglia; M4 (red) exhibits strong expression in the striatum and neocortex; and M5 (cyan) displays more localized expression in the ventral tegmental area and substantia nigra. These diagrams facilitate understanding of cholinergic neurotransmission relevant to neurodegenerative diseases, epilepsy, and schizophrenia.
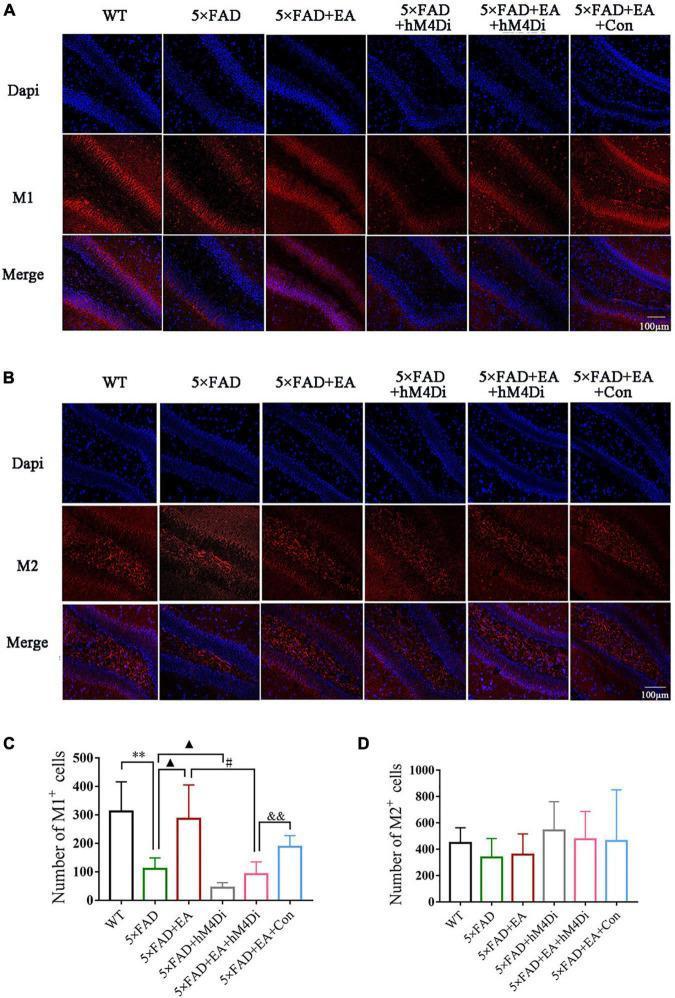
This composite educational graphic illustrates the effects of electro-acupuncture (EA) and MS/VDB-DG cholinergic circuit inhibition on muscarinic receptor expression in a 5xFAD mouse model of Alzheimer's disease. Panels A and B display representative immunofluorescence microscopy images of the hippocampal dentate gyrus (DG). Sections are stained for cell nuclei (DAPI, blue) and muscarinic receptors (M1 in Panel A; M2 in Panel B, red), with merged images provided. Comparisons are made across six groups: Wild-Type (WT), 5xFAD, 5xFAD+EA, and groups utilizing hM4Di DREADDs to inhibit cholinergic circuits. Visually, M1 receptor expression (red) is notably reduced in the 5xFAD group compared to WT, partially restored by EA treatment, and attenuated again following hM4Di-mediated circuit inhibition. In contrast, M2 expression appears more uniform across groups. Panels C and D provide quantitative bar graphs (mean ± SD) supporting these observations, showing statistically significant variations in M1+ cell counts across treatment groups, while M2+ cell counts remain stable. The data suggests that EA modulates cognitive function specifically through the M1 receptor pathway in the DG.
3-MPB binding, reflecting cholinergic receptor density across the same three cohorts. A color-coded Non-displaceable Binding Potential (BPND) scale (0 to 5) indicates receptor availability, where warmer colors (red/orange) represent higher binding. The PET images visually demonstrate a marked reduction in binding intensity and distribution in the CFS(+) group compared to the Control and CFS(-) groups, particularly within the central cortical regions and basal ganglia. This finding suggests a downregulation or blockage of cholinergic receptors associated with specific serum autoantibodies in a subset of CFS patients.](https://cdn.orris.care/cdss_images/pmc_clinical_VQA_bbbb643a84d39d61eb1d0c8b7e5719a6e70a02b133e9cd492f2fd0b7c137d918.jpg)
A composite figure consisting of a scatter plot and representative parametric PET brain images, illustrating research on Chronic Fatigue Syndrome (CFS). (A) A scatter plot displays the Antibody Index against muscarinic cholinergic receptors (mAChR) in serum for three groups: Normal Control (NC), CFS(-) patients, and CFS(+) patients. The CFS(+) group shows significantly higher antibody levels (p < 0.001) compared to NC and CFS(-) groups, with several individuals exceeding the 0.5 cut-off value. (B) Axial PET scan images demonstrate [11C](+)3-MPB binding, reflecting cholinergic receptor density across the same three cohorts. A color-coded Non-displaceable Binding Potential (BPND) scale (0 to 5) indicates receptor availability, where warmer colors (red/orange) represent higher binding. The PET images visually demonstrate a marked reduction in binding intensity and distribution in the CFS(+) group compared to the Control and CFS(-) groups, particularly within the central cortical regions and basal ganglia. This finding suggests a downregulation or blockage of cholinergic receptors associated with specific serum autoantibodies in a subset of CFS patients.
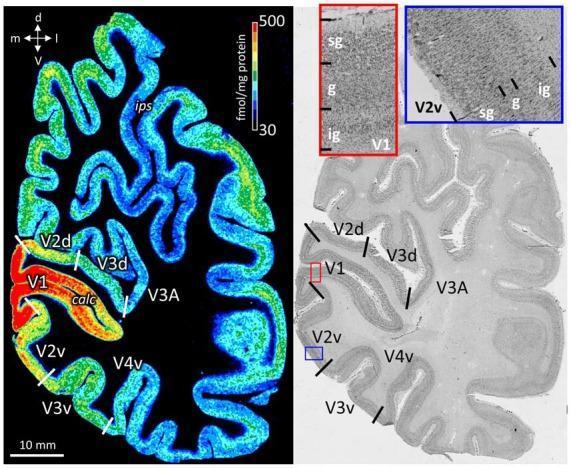
Educational comparison of neighboring coronal sections through the human occipital lobe, illustrating neuroanatomical architecture and molecular mapping. The left image is a receptor autoradiograph showing the distribution of cholinergic muscarinic M2 receptors. Density is represented by a pseudocolor scale (30–500 fmol/mg protein), with red/orange indicating high density in the primary visual cortex (V1), while areas such as V2d, V2v, V3d, V3A, and V4v show lower densities in green and blue. The right image is a corresponding cell body stained section (Nissl stain) displaying cytoarchitecture. Key landmarks like the calcarine sulcus (calc) and intraparietal sulcus (ips) are labeled. High-magnification insets (red and blue boxes) detail the laminar organization of V1 and V2v, distinguishing the supragranular (sg), granular (g), and infragranular (ig) strata. This visualization demonstrates how high-resolution histological staining is used to define cortical layer borders for subsequent mapping of receptor density profiles across specialized functional visual areas.
Cholinergic Esters (Choline Esters)
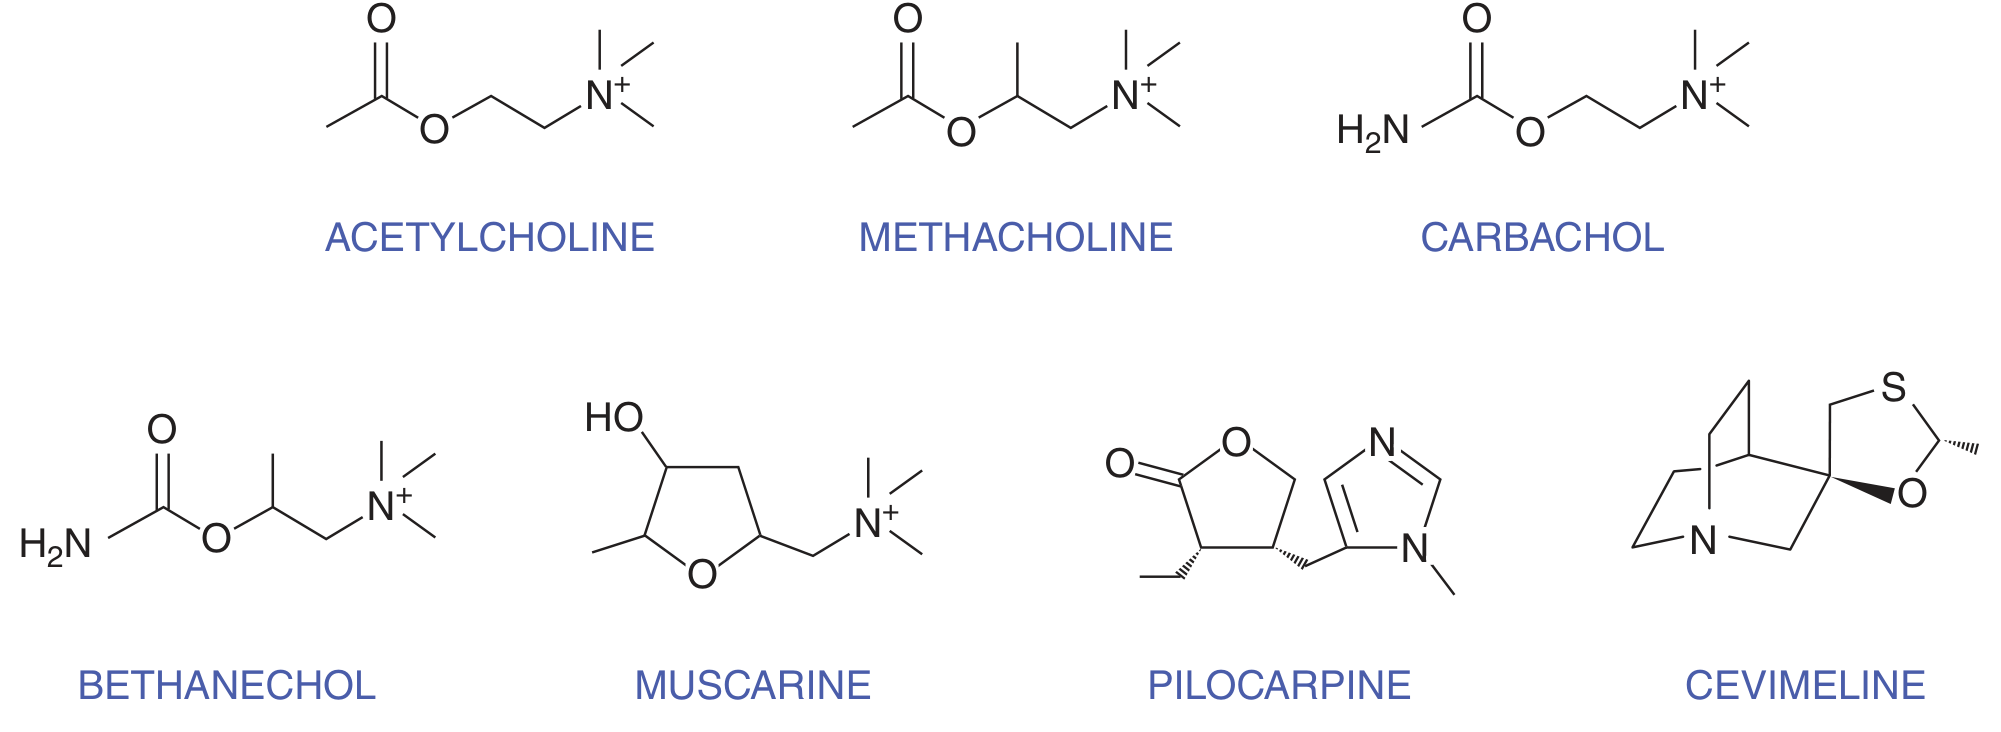
Members of the Group
| Choline Ester | Susceptibility to Cholinesterase | Muscarinic Action | Nicotinic Action |
|---|---|---|---|
| Acetylcholine chloride | ++++ | +++ | +++ |
| Methacholine chloride | + (resistant) | ++++ | None |
| Carbachol chloride | Negligible | ++ | +++ |
| Bethanechol chloride | Negligible | ++ | None |
1. Acetylcholine (ACh)
- The endogenous neurotransmitter at all cholinergic synapses.
- Acts on both muscarinic (M1-M5) and nicotinic (NM, NN) receptors with equal potency.
- Rapidly hydrolyzed by acetylcholinesterase (AChE) and butyrylcholinesterase - half-life in blood is seconds.
- A large IV bolus produces effects for only 5-20 seconds; IM/SC injections cause only local effects.
- No clinical systemic use due to its extreme brevity of action. Used intraocularly (Miochol-E) to produce rapid miosis during cataract surgery.
2. Methacholine (Acetyl-β-methylcholine)
- The β-methyl analogue of ACh - the added methyl group makes it more resistant to AChE hydrolysis, producing a longer duration of action.
- The β-methyl group also markedly reduces nicotinic receptor potency, making methacholine predominantly muscarinic-selective.
- Cardiovascular effects predominate: bradycardia, vasodilation, hypotension.
- Clinical use: Bronchial provocation challenge test (Methacholine Challenge Test) to diagnose bronchial hyperreactivity in asthma. Inhaled methacholine provokes bronchoconstriction in susceptible individuals (via M3 receptors on bronchial smooth muscle).
3. Carbachol (Carbamylcholine)
- A carbamoyl ester (carbamic acid ester of choline) - the ester bond resists hydrolysis by cholinesterases almost completely.
- Retains substantial nicotinic activity (unlike methacholine), acting on autonomic ganglia.
- Long duration of action due to resistance to enzymatic hydrolysis.
- Clinical use: Ophthalmic preparation - produces miosis and lowers intraocular pressure in glaucoma; also used intraocularly to produce miosis after lens implantation.
4. Bethanechol (Carbamyl-β-methylcholine)
- The β-methyl analogue of carbachol - combines the cholinesterase resistance of carbachol with the nicotinic receptor reduction of methacholine.
- Result: purely muscarinic activity with no nicotinic effects, and long duration.
- GI and urinary smooth muscle effects predominate - stimulates detrusor muscle of the bladder and GI motility.
- Clinical uses:
- Urinary retention (non-obstructive, post-operative or post-partum neurogenic bladder atony) - oral or SC
- Gastroesophageal reflux and gastroparesis (less commonly now)
- Contraindicated in mechanical obstruction of the GI tract or urinary tract, peptic ulcer, asthma, hyperthyroidism, and coronary artery disease.
Pharmacokinetics - General Properties
- Poorly absorbed orally due to hydrophilic/charged nature.
- Cannot cross the blood-brain barrier - no CNS effects with therapeutic doses.
- Eliminated by the kidneys.
- Despite resistance to enzymatic hydrolysis, carbachol and bethanechol are still relatively short-acting due to rapid renal elimination.
Mechanism of Action
- Coupled to Gq/11 → activates phospholipase C → increases IP3 and DAG → releases intracellular Ca²+ → smooth muscle contraction, glandular secretion.
- Coupled to Gi → inhibits adenylyl cyclase → decreases cAMP → reduces heart rate and conduction velocity.
- Also directly opens K+ channels in cardiac cells (via Gβγ) → hyperpolarization → bradycardia, decreased AV conduction.
- Ligand-gated ion channel → Na+ influx → depolarization at NMJ and autonomic ganglia.
Organ-Level Effects (Muscarinic)
| Organ | Effect |
|---|---|
| Heart | Bradycardia, decreased AV conduction (M2) |
| Blood vessels | Vasodilation, hypotension (endothelial M3 → NO release) |
| Eye | Miosis (pupillary sphincter), accommodation for near vision (M1) |
| Lungs | Bronchoconstriction, increased secretions (M3) |
| GI tract | Increased peristalsis, increased secretions, relaxation of sphincters (M3) |
| Urinary bladder | Contraction of detrusor, relaxation of trigone/sphincter (M3) |
| Glands | Increased salivation, lacrimation, sweating (M3) |
| CNS | Arousal, cognition (M1) - only for tertiary amines, not choline esters |
Summary Mnemonics
- ACh: both M + N, fastest hydrolysis, prototype
- Methacholine: M only, some AChE resistance → bronchoprovocation test
- Carbachol: M + N (like ACh), but AChE-resistant → glaucoma/miosis
- Bethanechol: M only, AChE-resistant → urinary/GI smooth muscle
"Beta B (Bethanechol) for Bladder/Bowel; Carba-C (Carbachol) for glaucoma (Cornea)"
- Goodman & Gilman's Pharmacological Basis of Therapeutics - Ch. 11, Muscarinic Receptor Agonists, pp. 229-233
- Katzung's Basic & Clinical Pharmacology, 16th Ed. - Ch. 7, Cholinoceptor-Activating & Cholinesterase-Inhibiting Drugs, Table 7-2 and pp. 173-176