
Anti tussive action of opioid (morphine)
Antitussive Action of Morphine (Opioids)
Mechanism of Action
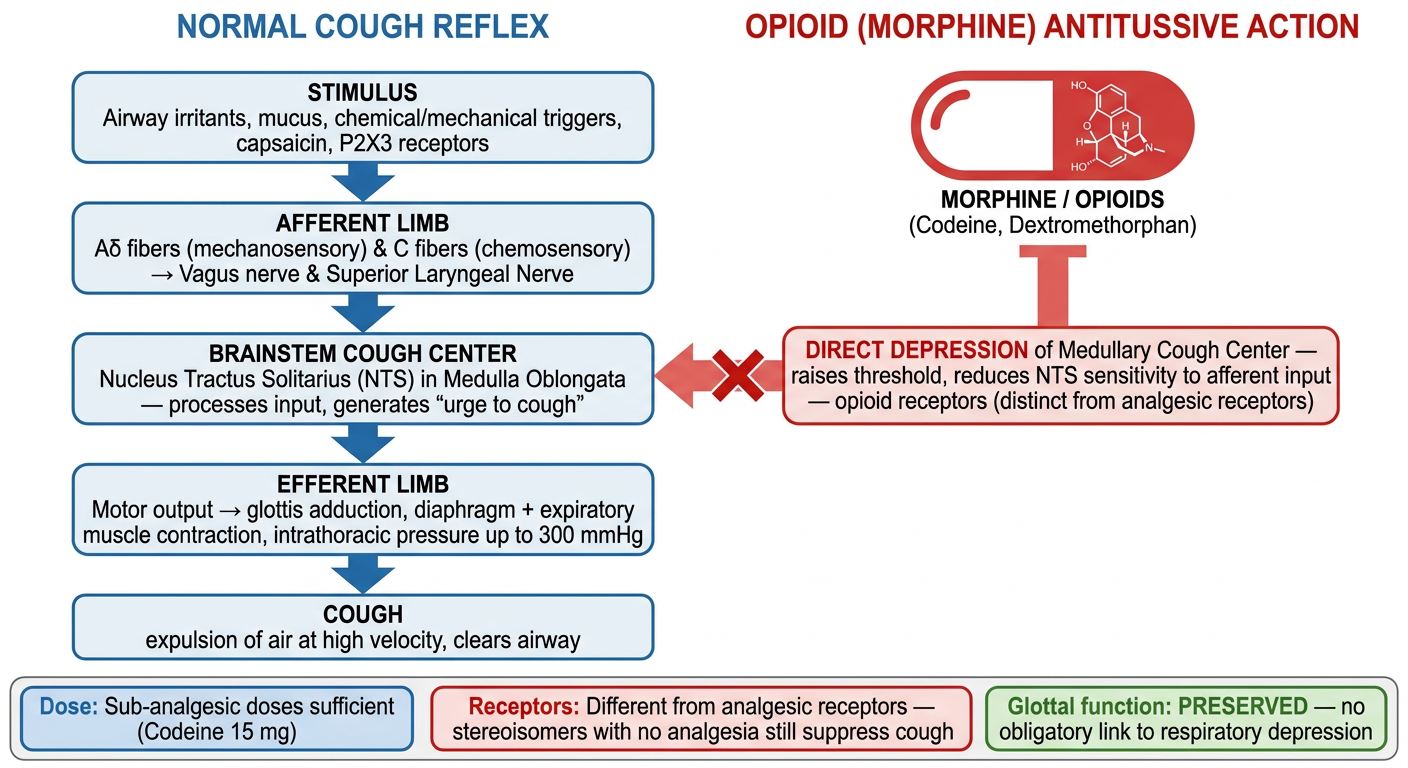
- Lippincott Pharmacology: "Both morphine and codeine have antitussive properties and cause cough suppression by direct depression of the medullary cough reflex."
- Goodman & Gilman's: "Morphine, codeine, and related opioids depress the cough reflex at least in part by a direct effect on a cough center in the medulla."
Key Features
| Feature | Detail |
|---|---|
| Site of action | Medullary cough center (brainstem) |
| Receptor type | Opioid receptors - but different from those mediating analgesia |
| Dose | Achieved at doses below those needed for analgesia |
| Correlation with analgesia | No close correlation - antitussive and analgesic effects are dissociable |
| Correlation with respiratory depression | No obligatory relationship - cough can be suppressed without depressing respiration |
| Glottal function | Protective glottal function is preserved even during cough suppression |
Receptors Involved
- Stereoisomers of opioid molecules that have no analgesic activity or addiction liability (e.g., dextromethorphan) still produce antitussive effects.
- The antitussive dose is lower than the analgesic dose for codeine (15 mg antitussive vs. higher doses for analgesia).
Clinically Used Opioid Antitussives
| Drug | Notes |
|---|---|
| Codeine | Most commonly used opioid antitussive; 15 mg sufficient for cough suppression |
| Dextromethorphan | Synthetic morphine derivative; no analgesic/addictive properties at antitussive doses; blocks medullary cough center; also acts via NMDA receptor antagonism |
| Morphine | Has antitussive property but not preferred clinically for this indication due to addiction and side effect profile |
| Noscapine | Used outside the USA; devoid of opioid side effects |
| Levopropoxyphene | Stereoisomer of dextropropoxyphene; no opioid effects |
Dissociation from Respiratory Depression
Summary Points for Exams
- Morphine suppresses cough via direct depression of the medullary cough center.
- The antitussive receptors are distinct from analgesic receptors.
- Cough suppression occurs at sub-analgesic doses.
- There is no obligatory link between antitussive action and respiratory depression.
- Codeine is the prototypical opioid antitussive; dextromethorphan is the most widely used non-addictive alternative.
- The protective glottal reflex is preserved during opioid-induced cough suppression.
Anti tussive action of opioid (morphine) representation with reference and diagrammatic representation
A clean medical pharmacology diagram showing the antitussive action of morphine. The diagram has two parallel vertical flowcharts side by side titled "NORMAL COUGH REFLEX" and "OPIOID (MORPHINE) ANTITUSSIVE ACTION". LEFT SIDE - Normal Cough Reflex (blue arrows going downward): Box 1: "STIMULUS (Airway irritants, mucus, chemical/mechanical triggers, capsaicin, P2X3 receptors)" Arrow down Box 2: "AFFERENT LIMB: Aδ fibers (mechanosensory) & C fibers (chemosensory) → Vagus nerve & Superior Laryngeal Nerve" Arrow down Box 3: "BRAINSTEM COUGH CENTER: Nucleus Tractus Solitarius (NTS) in Medulla Oblongata — processes input, generates 'urge to cough'" Arrow down Box 4: "EFFERENT LIMB: Motor output → glottis adduction, diaphragm + expiratory muscle contraction, intrathoracic pressure up to 300 mmHg" Arrow down Box 5: "COUGH (expulsion of air at high velocity, clears airway)" RIGHT SIDE - Morphine Antitussive Action (red inhibitory arrows): Large red pill/molecule icon labeled "MORPHINE / OPIOIDS (Codeine, Dextromethorphan)" Big red inhibitory flat arrow pointing at the Brainstem Cough Center box Text in red box: "DIRECT DEPRESSION of Medullary Cough Center — raises threshold, reduces NTS sensitivity to afferent input — opioid receptors (distinct from analgesic receptors)" Below both sides, a shared footer panel with three key facts in colored boxes: - "Dose: Sub-analgesic doses sufficient (Codeine 15 mg)" - "Receptors: Different from analgesic receptors — stereoisomers with no analgesia still suppress cough" - "Glottal function: PRESERVED — no obligatory link to respiratory depression" Clean white background, medical illustration style, professional and clear labels.
Antitussive Action of Morphine - Full Reference Notes
The Normal Cough Reflex (What Morphine Suppresses)
| Step | Component | Detail |
|---|---|---|
| 1 | Stimulus | Chemical (capsaicin, irritants) or mechanical (mucus, particles) triggers |
| 2 | Sensory receptors | Transient receptor potential (TRP) channels and P2X3 ion channels on afferent nerve endings |
| 3 | Afferent fibers | Aδ fibers (mechanosensory) and C fibers (chemosensory); innervate pharynx, larynx, airways down to terminal bronchioles |
| 4 | Afferent pathway | Signals travel via vagus nerve and superior laryngeal nerve |
| 5 | Brainstem integration | Nucleus Tractus Solitarius (NTS) in the medulla processes input → generates "urge to cough" |
| 6 | Efferent output | Glottis adducts → expiratory muscles contract → intrathoracic pressure up to 300 mmHg → rapid expiratory airflow clears airway |
How Morphine Suppresses Cough
"Morphine, codeine, and related opioids depress the cough reflex at least in part by a direct effect on a cough center in the medulla; this cough suppression can be achieved without altering the protective glottal function."
"Both morphine and codeine have antitussive properties and cause cough suppression by direct depression of the medullary cough reflex. In general, cough suppression does not correlate closely with analgesic and respiratory depressant properties of opioid drugs. The receptors involved in the antitussive action appear to be different from those involved in analgesia."
Key Pharmacological Dissociations
ANALGESIC ACTION          ≠          ANTITUSSIVE ACTION
  μ-opioid receptors                 Different opioid receptors
  Higher doses needed                Sub-analgesic doses sufficient
  Addiction liability                Stereoisomers without addiction work

RESPIRATORY DEPRESSION    ≠          ANTITUSSIVE ACTION
  Obligatory with high doses         NO obligatory link
  Dextromethorphan: antitussive      but NO respiratory depression
Clinically Used Opioid Antitussives
| Drug | Type | Antitussive Dose | Notes |
|---|---|---|---|
| Codeine | Natural opioid | 15 mg | Prototype; also analgesic at higher doses |
| Dextromethorphan | Synthetic morphine stereoisomer | 15-30 mg q6-8h | No analgesia, no addiction; also NMDA antagonist; most widely used OTC |
| Noscapine | Opium alkaloid | - | No opioid effects; used outside USA |
| Levopropoxyphene | Stereoisomer | 50-100 mg q4h | Devoid of opioid effects |
"The opioid analgesics are among the most effective drugs available for the suppression of cough. This effect is often achieved at doses below those necessary to produce analgesia... The antitussive effect is also produced by stereoisomers of opioid molecules that are devoid of analgesic effects and addiction liability."
Summary - Exam High-Yield Points
- Site: Direct depression of medullary cough center (NTS region)
- Dose: Below analgesic dose (codeine 15 mg antitussive vs. higher for pain)
- Receptors: Distinct from analgesic receptors - proven by stereoisomers
- Glottal reflex: Preserved (protective function maintained)
- No obligatory link to respiratory depression
- Best clinical choice: Codeine (opioid) or dextromethorphan (non-addictive)
- Caution: Avoid in asthma (morphine releases histamine causing bronchoconstriction)
- Goodman & Gilman's Pharmacological Basis of Therapeutics, p. 472 - Cough section
- Lippincott Illustrated Reviews: Pharmacology, p. 711 - Depression of cough reflex
- Katzung's Basic and Clinical Pharmacology, 16e, p. 896 - Antitussives section
- Harrison's Principles of Internal Medicine, 22e, p. 2216 - Cough mechanism
tuberculosis diagnostic test
A comprehensive medical diagnostic flowchart for Tuberculosis (TB) diagnosis. Clean white background, professional medical illustration style with color-coded sections. Title at top: "TUBERCULOSIS - DIAGNOSTIC TESTS" in bold dark blue. Divided into THREE main horizontal sections: SECTION 1 - TOP (light blue background): "CLINICAL SUSPICION" Two boxes side by side: - "SYMPTOMS: Cough >2 weeks, hemoptysis, fever, night sweats, weight loss, fatigue" - "CHEST X-RAY: Upper lobe infiltrates, cavitation, nodules, miliary pattern, hilar lymphadenopathy, pleural effusion" SECTION 2 - MIDDLE (main diagnostic section, yellow-orange background): "MICROBIOLOGICAL TESTS" Three columns: Column A (green): "SPUTUM AFB SMEAR MICROSCOPY" - Ziehl-Neelsen or Auramine-rhodamine stain - 3 specimens (early morning) - Result in: 1-2 hours - Sensitivity: up to 90% (3 samples) - Fast but cannot confirm species - Red/pink rods = AFB positive Column B (orange): "MYCOBACTERIAL CULTURE (Gold Standard)" - Lowenstein-Jensen medium (solid) - BACTEC/MGIT (liquid - faster) - Time: 2-8 weeks (solid), 1-3 weeks (liquid) - Sensitivity: 43-100% - Confirms species + drug susceptibility testing Column C (purple): "NAAT / Molecular Tests" - Xpert MTB/RIF (GeneXpert) - Result in: 90 minutes - Detects MTB + Rifampin resistance - WHO preferred test for HIV+ patients - Also: Line probe assay, whole genome sequencing SECTION 3 - BOTTOM (split into two): "LATENT TB INFECTION (LTBI) TESTS" Left box (blue): "TUBERCULIN SKIN TEST (TST) / MANTOUX" - Inject 0.1 mL PPD (5 TU) intradermally into volar forearm - Read at 48-72 hours - measure INDURATION (not redness) - Interpret by risk stratification: ≥5 mm: HIV+, close contacts, chest X-ray with old TB ≥10 mm: High-risk groups (immigrants, diabetes, renal failure) ≥15 mm: All others (low risk) - Limitations: False+ with BCG; false- in immunocompromised Right box (teal): "IGRA - Interferon Gamma Release Assay" - QuantiFERON-TB Gold Plus - T-SPOT.TB - Blood test - detects IFN-γ from sensitized T cells - Antigens: ESAT-6, CFP-10, TB7.7 (NOT in BCG) - NOT affected by BCG vaccination - Specificity >95%, Sensitivity 80-90% - Preferred over TST in patients ≥5 years Small comparison table at very bottom showing TST vs IGRA: BCG interference (TST: YES / IGRA: NO), Blood draw required (TST: NO / IGRA: YES), Result time (TST: 48-72h / IGRA: same day) Color arrows connecting sections showing the diagnostic algorithm flow.
404 Not Found. {'message': '{\n "error": {\n "code": 404,\n "message": "Publisher model `projects/engaged-beaker-474810-u2/locations/global/publishers/google/models/gemini-3-pro-image-preview` was not found or your project does not have access to it. Ensure you are using a valid model name and that the model is available in the specified region. For more information, see: https://docs.cloud.google.com/gemini-enterprise-agent-platform/resources/locations.",\n "status": "NOT_FOUND"\n }\n}\n', 'status': 'Not Found'}
We encountered an error while processing your request. Please try again or reach out to us for help.
Tuberculosis diagnostic tests
A detailed, clean medical diagnostic flowchart titled "TUBERCULOSIS - DIAGNOSTIC TESTS" on a white background with professional medical illustration style. TOP BANNER (dark navy blue): "TUBERCULOSIS DIAGNOSTIC TESTS" in large bold white text. ROW 1 - "STEP 1: CLINICAL SUSPICION" (light blue box, full width): Left side: Symptoms list: cough greater than 2 weeks, hemoptysis, fever, night sweats, weight loss, fatigue Right side: Risk factors: HIV positive, close contact with TB case, immigrant from high-incidence country, immunosuppression ROW 2 - "STEP 2: CHEST X-RAY" (light gray box): Text: Upper lobe infiltrates, cavitation, nodules, miliary pattern, pleural effusion, hilar lymphadenopathy. Note: Reactivation TB classically involves upper lobes. ROW 3 - "STEP 3: MICROBIOLOGICAL TESTS FOR ACTIVE TB" - THREE COLUMNS side by side: LEFT COLUMN (green background): Header: "1. AFB SPUTUM SMEAR MICROSCOPY" Stains: Ziehl-Neelsen (ZN) or Auramine-rhodamine Sample: 3 early-morning sputum specimens Turnaround: 1 to 2 hours Sensitivity: up to 90 percent with 3 samples Note: Cannot distinguish MTB from NTM Symbol: microscope icon MIDDLE COLUMN (orange background): Header: "2. MYCOBACTERIAL CULTURE (Gold Standard)" Media: Lowenstein-Jensen solid medium OR MGIT/BACTEC liquid medium Turnaround: solid 3 to 8 weeks, liquid 1 to 3 weeks Sensitivity: 43 to 100 percent Use for: species ID, drug susceptibility testing (DST) Symbol: test tube icon RIGHT COLUMN (purple background): Header: "3. NAAT / MOLECULAR TESTS" Xpert MTB/RIF (GeneXpert): detects MTB plus rifampin resistance in 90 minutes, sensitivity 89 percent, specificity 99 percent WHO preferred initial test for: HIV-positive, MDR-TB risk, severe illness Line probe assay (LPA): detects INH plus RIF resistance Note: Does NOT replace culture for drug susceptibility Symbol: DNA helix icon ROW 4 - "STEP 4: TESTS FOR LATENT TB INFECTION (LTBI)" - TWO COLUMNS: LEFT COLUMN (blue background): Header: "TUBERCULIN SKIN TEST (TST) / MANTOUX" Procedure: Inject 0.1 mL PPD (5 TU) intradermally into volar forearm using 27-gauge needle Read at: 48 to 72 hours - measure INDURATION diameter in mm Interpretation by risk: - 5 mm or more: HIV positive, close contacts, old TB on X-ray - 10 mm or more: high-risk groups (immigrants, diabetes, renal failure, healthcare workers) - 15 mm or more: all other low-risk persons Limitations: False positive with BCG vaccine; false negative in immunocompromised patients; subjective reading RIGHT COLUMN (teal background): Header: "IGRA - INTERFERON-GAMMA RELEASE ASSAY" Tests: QuantiFERON-TB Gold Plus OR T-SPOT.TB Mechanism: blood test measuring IFN-gamma from sensitized T-cells stimulated with ESAT-6 and CFP-10 antigens Specificity greater than 95 percent, Sensitivity 80 to 90 percent Key advantage: NOT affected by BCG vaccination Preferred: patients 5 years and older Limitations: requires blood draw and lab processing BOTTOM COMPARISON TABLE: "TST vs IGRA Comparison" table with columns TST and IGRA: BCG interference: YES vs NO Blood test needed: NO vs YES Result time: 48-72 hours vs same day Age preferred: under 5 years vs 5 years and older Cost: low vs higher Also note at bottom: "HIV testing recommended for ALL confirmed or suspected TB patients" Use clear arrows between rows to show diagnostic flow. Color coded, clean, professional medical style.
404 Not Found. {'message': '{\n "error": {\n "code": 404,\n "message": "Publisher model `projects/engaged-beaker-474810-u2/locations/global/publishers/google/models/gemini-3-pro-image-preview` was not found or your project does not have access to it. Ensure you are using a valid model name and that the model is available in the specified region. For more information, see: https://docs.cloud.google.com/gemini-enterprise-agent-platform/resources/locations.",\n "status": "NOT_FOUND"\n }\n}\n', 'status': 'Not Found'}
We encountered an error while processing your request. Please try again or reach out to us for help.
Hi
Definition, etiological factors, pathogenesis of cancer
CANCER - Definition, Etiology, and Pathogenesis
1. DEFINITION
"Cancer is a genetic disorder caused by DNA mutations... these genetic and epigenetic abnormalities alter the expression or function of key genes that regulate fundamental cellular processes, such as growth, survival, and senescence."
- Robbins & Kumar Basic Pathology
Key Distinctions
| Feature | Benign Tumor | Malignant Tumor (Cancer) |
|---|---|---|
| Growth | Slow, expansile | Rapid, uncontrolled |
| Capsule | Usually encapsulated | No capsule |
| Local invasion | Absent | Present |
| Metastasis | Absent | Present |
| Differentiation | Well differentiated | Variable - may be undifferentiated |
| Recurrence | Rare | Common |
Classification of Cancers
| Class | Origin | Examples |
|---|---|---|
| Carcinomas | Epithelial tissue | Lung, breast, colon, prostate |
| Sarcomas | Mesenchymal tissue (bone, muscle, connective tissue) | Osteosarcoma, liposarcoma |
| Hematopoietic/Lymphoid | Bone marrow, lymphatic system | Leukemia, lymphoma, myeloma |
2. ETIOLOGICAL FACTORS
A. Chemical Carcinogens
| Type | Mechanism | Examples |
|---|---|---|
| Direct-acting agents | React directly with DNA without metabolic activation | Alkylating agents (nitrogen mustard), acylating agents |
| Indirect-acting (procarcinogens) | Require metabolic activation (cytochrome P-450 enzymes) to become active carcinogens | Polycyclic hydrocarbons (tobacco smoke, charred meat), aromatic amines, azo dyes, aflatoxin B1 |
B. Radiation Carcinogenesis
- Ionizing radiation (X-rays, gamma rays, alpha/beta particles): Causes DNA strand breaks and mutations. Linked to leukemia, thyroid, breast, lung, and bone cancers. Classic example: atomic bomb survivors.
- Ultraviolet (UV) radiation: Causes pyrimidine dimers in DNA, especially in skin cells. Linked to squamous cell carcinoma, basal cell carcinoma, and melanoma.
C. Viral and Microbial Oncogenesis
| Agent | Cancer |
|---|---|
| HPV (Human Papillomavirus) | Cervical, oropharyngeal, anal carcinoma |
| EBV (Epstein-Barr Virus) | Burkitt lymphoma, nasopharyngeal carcinoma, Hodgkin lymphoma |
| HBV / HCV | Hepatocellular carcinoma |
| HTLV-1 | Adult T-cell leukemia/lymphoma |
| H. pylori | Gastric adenocarcinoma, gastric MALT lymphoma |
| Schistosoma haematobium | Bladder carcinoma |
| Opisthorchis viverrini | Cholangiocarcinoma |
D. Hereditary / Genetic Factors
- Germline mutations in tumor suppressor genes: BRCA1/2 (breast/ovarian cancer), APC (colorectal cancer), RB1 (retinoblastoma), TP53 (Li-Fraumeni syndrome)
- Hereditary cancers follow the "two-hit hypothesis" (Knudson): one mutant allele is inherited, and a second somatic mutation inactivates the remaining normal allele
E. Acquired Predisposing Conditions (Chronic Inflammation)
| Chronic Condition | Associated Cancer |
|---|---|
| Inflammatory bowel disease | Colorectal carcinoma |
| Barrett esophagus (reflux) | Esophageal adenocarcinoma |
| Chronic hepatitis (B/C) | Hepatocellular carcinoma |
| Chronic gastritis (H. pylori) | Gastric carcinoma |
| Asbestosis | Mesothelioma, lung carcinoma |
| Chronic pancreatitis | Pancreatic carcinoma |
3. PATHOGENESIS
Step 1: Fundamental Principle - Cancer is a Genetic Disease
"Genetic alterations in cancer cells are heritable, being passed to daughter cells upon cell division; as a result, cells harboring these mutations are subject to Darwinian selection."
- Robbins & Kumar Basic Pathology
Step 2: Key Genetic Mechanisms
| Mechanism | Description |
|---|---|
| Proto-oncogene → Oncogene | Gain-of-function mutations activate growth-promoting genes (e.g., RAS, MYC, HER2) |
| Tumor suppressor gene inactivation | Loss-of-function mutations disable growth brakes (e.g., RB, TP53, APC) |
| DNA repair gene mutations | Loss of DNA repair capacity accelerates accumulation of mutations (e.g., BRCA1/2, MLH1) |
| Epigenetic alterations | DNA hypermethylation silences tumor suppressor genes; global hypomethylation causes genomic instability |
| MicroRNA dysregulation | Oncomirs (e.g., those targeting BCL2) promote survival; loss of miRNAs controlling RAS/MYC promotes growth |
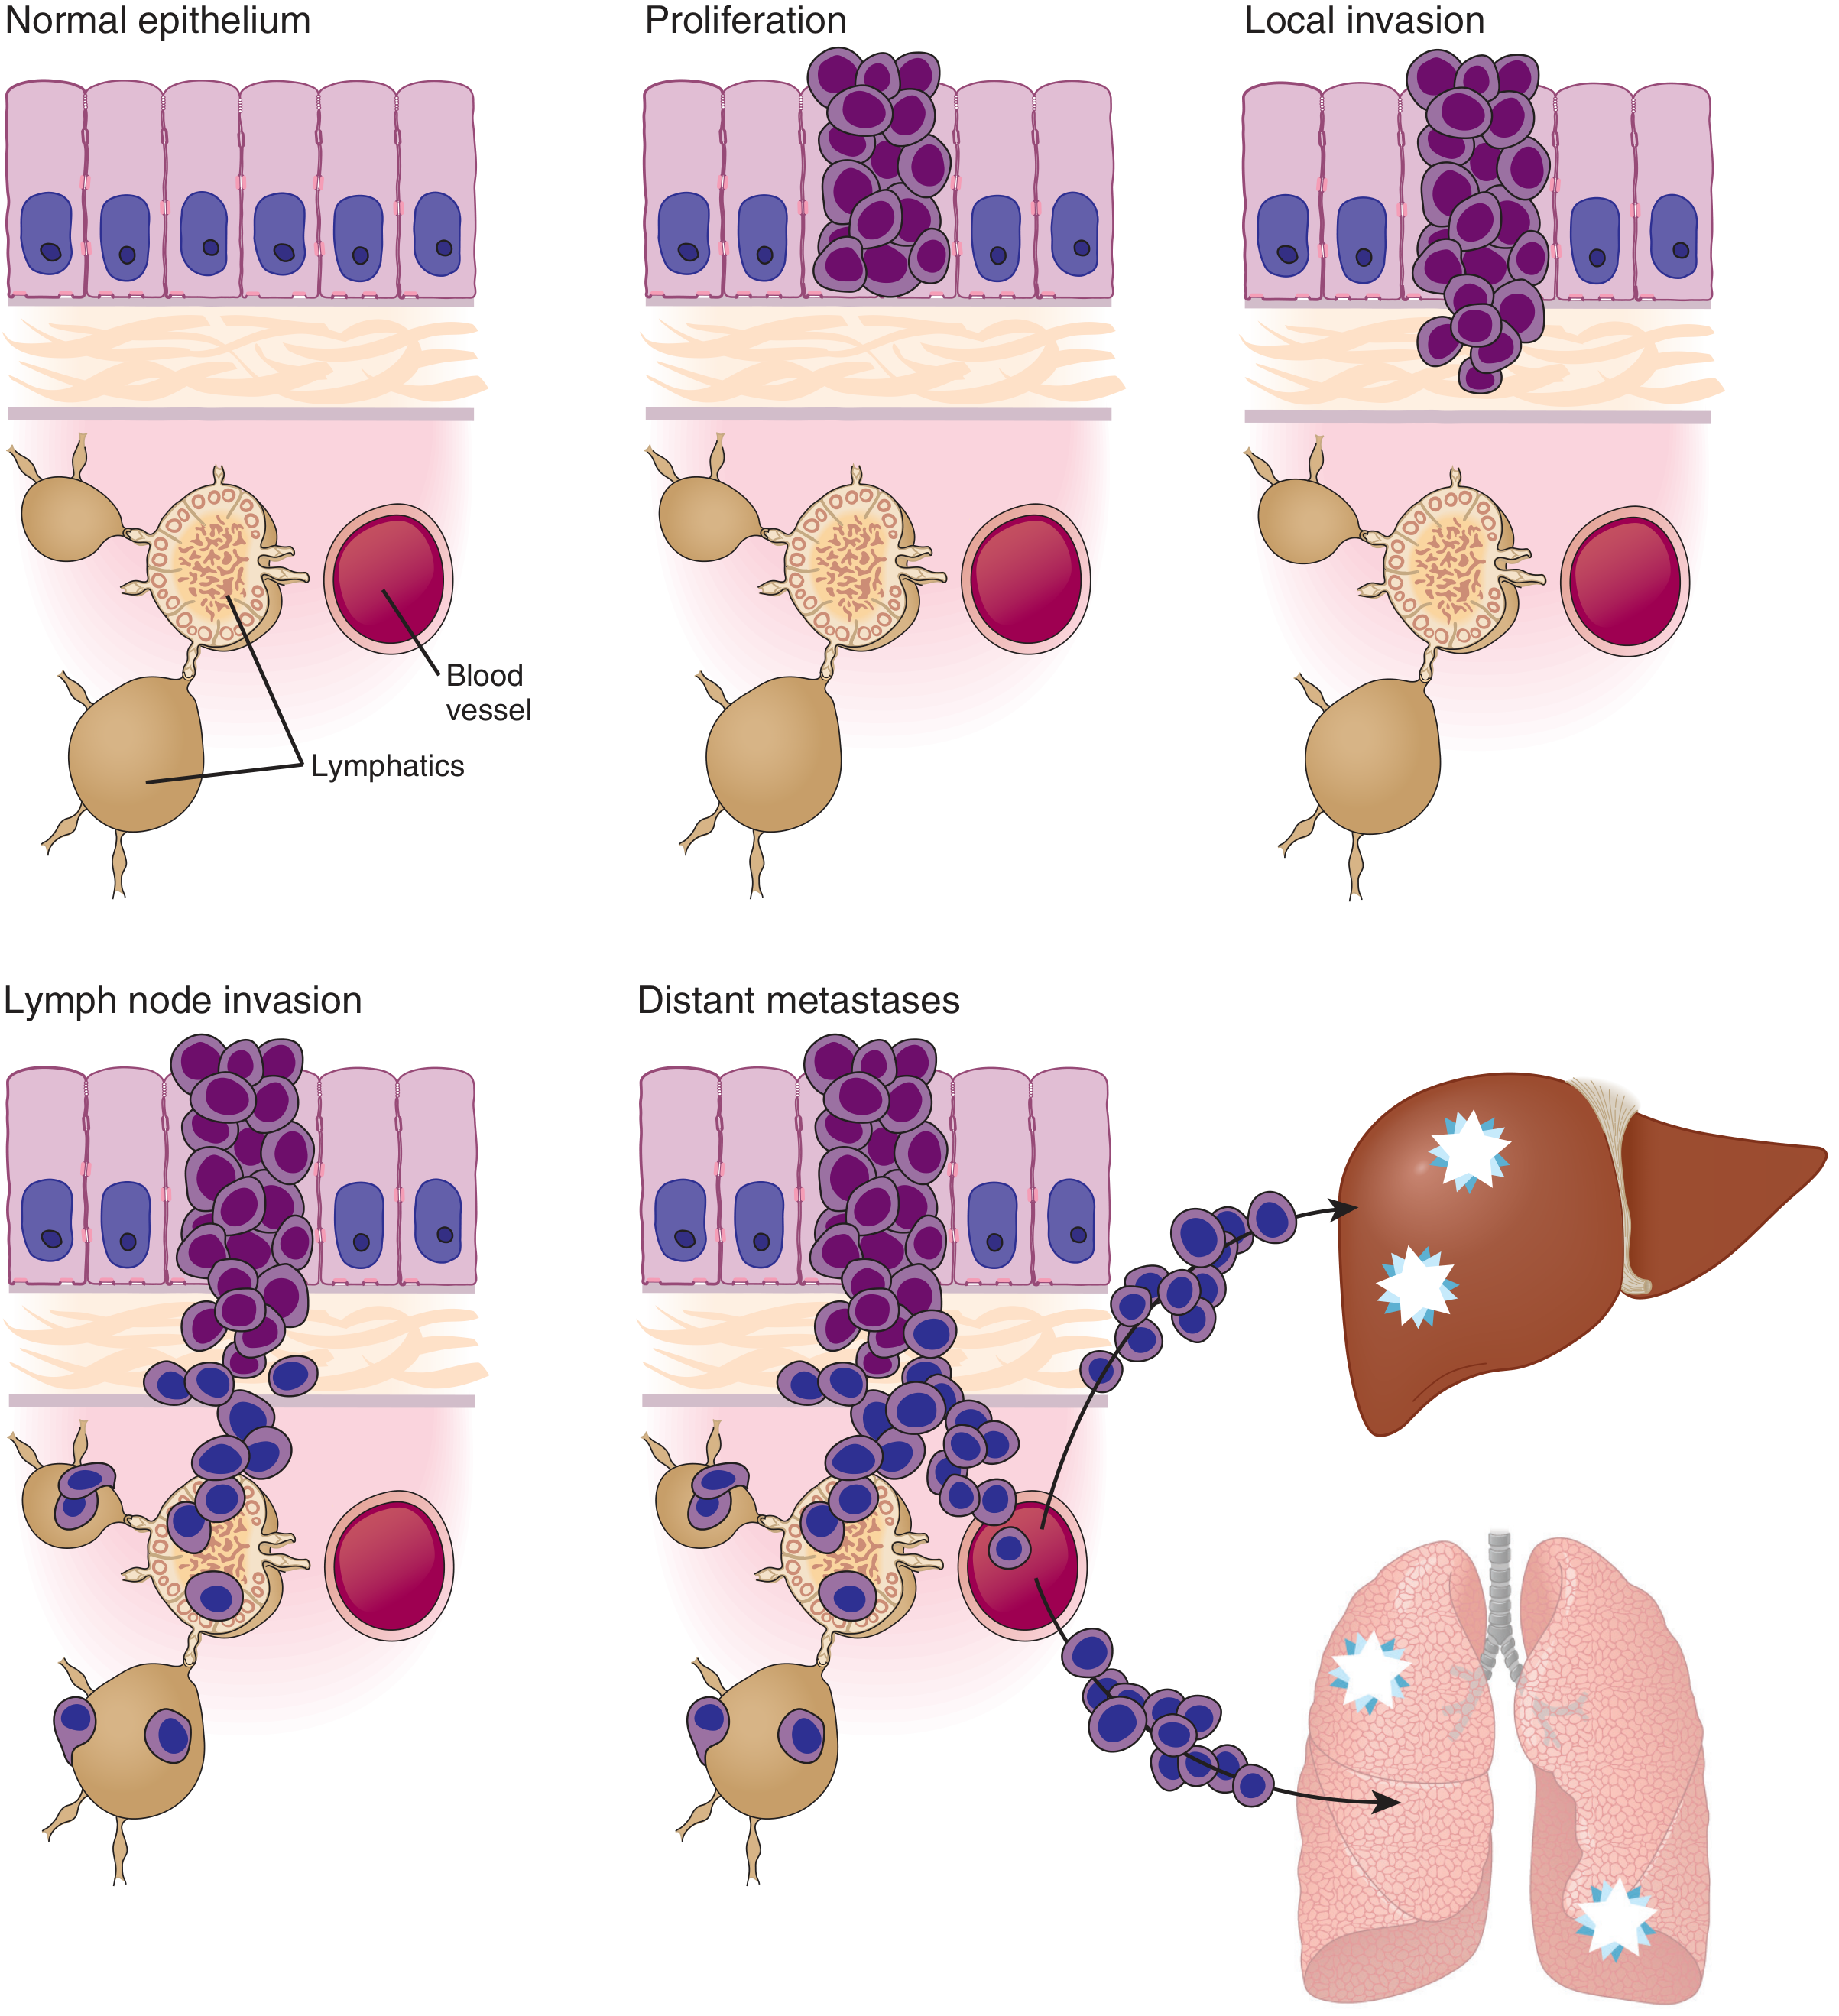
Step 3: Carcinogenesis - A Multistep Process
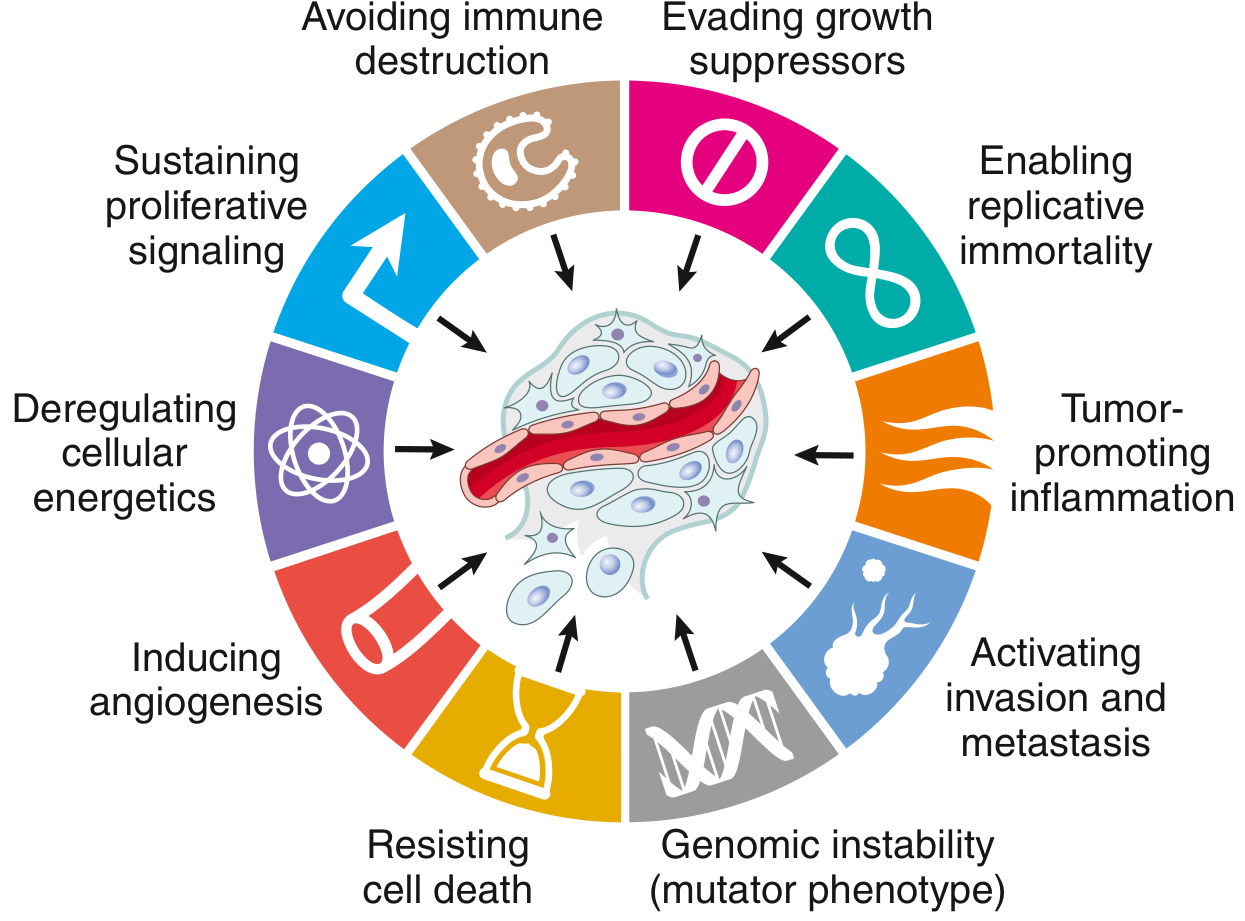
Step 4: The Hallmarks of Cancer
| Hallmark | Mechanism |
|---|---|
| 1. Sustaining proliferative signaling | Oncogenes (RAS, MYC) produce growth signals autonomously, independent of external stimuli |
| 2. Evading growth suppressors | Inactivation of RB (cell cycle governor) and TP53 (genome guardian) |
| 3. Resisting cell death | Overexpression of BCL2 and other antiapoptotic proteins; downregulation of pro-apoptotic signals |
| 4. Enabling replicative immortality | Upregulation of telomerase - prevents telomere shortening and cellular senescence |
| 5. Inducing angiogenesis | VEGF and other angiogenic factors recruit new blood vessels to feed the growing tumor |
| 6. Activating invasion and metastasis | Loss of E-cadherin, activation of matrix metalloproteinases; epithelial-mesenchymal transition (EMT) |
| 7. Deregulating cellular energetics | Warburg effect - aerobic glycolysis even in presence of oxygen; reprogrammed metabolism |
| 8. Avoiding immune destruction | Downregulation of MHC-I, expression of PD-L1, recruitment of regulatory T cells |
- Genomic instability - mutator phenotype accelerates mutations
- Tumor-promoting inflammation - inflammatory mediators promote all cancer hallmarks
Summary Flow of Cancer Pathogenesis
Normal Cell
    ↓ (Initiating event: mutation by carcinogen/radiation/virus)
Initiated Cell (single mutation in key gene)
    ↓ (Promotion: clonal expansion, additional mutations)
Pre-malignant Lesion (e.g., adenoma, dysplasia)
    ↓ (Progression: accumulation of hallmark mutations)
Cancer (malignant, invasive)
    ↓ (Metastasis: invasion → intravasation → survival → extravasation → colonization)
Metastatic Disease
- Robbins & Kumar Basic Pathology, 10e - Chapter 6: Neoplasia (pp. 213-229) - primary source for all above content
- Thompson & Thompson Genetics and Genomics in Medicine, 9e - Chapter 16: Neoplasia (pp. 361-362)
- Goodman & Gilman's Pharmacological Basis of Therapeutics - Carcinogenesis section
/explain cancer
cancer cell division tumor growth malignant cells diagram
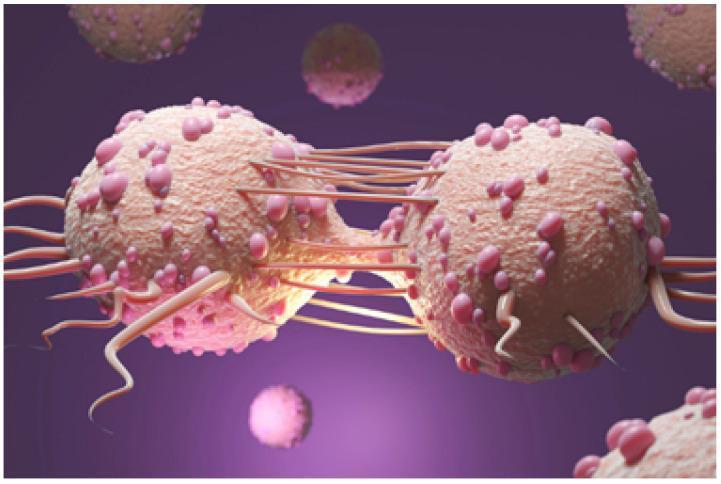
This medical illustration depicts a pathophysiology diagram of a tumor cell in the process of division, illustrating the concept of abnormal cellular proliferation. The central focus is on two large, beige-colored spherical structures connected by a cytoplasmic bridge and multiple fibrous strands, suggesting late-stage cytokinesis or mitotic activity. The cell membranes are textured with numerous small, pinkish, raised protuberances and elongated, pili-like extrusions, which may represent surface receptors, adhesion molecules, or signaling proteins common in malignant cells. In the background, smaller detached spherical entities with similar morphology are visible, scattered across a uniform purple field. This visual serves as an educational tool for oncology and cell biology, demonstrating the morphological characteristics of tumor growth and the physical mechanisms of cancer cell multiplication. The image provides a conceptual visualization often used to explain how a mass of tissues expands through continuous, dysregulated cellular division.
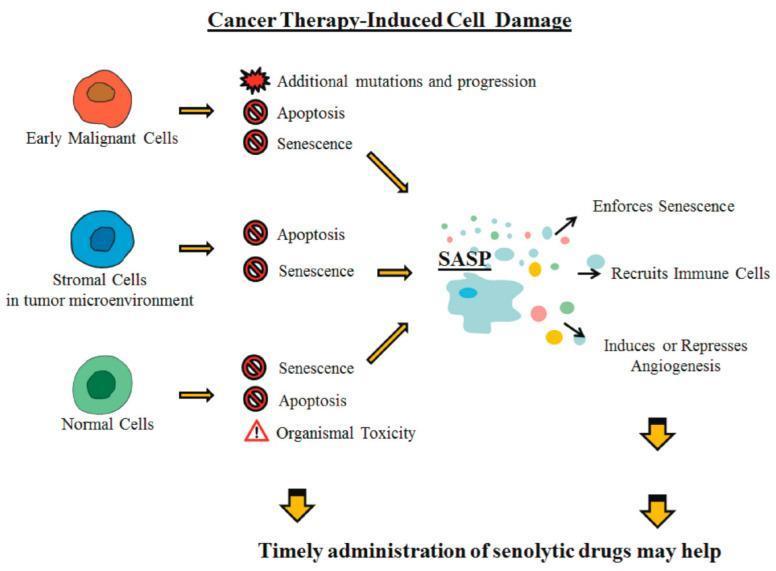
A pathophysiology diagram titled 'Cancer Therapy-Induced Cell Damage' illustrating the cellular responses to treatment and the role of the Senescence-Associated Secretory Phenotype (SASP). The diagram categorizes three cell types: Early Malignant Cells (orange), Stromal Cells in the tumor microenvironment (blue), and Normal Cells (green). Following cancer therapy, these cells face different outcomes: malignant cells can acquire additional mutations/progression (red starburst) or enter apoptosis/senescence (symbolized by red 'no' circles). Both stromal and normal cells similarly face apoptosis, senescence, or organismal toxicity (red triangle). The pathway converges on SASP, represented by a multicell cluster secreting signaling molecules. The diagram depicts SASP's downstream effects: enforcing senescence, recruiting immune cells, and modulating (inducing or repressing) angiogenesis. At the bottom, a clinical takeaway notes that 'Timely administration of senolytic drugs may help,' suggesting a therapeutic window to mitigate the negative systemic effects of lingering senescent cells in oncology patients.
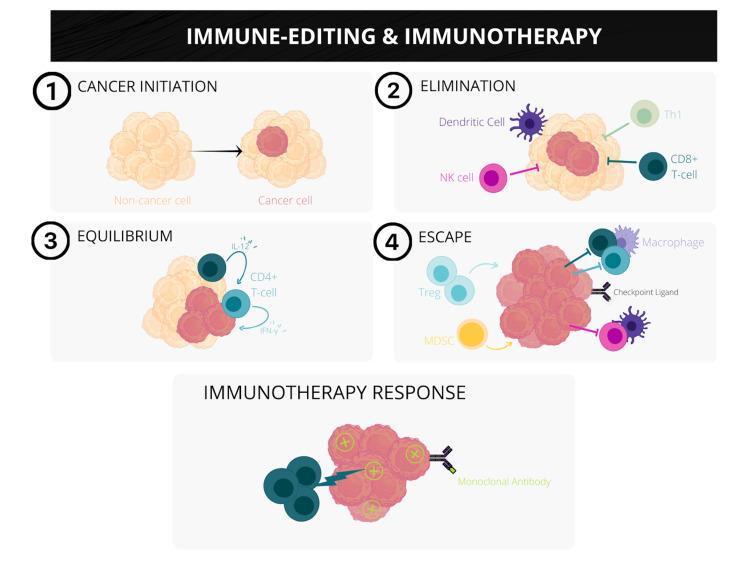
A pathophysiology diagram illustrating the three stages of cancer immunoediting and the mechanism of immunotherapy response. The diagram is divided into four numbered sections followed by a concluding panel. 1) Cancer Initiation: Shows the transformation of normal cells into malignant cells. 2) Elimination: Depicts innate and adaptive immune cells, including Dendritic cells, NK cells, Th1 cells, and CD8+ T-cells, actively targeting and inhibiting early cancer cell growth. 3) Equilibrium: Illustrates a steady state where CD4+ T-cells and cytokines like IL-12 and IFN-gamma control tumor progression without complete eradication. 4) Escape: Shows the tumor microenvironment becoming immunosuppressive, featuring Regulatory T-cells (Treg), Myeloid-derived suppressor cells (MDSC), and macrophages, alongside checkpoint ligands that allow the tumor mass to proliferate. The final panel, Immunotherapy Response, demonstrates a monoclonal antibody targeting specific tumor antigens (marked with '+' signs) to overcome immune evasion and induce tumor regression. This educational visual explains the concepts of immunosurveillance and therapeutic intervention in oncology.
What is Cancer?
The Simple Explanation
The Formal Definition
"Neoplasia means 'new growth,' and neoplastic cells are said to be 'transformed' because they replicate incessantly as a result of resistance to the regulatory influences that control normal cells."
- Robbins & Kumar Basic Pathology
- Local invasion - it grows into and destroys surrounding normal tissue
- Metastasis - it spreads to distant organs via blood or lymph vessels
Why Does Cancer Happen? - The Genetic Basis
| Cause | Examples |
|---|---|
| Chemical carcinogens | Tobacco smoke, aflatoxin, benzene |
| Radiation | UV light (skin cancer), X-rays, gamma rays |
| Viruses | HPV (cervical cancer), HBV/HCV (liver cancer), EBV (lymphoma) |
| Inherited mutations | BRCA1/2 (breast), APC (colon), TP53 (Li-Fraumeni) |
| Chronic inflammation | H. pylori → stomach cancer; reflux → esophageal cancer |
| Spontaneous errors | DNA replication mistakes that accumulate with age |
- Proto-oncogenes (the accelerator): Normal genes that promote cell growth. When mutated, they become oncogenes that are permanently switched ON - like a stuck gas pedal (e.g., RAS, MYC, HER2)
- Tumor suppressor genes (the brake): Normal genes that inhibit growth. When mutated/deleted, the brakes fail (e.g., TP53, RB, BRCA1)
Cancer develops when the accelerator gets stuck AND the brakes are cut - a cell is simultaneously told to grow without limit and told it cannot stop.
How Cancer Develops - The Multistep Process
Normal Cell
    ↓  1st mutation (e.g., in RAS oncogene)
Initiated Cell — slightly abnormal, fast-dividing
    ↓  2nd, 3rd mutations (e.g., TP53 lost, RB lost)
Pre-malignant Lesion — e.g., adenoma, dysplasia
    ↓  Further mutations (angiogenesis, invasion genes)
Invasive Cancer
    ↓  Additional mutations
Metastatic Cancer (spreads to liver, lung, brain, bone)
What Makes a Cancer Cell Different - The 8 Hallmarks
| Hallmark | What It Means |
|---|---|
| Sustaining proliferative signaling | Produces its own growth signals - no longer needs external "grow" commands |
| Evading growth suppressors | Ignores "stop dividing" signals from tumor suppressor genes |
| Resisting cell death | Refuses to undergo apoptosis (programmed death) - becomes immortal in practice |
| Enabling replicative immortality | Reactivates telomerase - can divide indefinitely without aging |
| Inducing angiogenesis | Grows its own blood supply by releasing VEGF and other factors |
| Activating invasion and metastasis | Breaks through tissue barriers and travels to distant organs |
| Deregulating cellular energetics | Switches to aerobic glycolysis (the "Warburg effect") - rapid energy for fast growth |
| Avoiding immune destruction | Hides from or disables the immune system (basis of immunotherapy targets like PD-L1) |
- Genomic instability - accelerates mutation rate (mutator phenotype)
- Tumor-promoting inflammation - inflammatory signals fuel all 8 hallmarks
Benign vs. Malignant - Quick Comparison
| Feature | Benign | Malignant (Cancer) |
|---|---|---|
| Growth rate | Slow | Fast |
| Capsule | Yes | No |
| Borders | Well-defined | Irregular, infiltrative |
| Local invasion | No | Yes |
| Metastasis | Never | Yes |
| Cell appearance | Normal-like | Abnormal (anaplasia) |
| Outcome | Usually curable | Can be fatal if untreated |
Types of Cancer
| Type | Tissue of Origin | Examples |
|---|---|---|
| Carcinoma (most common) | Epithelium (skin, glands, linings) | Lung, breast, colon, prostate, cervical |
| Sarcoma | Connective tissue (bone, muscle, fat) | Osteosarcoma, liposarcoma |
| Leukemia | Blood-forming cells in bone marrow | AML, CML, ALL |
| Lymphoma | Lymphocytes / lymphoid tissue | Hodgkin, Non-Hodgkin lymphoma |
| Myeloma | Plasma cells in bone marrow | Multiple myeloma |
| CNS tumors | Brain and spinal cord | Glioblastoma, meningioma |