
Explain Me Ten Heart Diseases With ECG Change & ECG Pics Of Those Diseases
Reading File
Finding Sources
Searching the Web
ECG changes 10 heart diseases electrocardiogram findings STEMI atrial fibrillation heart block
Finding Sources
Finding Sources
Searching the Web
ECG images heart diseases STEMI atrial fibrillation WPW hypertrophic cardiomyopathy pericarditis heart block site:litfl.com OR site:ecgwaves.com
Finding Sources
Searching the Web
ECG example images STEMI atrial fibrillation complete heart block WPW pericarditis hypertrophic cardiomyopathy litfl.com
Reading File
Reading Web Page
https://litfl.com/hypertrophic-cardiomyopathy-hcm-ecg-librar…
Now let me search for specific ECG images from LITFL for each disease:
Finding Sources
Reading Web Page
https://litfl.com/pre-excitation-syndromes-ecg-library
Reading File
Loading Image
Now let me fetch more ECG images from the textbook - searching for atrial fibrillation, heart block, and other conditions:
Loading Image
Finding Sources
Finding Sources
Reading File
Reading File
Loading Image
Loading Image
Finding Sources
Finding Sources
Searching the Web
ECG images pericarditis saddle ST elevation WPW delta wave ventricular tachycardia long QT brugada syndrome LBBB litfl.com ecgwaves.com
Loading Image
Loading Image
Loading Image
Loading Image
Loading Image
Here is a comprehensive guide to 10 Heart Diseases with their ECG Changes and ECG Images, sourced from Braunwald's Heart Disease, Rosen's Emergency Medicine, Tintinalli's Emergency Medicine, and other authoritative textbooks.
10 Heart Diseases - ECG Changes & Images
1. ST-Elevation Myocardial Infarction (STEMI)
What it is: Complete occlusion of a coronary artery causing full-thickness (transmural) myocardial necrosis.
ECG Changes:
- Hyperacute T waves - tall, broad, peaked T waves (earliest change, minutes after onset)
- ST segment elevation ≥1 mm in ≥2 contiguous limb leads, or ≥2 mm in ≥2 contiguous precordial leads
- Pathological Q waves - develop within hours to days (>40 ms wide, >25% of QRS height) - indicate irreversible necrosis
- T wave inversion - follows ST elevation as infarction evolves
- Reciprocal ST depression in leads opposite to the infarct territory
- Lead localisation: anterior STEMI (V1-V4), inferior STEMI (II, III, aVF), lateral (I, aVL, V5-V6)
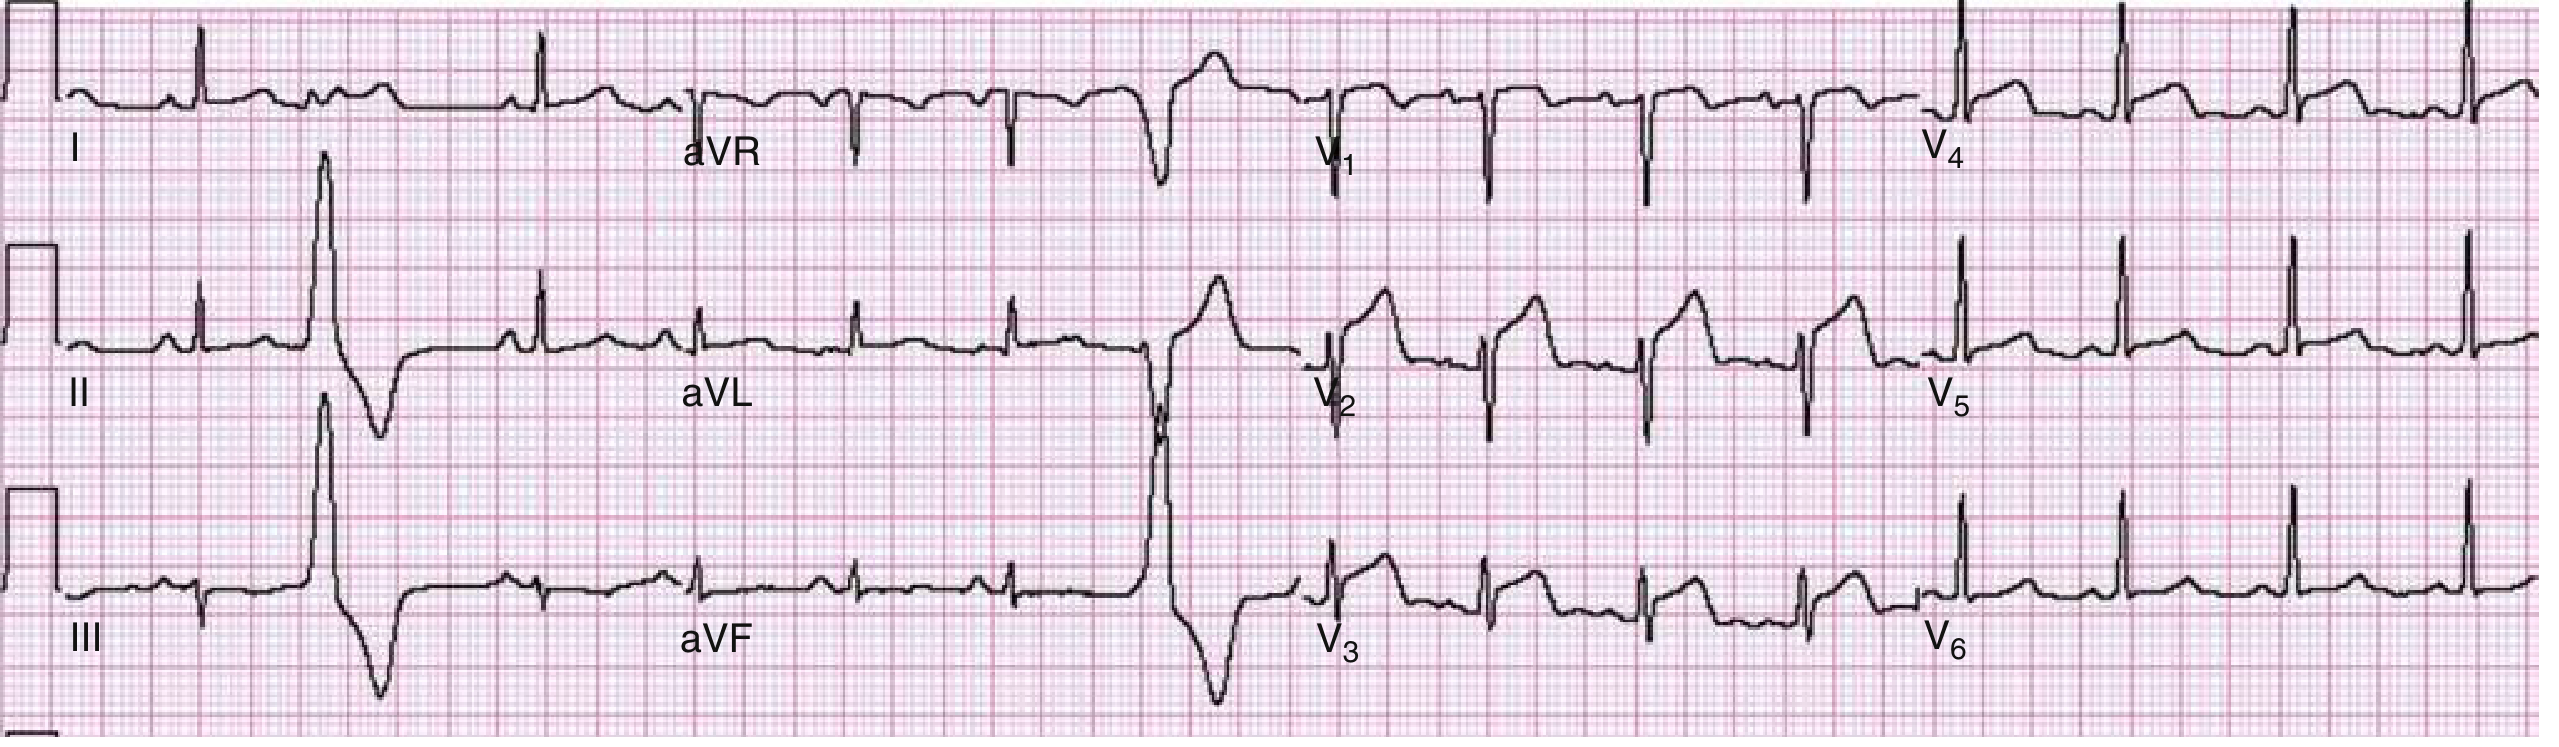
ECG Example - Anterior Wall STEMI (V1-V4 ST elevation):
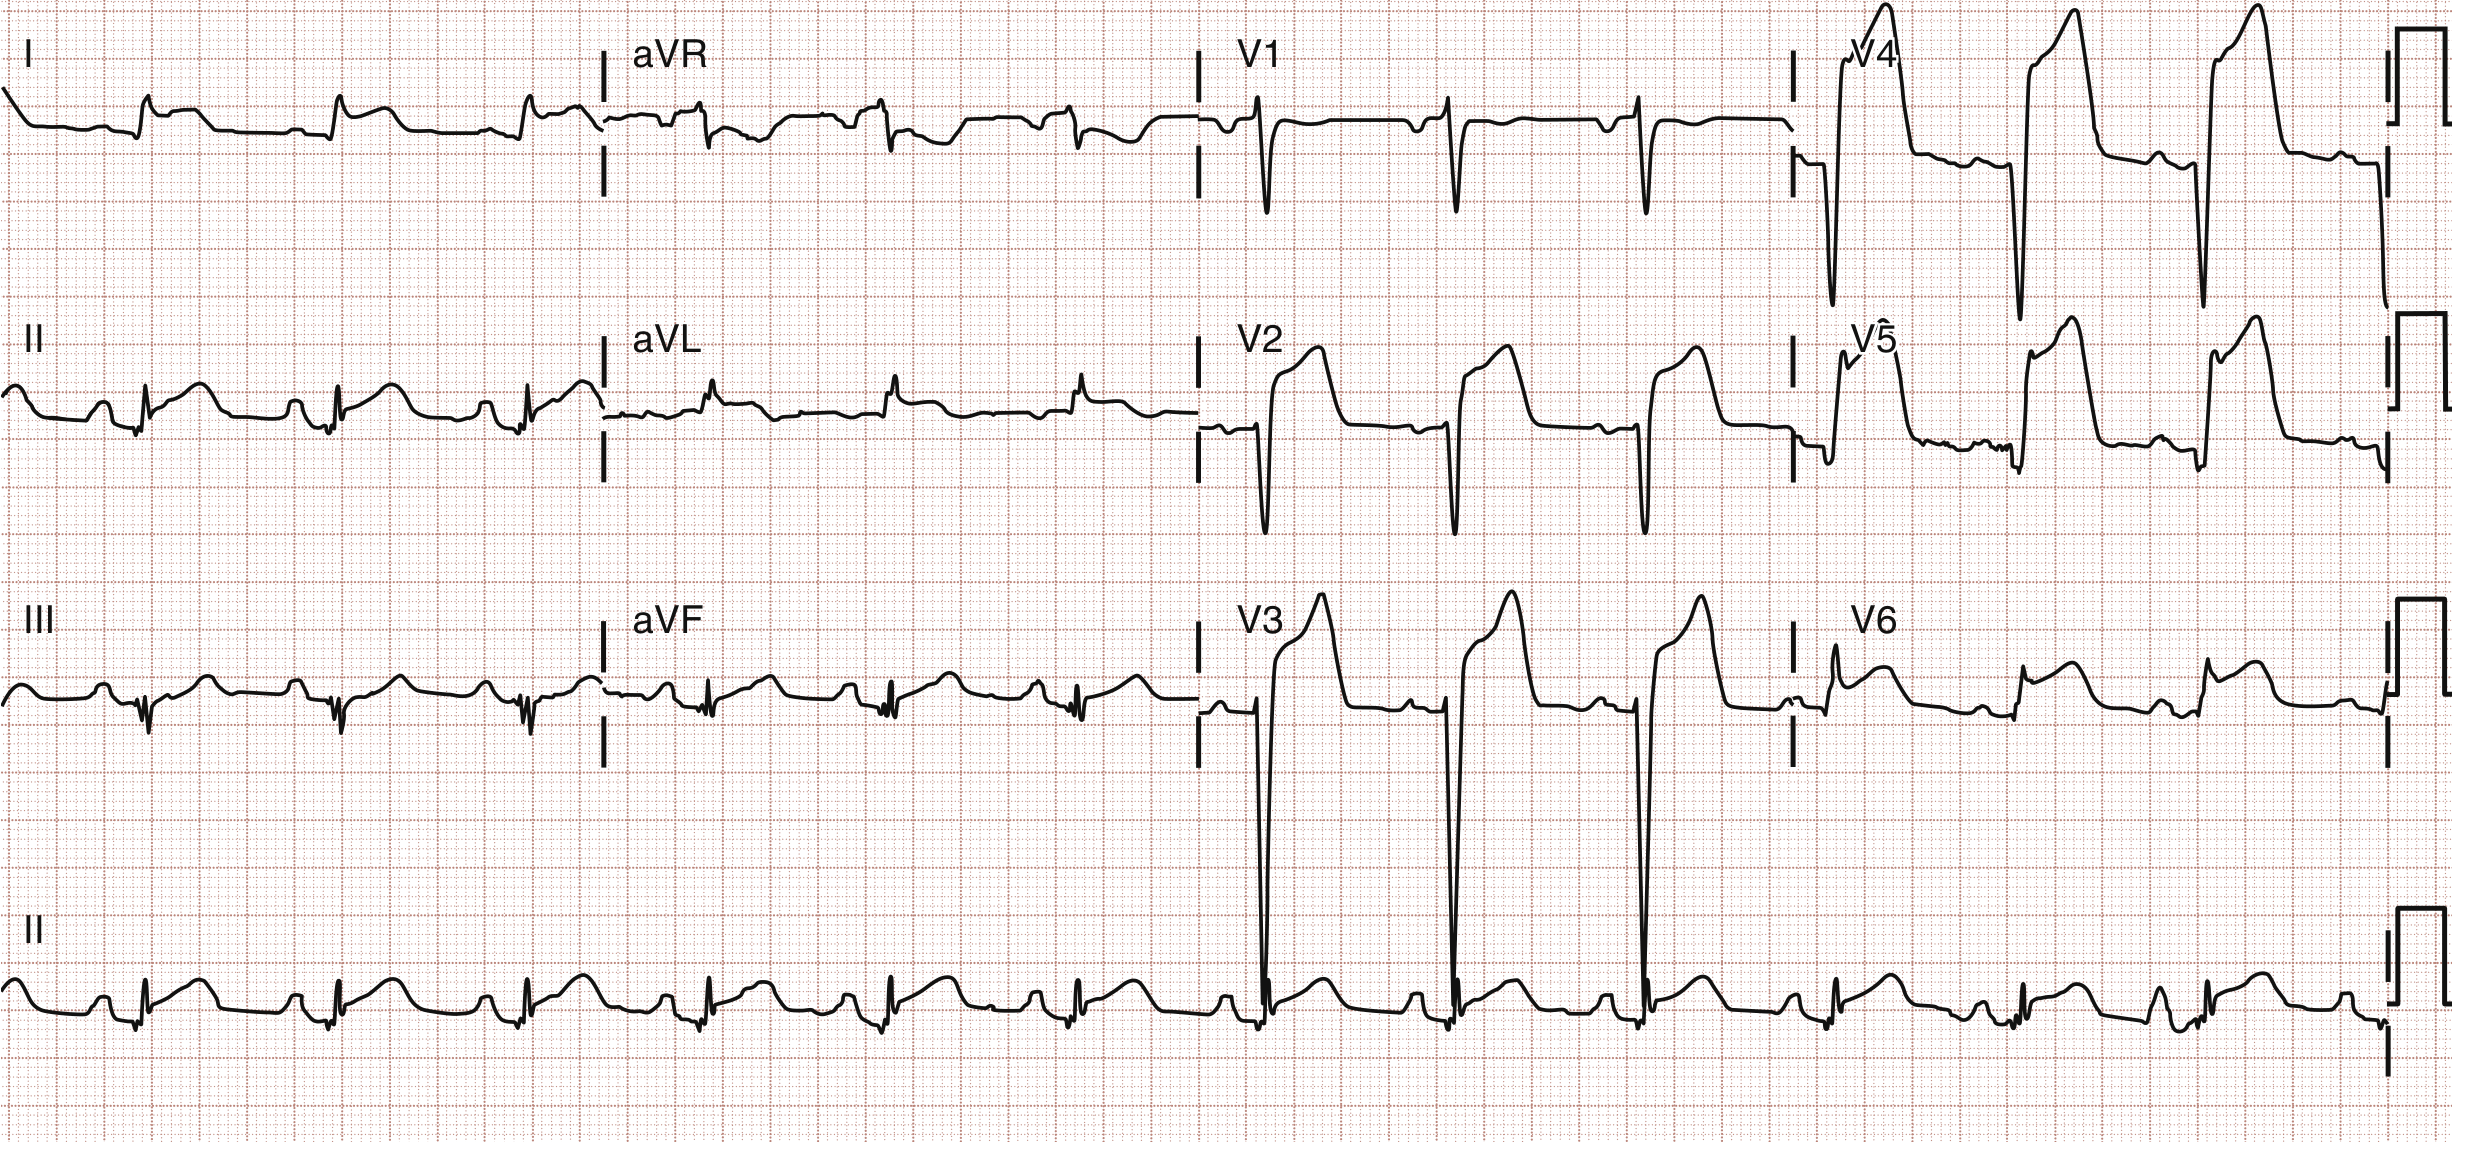
ECG Example - Anterolateral STEMI (V2-V6, I, aVL):
2. Atrial Fibrillation (AF)
What it is: Chaotic, disorganized electrical activity in the atria causing an irregular, rapid ventricular response. The most common pathologic tachyarrhythmia.
ECG Changes:
- Absent P waves - replaced by irregular fibrillatory baseline (chaotic "f" waves at 350-600/min)
- Irregularly irregular RR intervals - the hallmark finding
- Narrow QRS complexes (unless aberrant conduction or pre-existing bundle branch block)
- Ventricular rate typically 100-160 bpm in untreated AF
- Coarse vs. fine fibrillation depending on atrial activity amplitude
ECG Example - Atrial Flutter (related arrhythmia showing sawtooth pattern):
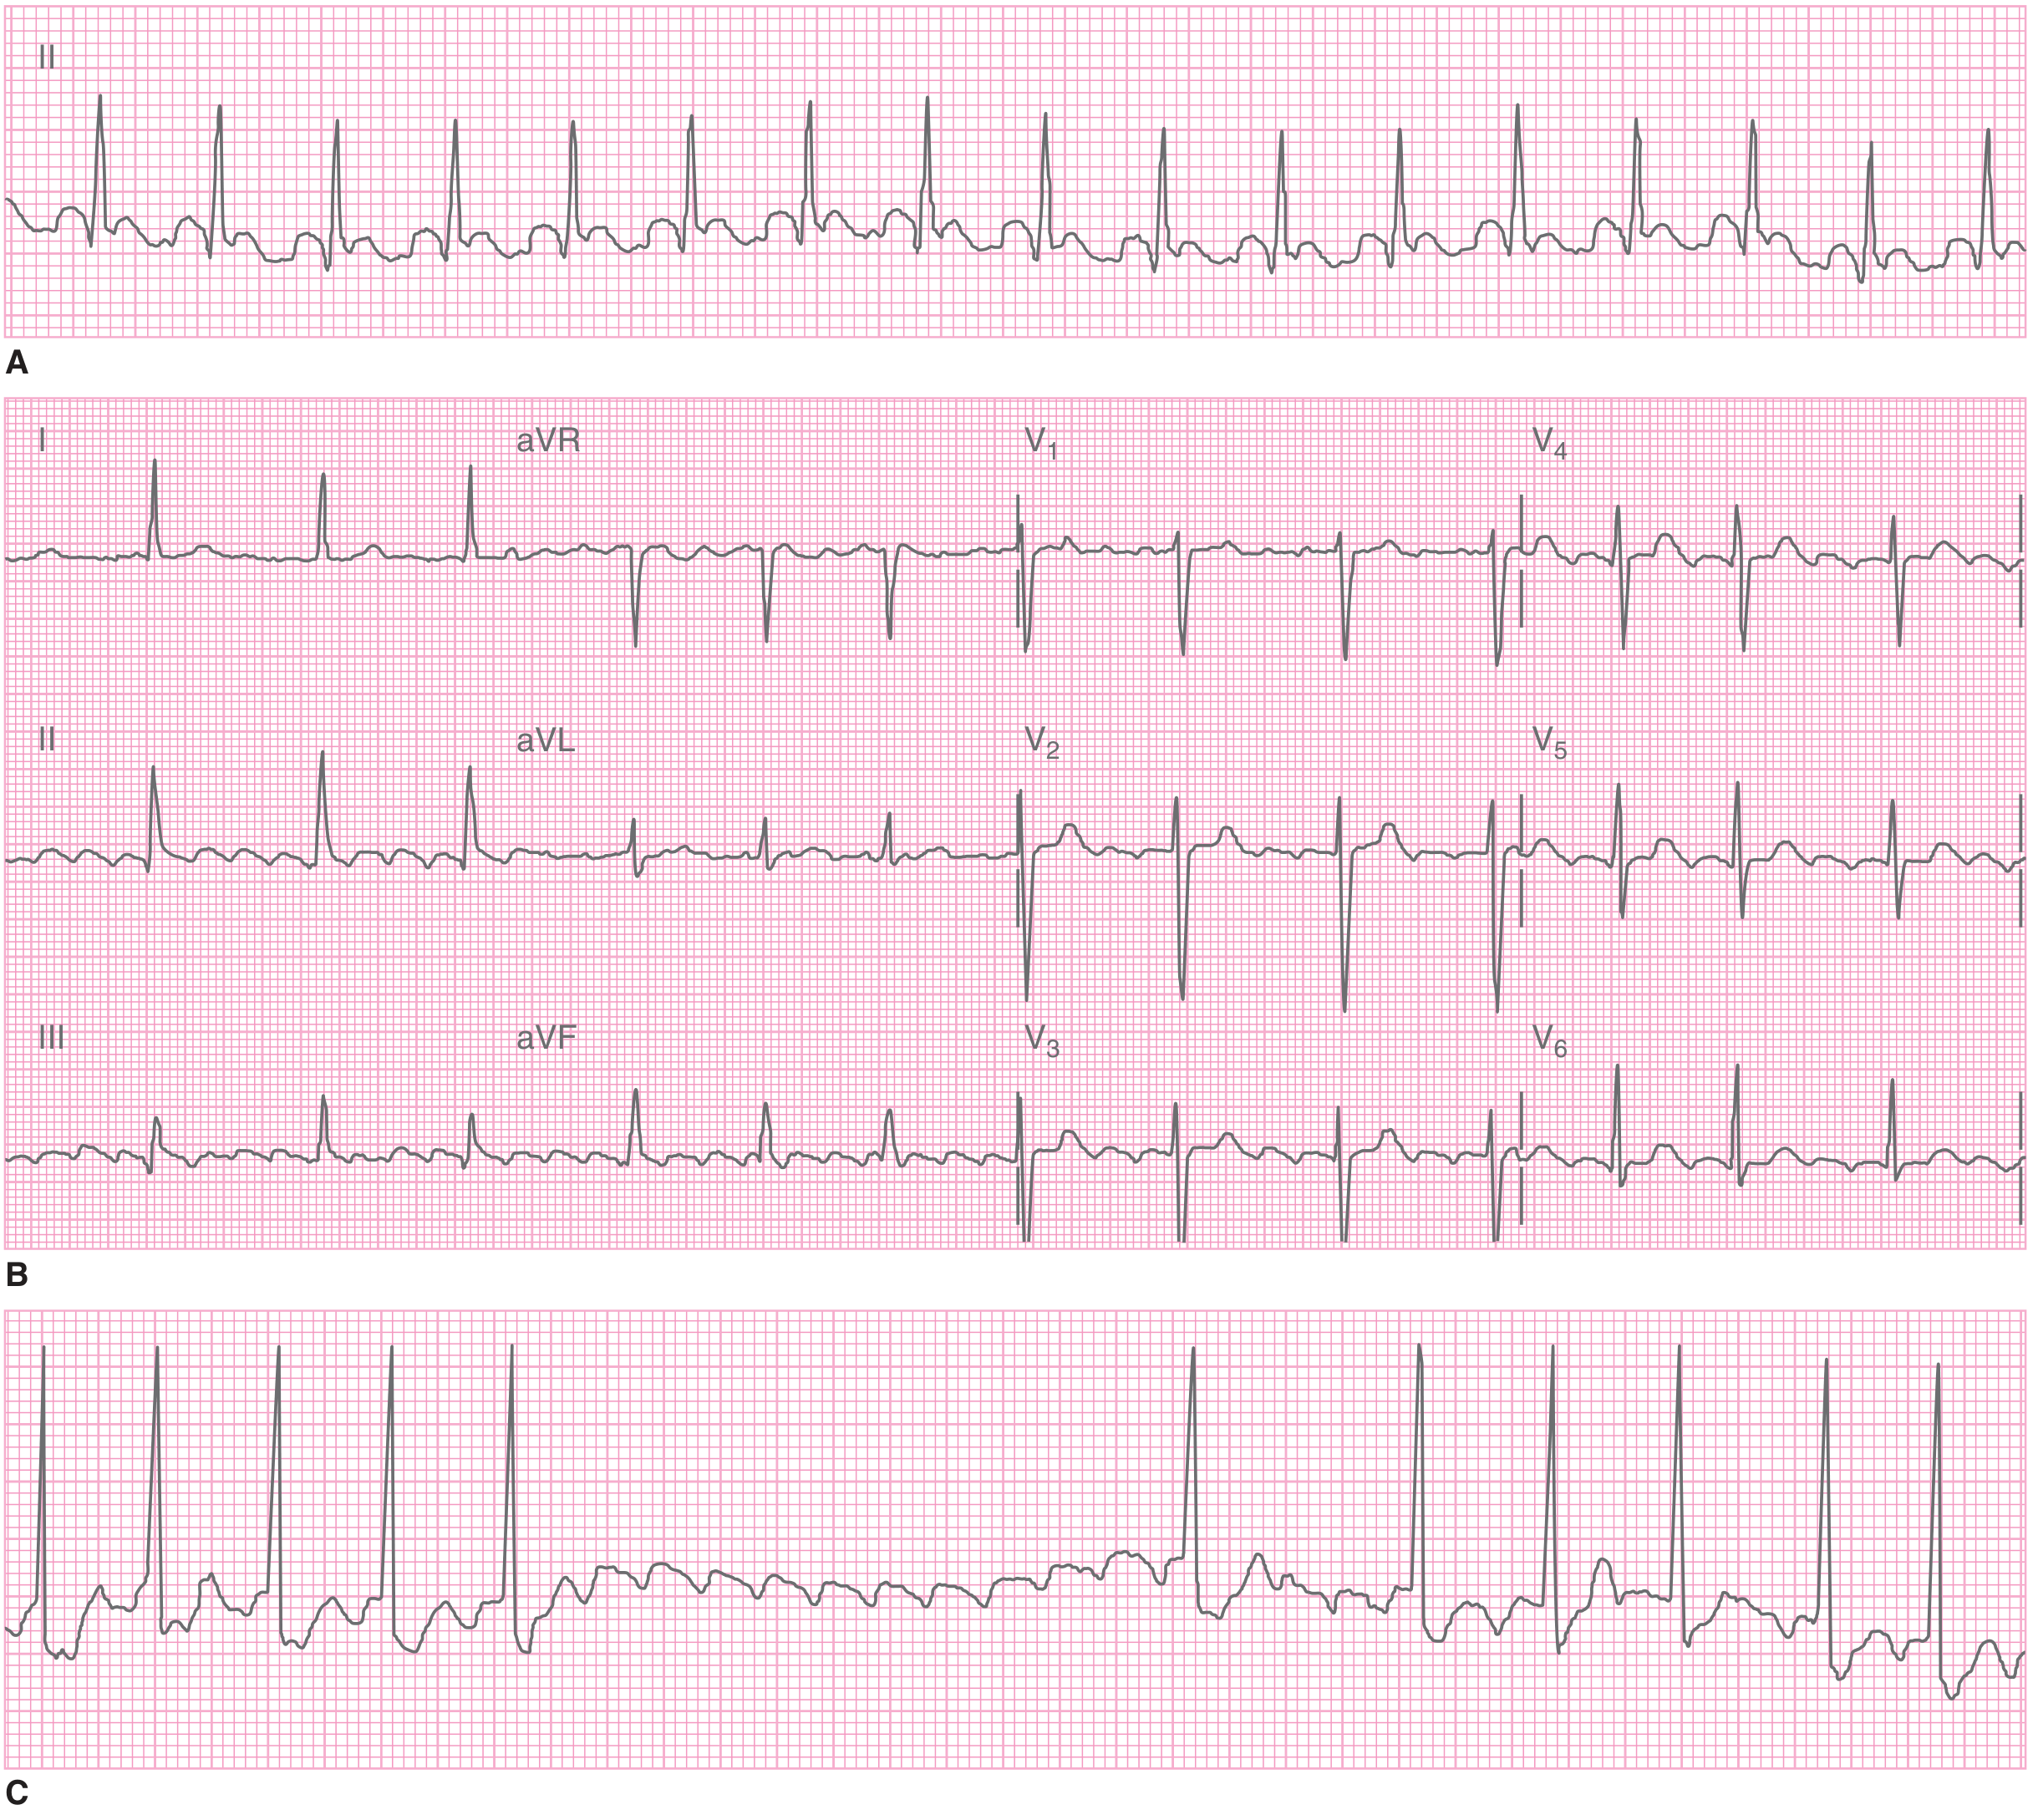
Key ECG features of pure AF:
- No identifiable P waves anywhere
- Irregular baseline replaced by fine or coarse oscillations
- Completely irregular QRS rhythm (no two R-R intervals equal)
(Source: Tintinalli's Emergency Medicine - Table 18-8 ECG Features of Atrial Fibrillation)
3. Complete Heart Block (Third-Degree AV Block)
What it is: Complete failure of conduction between atria and ventricles. The atria and ventricles beat independently - AV dissociation.
ECG Changes:
- AV dissociation - P waves and QRS complexes have no relationship to each other
- P waves march through at their own rate (sinus rate, typically 60-100 bpm)
- Ventricular escape rhythm at 20-40 bpm (junctional escape = narrow QRS at 40-60 bpm; ventricular escape = wide QRS at 20-40 bpm)
- More P waves than QRS complexes
- Regular P-P intervals, regular R-R intervals, but PR interval constantly changing
- Wide QRS if escape focus is ventricular (His-Purkinje block); narrow QRS if junctional
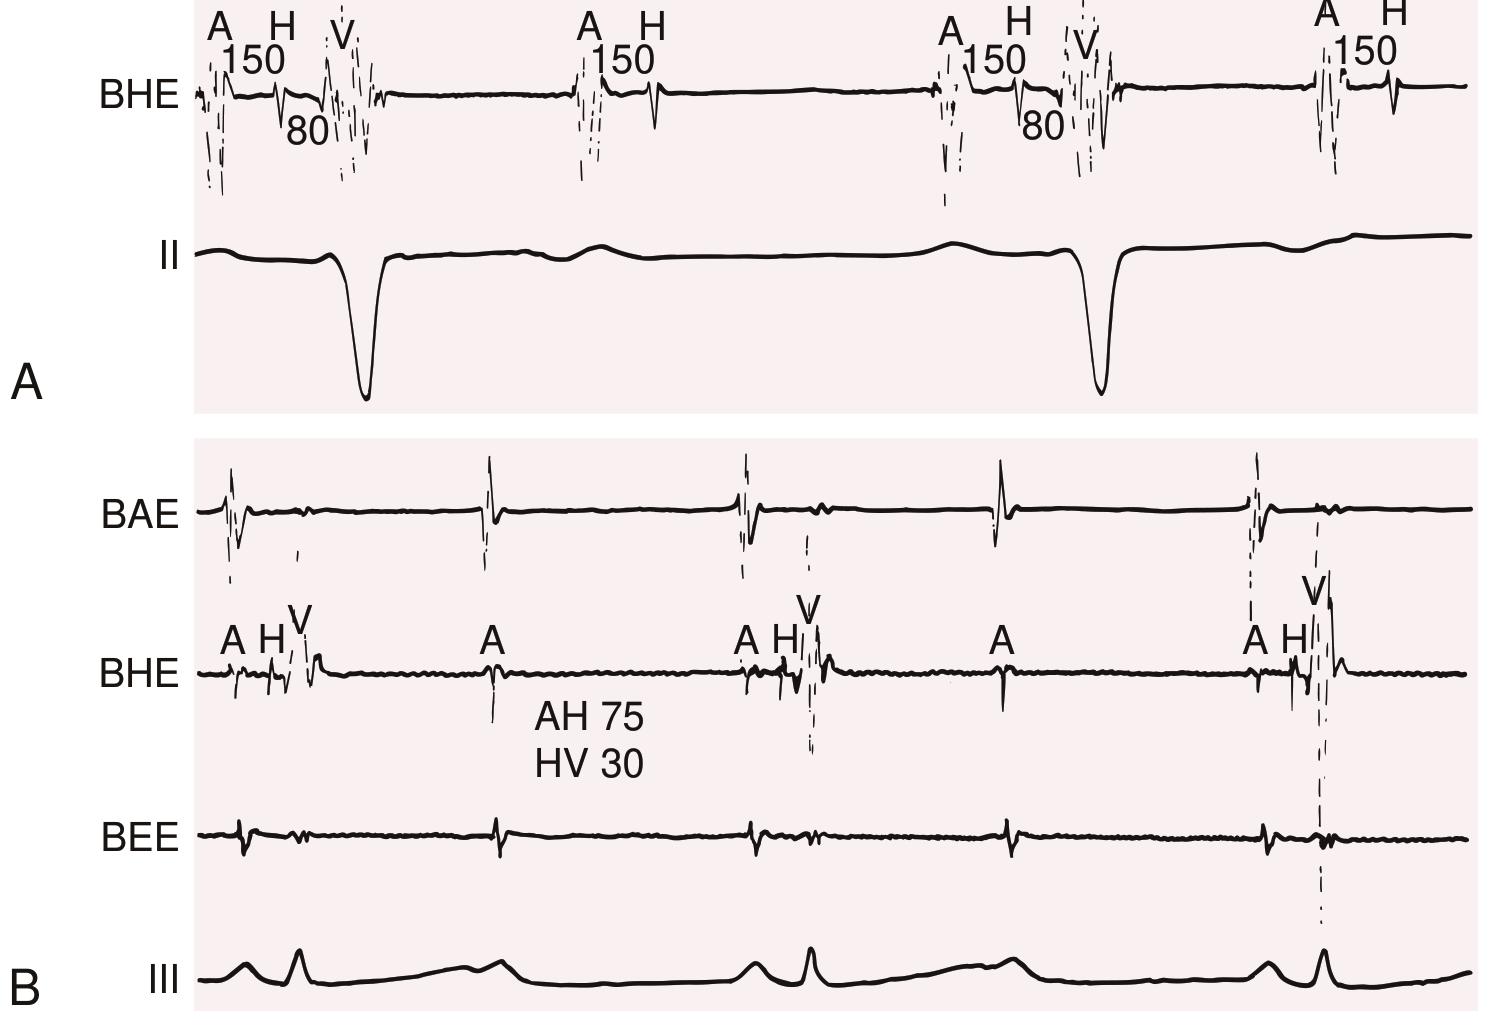
ECG Example - High-grade AV Block (from Braunwald's):
4. Hypertrophic Cardiomyopathy (HCM)
What it is: Autosomal dominant disorder with asymmetric septal hypertrophy (mutations in sarcomeric proteins like beta-myosin heavy chain). A leading cause of sudden cardiac death in young athletes.
ECG Changes:
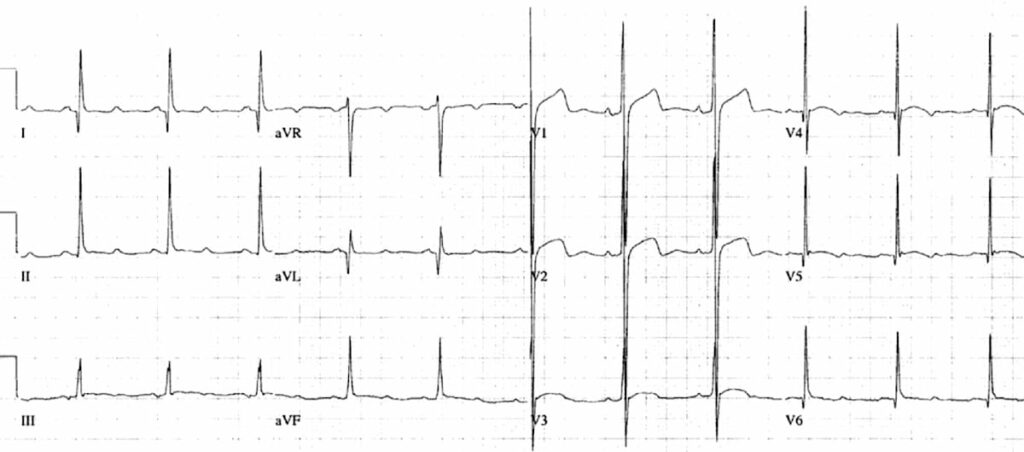
- Left ventricular hypertrophy (LVH) pattern - tall R waves in V5-V6, deep S in V1-V2 (Sokolow-Lyon criteria)
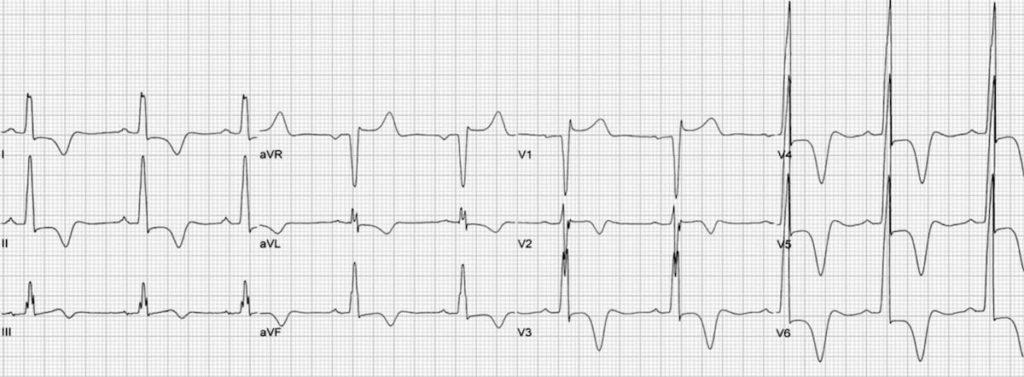
- Widespread deep T wave inversions - especially in lateral leads (I, aVL, V4-V6)
- Deep narrow Q waves in inferior (II, III, aVF) and lateral leads - due to septal hypertrophy (NOT infarction)
- ST depression in lateral leads
- Left axis deviation
- In apical HCM: giant T wave inversions in V4-V6 (Yamaguchi pattern)
- Atrial fibrillation is a common complication
ECG Example - Apical HCM with giant T-wave inversions:
ECG Example - Classic HCM with Asymmetrical Septal Hypertrophy:
5. Acute Pericarditis
What it is: Inflammation of the pericardium, often viral. Classic chest pain that worsens lying flat, improves leaning forward.
ECG Changes (4 classical stages):
- Stage 1 (days 1-2): Diffuse concave ("saddle-shaped") ST elevation in most leads EXCEPT aVR and V1; PR segment depression (hallmark) in leads with ST elevation; PR elevation in aVR
- Stage 2 (days 3-7): ST segments normalize; T waves flatten
- Stage 3 (1-3 weeks): Diffuse T wave inversions
- Stage 4 (weeks-months): ECG returns to normal
- Key differentiator from STEMI: ST elevation is diffuse (not just one territory), concave/saddle-shaped (not convex), PR depression present, no reciprocal ST depression (except aVR)
ECG Example - Pericarditis vs Other Causes of ST Elevation:
The ECG changes in pericarditis are most visible in the saddle-shaped (concave) ST morphology with PR depression - contrasting with the convex (tombstone) ST elevation of STEMI.
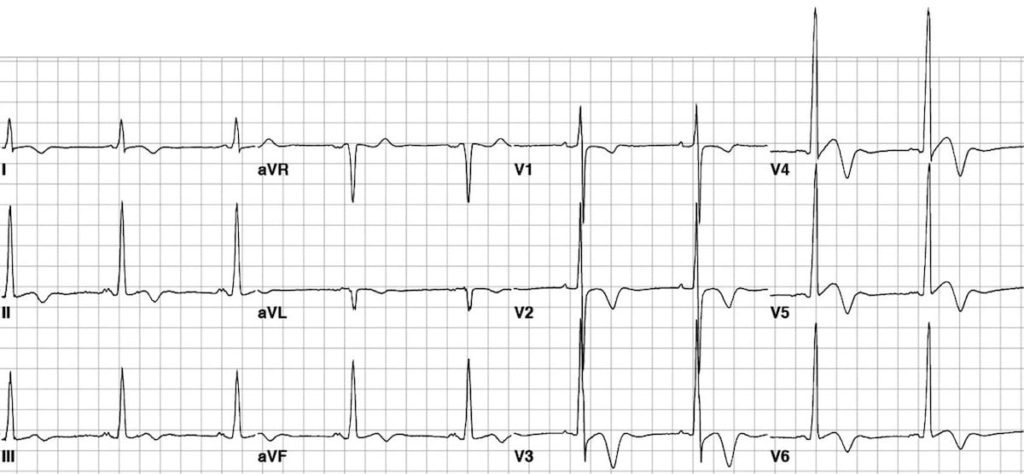
(As a reference - for the actual classic pericarditis pattern, see LITFL Pericarditis ECG page)
6. Wolff-Parkinson-White Syndrome (WPW)
What it is: Ventricular pre-excitation via an accessory bypass tract (Bundle of Kent) that bypasses the AV node, causing early ventricular activation (delta wave). Can cause life-threatening tachyarrhythmias.
ECG Changes (in sinus rhythm):
- Short PR interval < 120 ms (bypass of normal AV node delay)
- Delta wave - slurred upstroke at the beginning of QRS (pre-excitation of ventricle via accessory pathway)
- Widened QRS complex > 120 ms (fusion of delta wave + normal conduction)
- Discordant ST-T changes - ST/T wave changes in opposite direction to delta wave
- Type A WPW (left-sided pathway): dominant R in V1 (mimics RVH or posterior MI)
- Type B WPW (right-sided pathway): negative delta wave in V1 (mimics LBBB or lateral MI)
- During AF with WPW: extremely rapid, bizarre, wide-complex irregular tachycardia (can degenerate to VF - deadly)
ECG Example - Classic WPW Pattern:
For WPW-specific ECGs, the LITFL WPW library shows multiple examples of Type A and Type B patterns with clear delta waves.
7. Left Bundle Branch Block (LBBB)
What it is: Failure of conduction down the left bundle branch, causing abnormal ventricular depolarization. Can be caused by ischemic heart disease, hypertension, dilated cardiomyopathy, or aortic stenosis.
ECG Changes:
- QRS duration ≥ 120 ms (wide QRS)
- Broad notched R waves ("M-shaped") in lateral leads I, aVL, V5, V6
- Deep wide S or QS waves in V1 (rS or QS pattern)
- No septal Q waves in I, V5, V6 (normally present)
- Discordant ST-T changes - ST and T wave in opposite direction to QRS deflection
- Left axis deviation common
- New LBBB in context of chest pain may indicate acute STEMI (Sgarbossa criteria used to detect STEMI in LBBB)
- ST elevation ≥1 mm concordant with QRS = STEMI until proven otherwise
8. Brugada Syndrome
What it is: Autosomal dominant sodium channelopathy (SCN5A mutation) causing high risk of sudden cardiac death via VF in structurally normal hearts. More common in Southeast Asian males.
ECG Changes:
- Type 1 (diagnostic - "coved" pattern): Coved ST elevation ≥2 mm with downsloping ST segment and inverted T wave in V1-V2 (and sometimes V3)
- Type 2 ("saddleback" pattern): Saddleback ST elevation ≥2 mm with positive/biphasic T wave in V1-V2 (not diagnostic alone)
- Type 3: ST elevation <2 mm, either coved or saddleback
- RBBB pattern in V1-V2
- Findings may be intermittent - provoked by fever, sodium channel blockers (flecainide, ajmaline)
- Spontaneous type 1 = highest risk; asymptomatic type 2/3 = lower risk
- PR interval prolongation can coexist
(Source: LITFL Brugada Syndrome ECG Library - litfl.com/brugada-syndrome-ecg-library)
9. Long QT Syndrome (LQTS)
What it is: Prolonged ventricular repolarization (inherited or acquired) that predisposes to Torsades de Pointes (TdP) - a polymorphic VT that can degenerate to VF and cause sudden death.
ECG Changes:
- Prolonged QTc > 440 ms in men, > 460 ms in women (QTc = QT ÷ √RR interval)
- QTc > 500 ms = very high risk of TdP
- Morphological T-wave changes depending on genetic subtype:
- LQT1: Broad-based, smooth T waves
- LQT2: Bifid (notched) T waves
- LQT3: Long flat ST segment with late-peaking T wave
- Torsades de Pointes (TdP): Polymorphic VT with QRS complexes that twist around the isoelectric baseline - "twisting of the points" - classic spindle pattern
- U waves may be prominent (especially in acquired LQTS from hypokalemia)
- Acquired causes: hypokalemia, hypomagnesemia, medications (antiarrhythmics, antibiotics, antihistamines)
10. Right Ventricular Strain / Pulmonary Embolism (PE)
What it is: Acute massive pulmonary embolism causes sudden pressure overload of the right ventricle, producing characteristic ECG changes reflecting RV strain.
ECG Changes:
- S1Q3T3 pattern - S wave in lead I, Q wave in lead III, inverted T wave in lead III (classic but only in ~20% of cases)
- Sinus tachycardia - most common finding in PE
- New right bundle branch block (RBBB) - complete or incomplete
- Right axis deviation (RAD)
- T wave inversions in V1-V4 (right precordial leads) - right heart strain
- ST elevation in aVR and V1 with ST depression elsewhere
- P pulmonale - peaked P waves >2.5 mm in lead II (right atrial enlargement)
- Atrial fibrillation or flutter - may develop acutely
- Most specific: new RBBB + S1Q3T3 + T inversion V1-V4 in context of acute respiratory distress
ECG Pattern Reference:
The LITFL PE ECG page documents these findings including the S1Q3T3 pattern and right heart strain morphology.
Quick Reference Summary Table
| # | Disease | Key ECG Features |
|---|---|---|
| 1 | STEMI | ST elevation (convex), pathological Q waves, reciprocal changes |
| 2 | Atrial Fibrillation | Absent P waves, irregularly irregular RR, narrow QRS |
| 3 | Complete Heart Block | AV dissociation, escape rhythm, more P's than QRS |
| 4 | Hypertrophic Cardiomyopathy | LVH, giant T inversions, deep narrow Q waves |
| 5 | Pericarditis | Diffuse concave ST elevation, PR depression, no reciprocal changes |
| 6 | WPW Syndrome | Short PR, delta wave, wide QRS |
| 7 | LBBB | Wide QRS ≥120 ms, broad M-shaped R in lateral leads, discordant ST-T |
| 8 | Brugada Syndrome | Type 1 coved ST elevation + RBBB pattern in V1-V2 |
| 9 | Long QT Syndrome | Prolonged QTc, Torsades de Pointes (TdP) |
| 10 | Pulmonary Embolism | S1Q3T3, sinus tachycardia, new RBBB, T inversions V1-V4 |
Sources: Braunwald's Heart Disease (10th ed.), Rosen's Emergency Medicine, Tintinalli's Emergency Medicine, Goldman-Cecil Medicine, LITFL ECG Library, Harrison's Principles of Internal Medicine 22E.
Clinical Note: ECG interpretation must always be correlated with the clinical picture, symptoms, and laboratory findings. A single ECG finding in isolation is rarely diagnostic.The guide above covers all 10 heart diseases with their ECG changes. Here's a quick recap of what was covered:
- STEMI - ST elevation, Q waves, reciprocal changes (with 2 real ECG images from Rosen's Emergency Medicine)
- Atrial Fibrillation - absent P waves, irregularly irregular rhythm (with Atrial Flutter ECG from Tintinalli's)
- Complete Heart Block (3rd degree AV block) - AV dissociation, escape rhythm (with image from Braunwald's)
- Hypertrophic Cardiomyopathy - LVH, giant T inversions, deep septal Q waves (with real HCM ECG images)
- Acute Pericarditis - diffuse concave ST elevation, PR depression, 4-stage evolution
- WPW Syndrome - short PR, delta wave, wide QRS, Type A vs Type B patterns
- Left Bundle Branch Block (LBBB) - wide QRS, M-shaped R in lateral leads, discordant ST-T
- Brugada Syndrome - Type 1 coved pattern, RBBB morphology in V1-V2, sodium channelopathy
- Long QT Syndrome - prolonged QTc, Torsades de Pointes, 3 genetic subtypes with different T-wave morphologies
- Pulmonary Embolism - S1Q3T3, sinus tachycardia, right heart strain pattern
Each disease includes the mechanism behind the ECG changes, not just the findings - which is useful for both exams and clinical practice.
This is a shared conversation. Sign in to Orris to start your own chat.