
I will send you my research and you have to make an outstanding presentation of it
- What's the topic?
- How many slides do you want (approximately)?
- Any preferred style - formal/academic, modern/minimalist, bold/visual?
- Who's the audience - professors, colleagues, clients, general public?
Outbreak Investigations in the Modern Era: A Comparative Analysis of COVID-19 and Ebola Presented by:Shahab Group:Med21C Abstract The COVID-19 pandemic caused by SARS-CoV-2 and the recurring Ebola virus disease (EVD) outbreaks across sub Saharan Africa represent two defining health crises of the twenty first century. Both events severely strained global public health systems and field response networks. Although driven by fundamentally different pathogens and unfolding in vastly different socio economic environments, both followed a shared epidemiological path: identifying early cases, setting clinical boundaries, tracing contact chains, analyzing field data, and executing control measures to stop onward transmission. This paper presents a comparative analysis of those investigative paths. By evaluating how core field epidemiology principles were applied and where operational bottlenecks occurred across both diseases, we show how real world field experience directly shapes future pandemic response strategies. Keywords:COVID-19, SARS-CoV-2, Ebola virus disease, epidemic investigation, case identification, contact tracing, data analysis, outbreak control measures, public health surveillance. 1. Introduction Late in December 2019, epidemiologists monitoring unusual pneumonia clusters in Wuhan, China, faced a completely unfamiliar threat. There was no established playbook, no known pathogen, and little indication of what was about to unfold. Within three months, the World Health Organization (WHO) declared a global pandemic, and COVID-19 transformed daily life across the globe. Ebola, on the other hand, was an established threat when it re emerged in Guinea in late 2013 before spreading rapidly across West Africa through 2014 to 2016. That wave grew into the largest EVD epidemic on record, claiming over 11,325 lives out of 28,600 documented cases in Guinea, Sierra Leone, and Liberia a death toll roughly triple that of all prior Ebola outbreaks combined (Osungbade & Oni 2014). Less than a decade later in February 2021 Ebola surfaced in Guinea once again. Coming at the height of the COVID-19 pandemic, it forced local healthcare teams to battle two distinct viral threats on a single, overburdened health system (Balde et al.2021). Despite key differences in transmission modes and mortality rates field epidemiology provided the underlying structure for both responses. The core objectives of an outbreak investigation remain identical regardless of the pathogen: Quantify the outbreak across time, place, and person. Pinpoint the environmental and biological drivers of spread. Isolate the causative agent and track its transmission routes. Implement targeted public health measures to prevent further cases (Park 2017, pp. 150–151). This paper evaluates how these investigative stages played out on the ground, comparing where field methods succeeded and where systemic limits were pushed during the COVID-19 and Ebola responses. 2. Pathogen Profiles: Two Distinct Operational Challenges Every field investigation is shaped by the underlying biology of the pathogen. The stark differences between SARS-CoV-2 and Ebola virus dictated everything from initial case definitions to how long contacts had to be monitored. Feature SARS-CoV-2 (COVID-19) Zaire ebolavirus (EVD) Primary Route Respiratory droplets & aerosols Direct contact with infectious body fluids Incubation Period 2 to 14 days (average 5 to 6 days) 2 to 21 days Asymptomatic Spread Widespread and frequent Non existent (only symptomatic spread) Basic Reproduction (R_0) 2.0 to 3.0 (ancestral); higher in variants 1.5 to 2.5 Case Fatality Rate~1 to 2% global average 40 to 70% (setting dependent) Contact Follow-up Window 14 days b 21 days SARS-CoV-2 is an airborne betacoronavirus. A key driver of its spread is that infected individuals routinely shed viral particles before showing symptoms or without ever developing symptoms at all. This silent transmission hindered standard field containment efforts. While the basic reproduction number (R_0) for the ancestral strain sat around 2.0 to 3.0, later variants like Delta and Omicron spread far more easily. Case fatality rates varied based on population age and hospital capacity, averaging around 1–2% over the course of the pandemic (Bulut & Kato 2020 Singhal 2020). Ebola Virus Disease (EVD)spreads exclusively through direct physical contact with bodily fluids, secretions, or organs of infected individuals showing symptoms, as well as those who have died from the disease. Asymptomatic carriage does not lead to transmission. The 21 day incubation period means monitoring windows must cover three full weeks. EVD carries extreme mortality: the 2000 outbreak in Gulu, Uganda, recorded a 53% case fatality rate (Okware et al. 2002) while the 2014 to 2016 West African outbreak saw fatality rates between 40% and 70%. Because deceased bodies remain highly infectious, traditional funeral customs that involved physical contact became major amplification points (Bouba et al.2023). These biological traits led to very different operational strategies. COVID-19 called for population wide non pharmaceutical interventions (NPIs) and a 14 day isolation period. Ebola demanded strict individual isolation, 21 days of contact monitoring, and specialized, safe burial procedures (Mazza et al. 2021). 3. Stage 1: Verifying the Diagnosis and Confirming the Outbreak 3.1 COVID-19 China’s surveillance systems first flagged an unusual cluster of pneumonia cases on December 31, 2019. Clinical symptoms fever, dry cough, shortness of breath, and bilateral lung infiltrates on CT scans warranted immediate field action. Confirming the underlying agent however required isolating the novel virus in a laboratory setting. WHO partnered with national authorities in early January 2020, and diagnostic labs quickly identified a novel betacoronavirus, later named SARS-CoV-2. Confirming an epidemic requires establishing that observed cases exceed baseline expectations for a given period and population (Park 2017). In Wuhan, the sudden surge in severe atypical pneumonia cases far outpaced seasonal respiratory baselines confirming an active outbreak. 3.2 Ebola Confirming an Ebola outbreak relies on strict clinical criteria coupled with reference laboratory validation. During the 2000 outbreak in Uganda, reports of unexplained fever accompanied by hemorrhagic signs led the Ministry of Health, working with WHO and CDC, to implement a four tiered case classification: alert, suspected, probable, and confirmed (Okware et al. 2002). Laboratory confirmation relies on reverse transcription polymerase chain reaction (RT-PCR) testing of blood samples. These are ideally drawn at least three days after symptom onset, when viral loads are high enough for reliable detection. Official guidelines specify that local RT-PCR results remain presumptive until verified by central reference laboratories, using whole blood collected in EDTA tubes (Washington State DOH, 2014). When Ebola re emerged in Guinea in 2021, response teams repurposed diagnostic PCR equipment originally set up for COVID 19 an example of infrastructure built for one pandemic serving an immediate secondary threat (Balde et al. 2021). In both scenarios, field teams followed an essential rule of epidemiology: ground investigations and containment efforts must begin immediately alongside lab work, rather than waiting for formal diagnostic results. 4. Stage 2: Establishing the Case Definition A clear case definition gives field teams the exact clinical, laboratory, and epidemiological criteria needed to identify and count cases consistently. 4.1 COVID-19 Case Definition The WHO updated its COVID19 case definition nine times between early 2020 and mid 2022 as clinical insights expanded (WHO COVID 19 Surveillance Database 2022). In its mature form a confirmed case required either: 1. A positive Nucleic Acid Amplification Test (NAAT such as RT-PCR) regardless of symptom status. 2. Meeting clinical or epidemiological criteria alongside a positive rapid antigen test (Ag-RDT). An exposed contact was defined as anyone facing a confirmed case within one meter for at least 15 minutes having direct physical contact or experiencing unprotected exposure to infectious secretions within 48 hours prior to symptom onset (or positive test date for asymptomatic cases). 4.2 Ebola Case Definition Ebola investigative frameworks use a tiered classification to catch potential cases early (Okware et al. 2002): Alert Case: Anyone with an unexplained fever in an active outbreak zone. Suspected Case: Unexplained fever combined with at least three systemic symptoms (headache, vomiting, diarrhea, abdominal pain, muscle pain, or unexplained bleeding) plus an epidemiological link. Probable Case: A suspect case with a clear epidemiological link to a confirmed case, but lacking laboratory testing. Confirmed Case:A suspect or probable case backed by positive laboratory RNA or antigen detection. This tiered system lets field teams isolate patients and start contact tracing while laboratory results are still pending. 5. Stage 3: Active Case Finding and Contact Tracing 5.1 Active Case Finding and Field Surveys Standard investigation protocols require field teams to actively search for unreported cases rather than waiting for sick individuals to seek care (Park 2017). Case Investigation Forms:Standardized forms capture key details: demographics, travel history, symptom onset, public gatherings attended, and contact lists. Field Execution: During the West African Ebola response, community healthcare workers and local leaders conducted door to door visits to spot sick individuals and build trust (Okware et al. 2002). For COVID-19, active case finding expanded to include mass testing sites, symptom hotlines, and environmental tools such as analyzing SARS-CoV-2 RNA levels in urban wastewater to catch rising infection rates before clinical admissions surged (Prandi et al. 2022). 5.2 Contact Tracing Strategies Ebola Field Operations: Direct fluid transmission requires strict ground-level contact tracing. Every contact linked to a confirmed or probable case must be visited daily in person for 21 days. In the 2000 Gulu outbreak tracking nearly 5,000 contacts kept the secondary attack rate down to 2.5%, demonstrating the power of rapid field tracking (Okware et al. 2002). Mathematical models confirm that combining isolation, contact tracing, and safe burials can control EVD outbreaks even without vaccines (Bouba et al. 2023). COVID 19 Field Operations: Airborne spread and asymptomatic transmission made contact tracing far more complex. Many countries launched Digital Contact Tracing (DCT) apps using Bluetooth proximity signals. However, reviews showed widely varying adoption rates (0.01% to 58.3% and little direct evidence that digital apps independently reduced community spread (Mazza et al. 2021). Manual contact tracers who understood local community dynamics proved indispensable. In both crises healthcare facilities became transmission nodes when infection control broke down. Unprotected healthcare workers contracted infections early in both outbreaks due to personal protective equipment (PPE) shortages or delayed clinical identification. 6. Stage 4: Defining the Risk Population and Building Line Lists Calculating accurate attack rates and fatality rates depends on establishing a clear population denominator. In the Gulu Ebola outbreak, the attack rate across Gulu district was 12.6 per 10,000 residents when counting all reported contacts but dropped to 4.5 per 10,000 when limited strictly to contacts of lab confirmed cases (Okware et al. 2002). This contrast demonstrates how denominator selection directly alters perceived outbreak severity. For COVID-19, determining the population at risk required population wide serological surveys to calculate true Infection Fatality Rates (IFR) alongside Case Fatality Rates as routine testing missed large numbers of mild or asymptomatic cases. Seroprevalence studies such as those conducted in Somalia provided baseline exposure estimates in settings with limited clinical testing infrastructure (Hossain et al. 2023). The line list serves as the core database for the investigation team. Organized with individual cases as rows and key demographic, clinical, spatial, and diagnostic details as columns line lists allow teams to filter sort and track data in real time. 7. Stage 5: Analyzing the Data (Time, Place, and Person) 7.1 Time: Epidemic Curves Plotting cases by onset date generates an epidemic curve (epi curve) that reveals the underlying transmission pattern (Park 2017): Point Source Outbreaks create a sharp, single peak spanning roughly one incubation period. This pattern was common in early single exposure COVID-19 clusters such as those in workplaces or restaurants. Propagated Outbreaks show successive waves corresponding to person to person spread typical of both the 2014 2016 Ebola epidemic and the broader COVID-19 pandemic. In Ebola outbreaks the epi curve determines when an outbreak is officially declared over: 42 days (two maximum incubation periods) after the last confirmed case tests negative. For COVID-19 epi curves tracked the impact of public health mandates and variant surges. Integrating whole genome sequencing (genomic epidemiology) with field data allowed researchers to map specific viral transmission chains through healthcare facilities and communities (Lorenzo Redondo et al., 2021). 7.2 Place: Geographic Mapping Geographic mapping isolates spatial clusters and transmission corridors. During the West African Ebola outbreak GIS mapping tracked movement along transit routes connecting Gueckedou in Guinea to Conakry as well as border crossings into Sierra Leone and Liberia. Spatial data guided the placement of Ebola Treatment Units (ETUs) and enhanced surveillance at key border nodes. For COVID-19, spatial analysis highlighted disease density in urban areas, long term care facilities and transit hubs. Wastewater surveillance added a spatial dimension detecting SARS CoV 2 RNA in municipal catchments 5 to 7 days before clinical case surges reached regional hospitals (Prandi et al., 2022). 7.3 Person: Demographic Risk Patterns Stratifying data by demographic traits highlights high-risk groups: COVID-19:Age emerged as the strongest predictor of severe illness and death. Adults over 65 and individuals with pre existing metabolic or cardiovascular conditions faced significantly higher mortality rates. Males consistently exhibited higher case fatality rates across global cohorts. High occupational risks were documented among healthcare personnel, transit workers, and food processing staff. Ebola: In the 2000 Uganda outbreak women experienced higher overall attack rates, largely due to traditional caregiving roles that placed them in close contact with sick family members and infectious bodies during funeral preparations (Okware et al. 2002). Addressing traditional burial practices required open community engagement rather than simple enforcement. 8. Stage 6: Formulating and Testing Hypotheses Epidemiologists combine time,place, and person data to build and test hypotheses about exposure sources and transmission routes (Park 2017). For COVID-19, early investigations focused on potential zoonotic spillover at the Huanan Seafood Market alongside airborne and respiratory droplet transmission routes. Cluster investigations in enclosed settings (e.g.call centers,indoor choir rehearsals) confirmed airborne transmission in poorly ventilated spaces, leading to updated guidelines on ventilation and outdoor gatherings. Genomic sequencing combined with field tracking verified airborne spread within hospital wards, prompting upgrades to personal protective protocols (Lorenzo Redondo et al., 2021). For Ebola, field investigations linked index cases to exposure to wild animal reservoirs, particularly fruit bats and non human primates. Secondary spread via direct fluid contact was confirmed through cluster analysis. Post outbreak ecological modeling showed that the geographic risk for Ebola in West Africa matched historical risk zones in Central Africa, proving that spillover events were ecologically predictable with proper surveillance (Khandaker et al. 2022). 9. Stage 7: Evaluating Ecological Factors Outbreaks do not occur in a vacuum social, structural, and environmental conditions shape their path. The 2014 West African Ebola epidemic revealed major systemic vulnerabilities: underfunded public health systems limited diagnostic capacity in rural regions deep community mistrust, and inadequate communication networks. The epidemic showed that field epidemiology cannot succeed without functional health infrastructure and community buy in (Osungbade & Oni, 2014). For COVID-19, international travel networks and high urban density accelerated viral spread. In low and middle income countries, informal housing, daily wage reliance, and delayed vaccine access complicated standard containment measures. Both emergencies highlighted the necessity of a "One Health" framework integrating human, animal, and environmental monitoring to catch spillover risks early (Khandaker et al., 2022). 10. Stage 8: Implementing Control Measures Control interventions across both pathogens fall into three primary categories: source control, host protection, and environmental management. 10.1 Ebola Control Measures Case Isolation:Isolating symptomatic patients in dedicated Ebola Treatment Units (ETUs) remains the single most effective way to interrupt transmission (Bouba et al. 2023). Safe and Dignified Burials:Trained burial teams performed interments that prevented direct body contact while respecting local cultural customs. Active Contact Tracing:Daily 21 day tracking of exposed contacts interrupted secondary transmission chains. During Guinea’s 2021 outbreak, field teams maintained 21 day Ebola tracking alongside 14 day COVID-19 protocols (Balde et al. 2021). Community Engagement:Working with local religious leaders, village elders, and trusted figures helped counter misinformation and encourage prompt case reporting. Vaccination:Deploying the rVSV ZEBOV vaccine via ring vaccination strategies provided strong protection during recent outbreaks in the Democratic Republic of the Congo, though containment of non Zaire strains still relies primarily on core public health interventions (Bouba et al. 2023). 10.2 COVID-19 Control Measures Non-Pharmaceutical Interventions (NPIs): Early containment relied on physical distancing, mask mandates, ventilation upgrades, travel restrictions, and targeted lockdowns. Targeted Testing and Isolation: Decentralized testing networks utilized RT PCR and Ag RDTs to carry out Test, Trace, Isolate protocols. Digital and Environmental Tools:Wastewater monitoring gave community level viral visibility, while digital contact tracing apps provided supplementary data where adoption was high (Mazza et al.2021). Vaccination Rollout:Developing and distributing mRNA, viral vector, and protein subunit vaccines served as a primary control measure. International surveillance dashboards tracked vaccination coverage and real world vaccine performance (WHO COVID-19 Surveillance Database, 2022). Global Coordination:The International Health Regulations (IHR 2005) provided the reporting framework, though the pandemic highlighted areas needing improved international data sharing and resource equity. 11. Comparative Lessons: Key Outbreak Insights The concurrent management of COVID-19 and Ebola in 2021 highlighted important field insights: 1. Protocol Adaptability:Field protocols refined during the 2014–2016 Ebola response provided the baseline framework for initial COVID-19 field procedures, adapting parameters such as quarantine duration to match pathogen biology (Balde et al. 2021). 2. Shared Laboratory Capacity:Diagnostic platforms installed for SARS-CoV-2 testing in Guinea were quickly repurposed to process Ebola samples in 2021, showing how broad diagnostic investments pay off across different threats (Balde et al.2021). 3. Importance of Community Trust:Compliance with quarantine, testing, and safety protocols depended heavily on public trust across both rural African villages and major metropolitan centers. 4. Epidemiological Modeling in Action:Mathematical modeling shifted from theoretical research to real time operational planning, guiding policy decisions on intervention strategies and hospital capacity needs (Bouba et al., 2023). 5. Genomic Surveillance Integration:Next generation sequencing provided rapid insight into viral evolution, transmission chains, and superspreading events, supporting standard field investigations on the ground (Lorenzo Redondo et al. 2021). 12. Conclusion Field epidemiology is a flexible, pragmatic discipline carried out under pressure, often with incomplete information. The core steps of an investigation verifying diagnoses defining cases tracing contacts analyzing trends across time, place, and person, testing hypotheses, and deploying interventions do not happen in a rigid, step by step order. In real world outbreaks, multiple tasks happen simultaneously as teams adjust their approach to incoming data. Comparing the responses to COVID-19 and Ebola highlights a simple truth: epidemic preparedness cannot be built in the middle of a crisis. Stopping dangerous pathogens depends on having lab capacity, trained field staff, clear communication channels, and community trust established long before an outbreak starts. Tools and diagnostic technologies will continue to improve, but effective containment still relies on fundamental public health investment. References 1. Osungbade, K. O.& Oni, A. A.(2014). Outbreaks of Ebola virus disease in the West African sub region. African Journal of Medicine and Medical Sciences, 43(2), 119 126. PMID: 25474983 2. Okware S. I. Omaswa, F. G. Zaramba S. et al.(2002). An outbreak of Ebola in Uganda. Tropical Medicine & International Health, 7(12), 1068–1075. DOI: 10.1046 j.1365-3156.2002.00944.x. PMID: 12460399 3. Bouba, A.Helle K. B. & Schneider K. A.(2023). Predicting the combined effects of case isolation, safe funeral practices, and contact tracing during Ebola virus disease outbreaks. PLoS ONE 18(1), e0276351. DOI: 10.1371/journal.pone.0276351. PMID: 36649296 4. Mazza, C.Girardi, D. Gentile, L. et al.(2021). Public health effectiveness of digital contact tracing in the COVID-19 pandemic: A systematic review of available data. Acta Bio Medica: Atenei Parmensis 92(S6), e2021467. DOI: 10.23750/abm.v92iS6.12237. PMID: 34889315 5. Chakrabartty, I. Khan, M. Mahanta, S.et al.(2022). Comparative overview of emerging RNA viruses: Epidemiology, pathogenesis, diagnosis and current treatment. Annals of Medicine and Surgery, 79, 103985. DOI: 10.1016/j.amsu.2022.103985. PMID: 35721786 6.Lorenzo-Redondo, R., Ozer, E. A., & Achenbach, C. J. 2021). Molecular epidemiology in the HIV and SARS-CoV-2 pandemics.Current Opinion in HIV and AIDS, 16(1), 11 19. DOI: 10.1097/COH.0000000000000660. PMID: 33186230 7. Bulut, C.& KatoY.2020). Epidemiology of COVID-19.Turkish Journal of Medical Sciences 50(SI-1), 563–570. PMID: 32299206 8.Singhal, T. 2020). A review of Coronavirus Disease-2019 (COVID-19).The Indian Journal of Pediatrics 87(4), 281 286. PMID: 32166607 9.Hossain, M. S. Derrow, M. M. Mohamed, S. I., et al. 2023). Population based sero epidemiological investigation of SARS-CoV-2 infection in Somalia. Journal of Infection and Public Health 16(6), 907–913. PMID: 37094495 10.Aschidamini Prandi, B., Mangini, A. T., Santiago Neto, W., et al. 2022). Wastewater-based epidemiological investigation of SARS-CoV-2 in Porto Alegre, Southern Brazil.Science in One Health 1, 100013. PMID: 39076600 11. Park, K. 2017). Park's Textbook of Preventive and Social Medicine 24th ed.Banarsidas Bhanot Publishers. (Chapter on Investigation of an Epidemic, pp. 150–155). ISBN: 9789382219163. 12.WHO COVID-19 Surveillance Database.(2022). Tracking the global COVID-19 pandemic - features and functionality. PLoS ONE, 17(11), e0277623. PMC: 9685131. 13. Balde, A. T., Subissi, L., Keita, M., et al.(2021). Ebola outbreak amid COVID-19 in the Republic of Guinea: Priorities for achieving control.The American Journal of Tropical Medicine and Hygiene 104(6), 2001–2004. PMC: 8176515. 14. World Health Organization. (2026). Stages of an outbreak investigation – Outbreak Toolkit.World Health Organization. 15.Centers for Disease Control and Prevention.(2026). Public Health Guidance for Ebola Disease U.S. Department of Health and Human Services. 16. Washington State Department of Health. (2014).Ebola Virus Disease Reporting and Investigation Guideline(DOH Pub 420-126). Washington State Department of Health. 17. Khandaker, G.et al.2022. Lessons learned from the Ebola virus disease and COVID-19 preparedness.Infection and Drug Resistance 15, 6563–6576. DOI: 10.2147/IDR.S382607.
COVID-19 SARS-CoV-2 coronavirus pandemic epidemiology
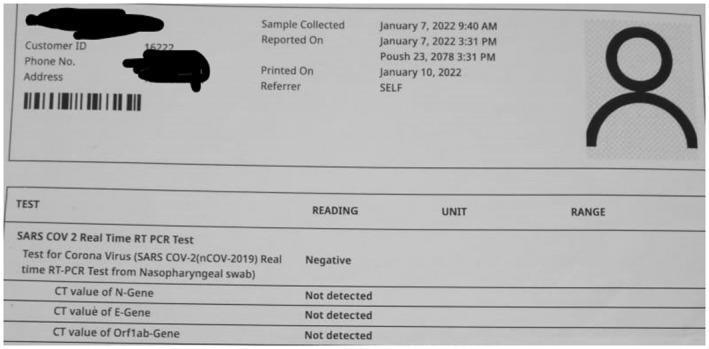
A laboratory diagnostic report for a SARS-CoV-2 Real-Time RT-PCR test performed on a nasopharyngeal swab. The document is structured into a header containing patient administrative data (redacted), collection and reporting dates (January 7, 2022), and a main results table. The test assesses for the presence of the Coronavirus (nCOV-2019) using multiple targets. The overall result is clearly stated as 'Negative'. The report specifies the Cycle Threshold (CT) values for three specific viral genetic markers: the N-Gene, E-Gene, and Orf1ab-Gene, all of which are documented as 'Not detected'. This visual serves as a clinical example of a molecular diagnostic report used during the COVID-19 pandemic, illustrating standard reporting formats for viral RNA detection, including temporal data and multi-gene target analysis.
A close-up clinical photograph presented in grayscale showing three identical medical vials containing a clear liquid, identified as a COVID-19 coronavirus vaccine. The clear glass or plastic vials are sealed with metallic crimp caps and are filled with approximately 0.5 ml of fluid. Each vial features a prominent white pharmaceutical label with black text. The labels specify the content as 'COVID-19 CORONAVIRUS VACCINE' and include critical administration instructions: 'For IM use only' (intramuscular injection). Regulatory and manufacturing details are also visible, including a license number (170985) and an NDC code (1687). This visual represents mass-produced immunization supplies and is intended for educational topics related to public health, infectious disease prevention, and pharmaceutical distribution during the SARS-CoV-2 pandemic. The uniform arrangement of the vials emphasizes standardization in vaccine production and clinical readiness.
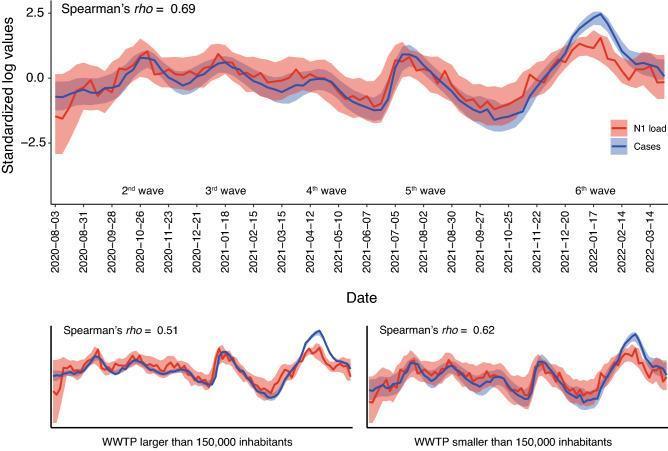
This infographic presents three line graphs illustrating the longitudinal correlation between SARS-CoV-2 viral loads in wastewater and clinical COVID-19 cases. The data spans from August 2020 to March 2022, capturing the 2nd through 6th pandemic waves. The Y-axis represents standardized log values, while the X-axis tracks the date. The red line indicates the standardized N1 viral load in sewage, and the blue line represents diagnosed clinical cases; shadowed ribbons denote standard deviation. The top, primary graph shows aggregated data across all monitored Wastewater Treatment Plants (WWTPs) with a Spearman’s rho of 0.69. The two smaller bottom graphs segregate these trends by population size: large WWTPs (serving >150,000 inhabitants, rho=0.51) and small WWTPs (serving <150,000 inhabitants, rho=0.62). The charts demonstrate the high utility of wastewater-based epidemiology (WBE) as a surveillance tool for predicting and tracking community-level viral transmission patterns and clinical surges in public health settings.
Ebola virus disease outbreak Africa hemorrhagic fever
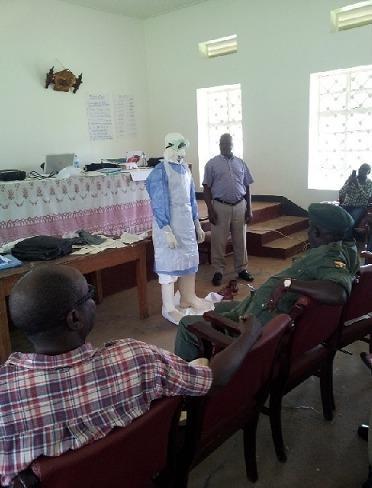
This clinical photograph captures a Personal Protective Equipment (PPE) demonstration during a medical training session focused on Viral Hemorrhagic Fever (VHF) preparedness, specifically for Ebola Virus Disease (EVD). A participant is shown wearing a complete, multi-layered PPE ensemble which includes a white head hood, protective goggles, a light blue long-sleeved isolation gown, a white fluid-resistant apron, white gloves, and high-top white boot covers. The training takes place in a classroom setting with other participants and instructors visible, emphasizing the 'donning and doffing' protocol necessary for infection prevention and control (IPC). The visual illustrates standard barrier nursing precautions and high-level protection required for managing highly infectious pathogens in healthcare or border surveillance contexts. Key educational concepts include contact and droplet precautions, biocontainment procedures, and the role of multi-disciplinary teams in epidemic response.
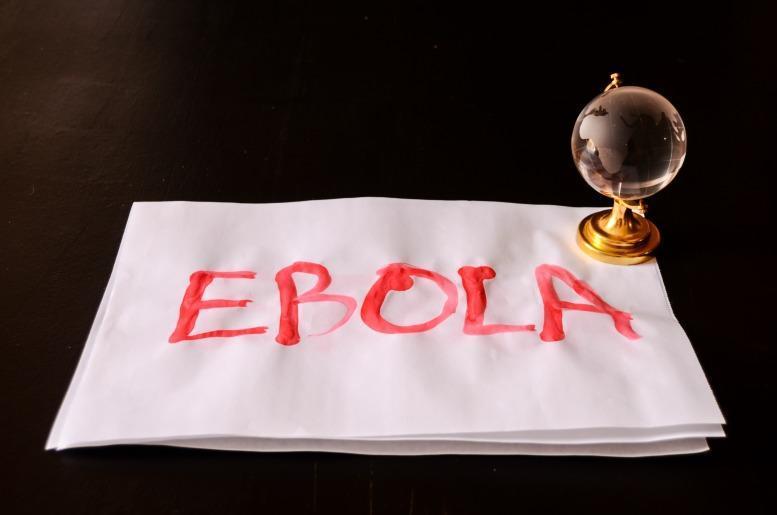
An infographic-style photograph illustrating the concept of a global health crisis, specifically focusing on Ebola Virus Disease (EVD). The image features a white sheet of paper resting on a dark surface, with the word 'EBOLA' written centrally in bold, crimson-red lettering. The medium used for the text has a fluid, slightly irregular texture resembling blood or liquid pigment, suggesting the visceral nature of the hemorrhagic fever. To the top right of the paper sits a small, transparent glass globe on a gold-toned pedestal, symbolizing the international impact and geographic spread of infectious disease outbreaks. This visual serves as an educational representation of global health security, emerging infectious diseases, and the public health response to viral pathogens with epidemic potential. It is suitable for discussions regarding epidemiology, international disease surveillance, and the sociological impact of high-consequence pathogens.
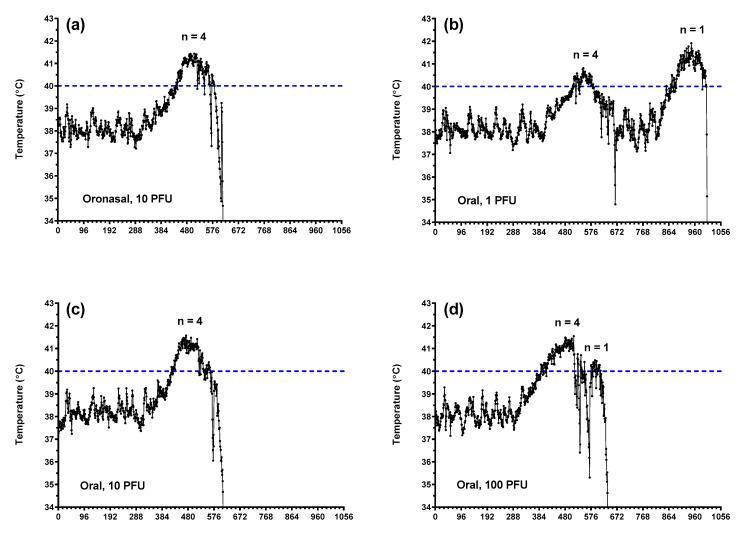
This set of line graphs illustrates core body temperature alterations in a ferret model of Ebola virus (EBOV) disease across different inoculation routes and doses. The graphs (a-d) plot temperature in degrees Celsius (°C) against time (every tick representing 4 hours). Subfigure (a) shows the oronasal route (10 PFU), while (b-d) show the oral route at 1, 10, and 100 PFU doses, respectively. A horizontal dashed line at 40°C indicates the threshold for fever. Common to most groups is an initial baseline fluctuation (37°C–39°C), followed by a progressive febrile response exceeding 41°C. Notably, higher doses (10 and 100 PFU) exhibit more rapid progression to peak fever, while the 1 PFU oral group displays a delayed or biphasic temperature profile. All lethal cases culminate in a sharp terminal decline (hypothermia), with temperatures dropping below 35°C, representing clinical deterioration and the near-terminal phase of the hemorrhagic fever syndrome.
epidemic curve outbreak epidemiology contact tracing public health
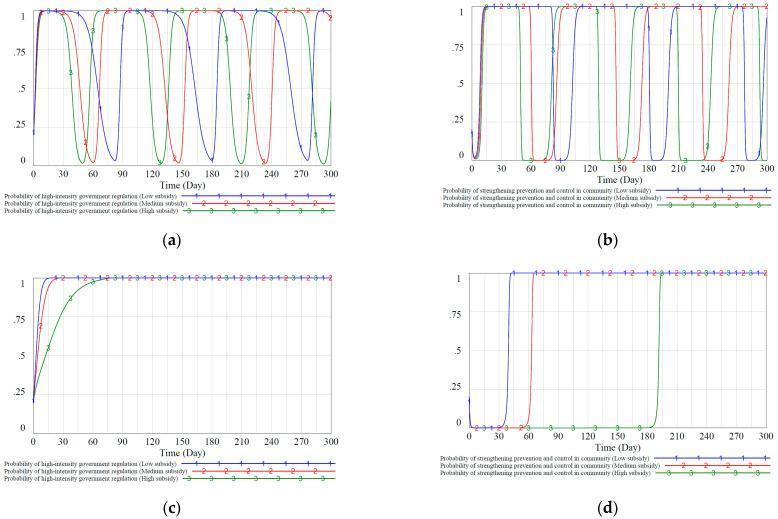
This Comparison Chart consists of four line graphs (a-d) modeling public health management strategies for epidemic control, specifically contrasting static and dynamic reward and punishment mechanisms over a 300-day timeline. The Y-axis represents the probability (0 to 1) of a specific strategy being adopted, while the X-axis represents Time (Days). Subplots (a) and (b) illustrate 'static mechanisms,' showing continuous, undamped oscillations (cyclical fluctuations) between 0 and 1, representing system instability where government regulation intensity and community prevention efforts fail to reach an equilibrium. Subplots (c) and (d) demonstrate 'dynamic mechanisms,' where the probability curves (representing low, medium, and high subsidy intensities) eventually converge and stabilize at a probability of 1.0. This indicates that dynamic adjustments lead to an evolutionary stable equilibrium. The graphs distinguish between the probability of 'high-intensity government regulation' (a, c) and 'strengthening prevention and control in the community' (b, d). These diagrams serve as educational tools in health policy and epidemiology to demonstrate the efficacy of responsive, dynamic feedback loops in managing community-level health interventions during an infectious disease outbreak.
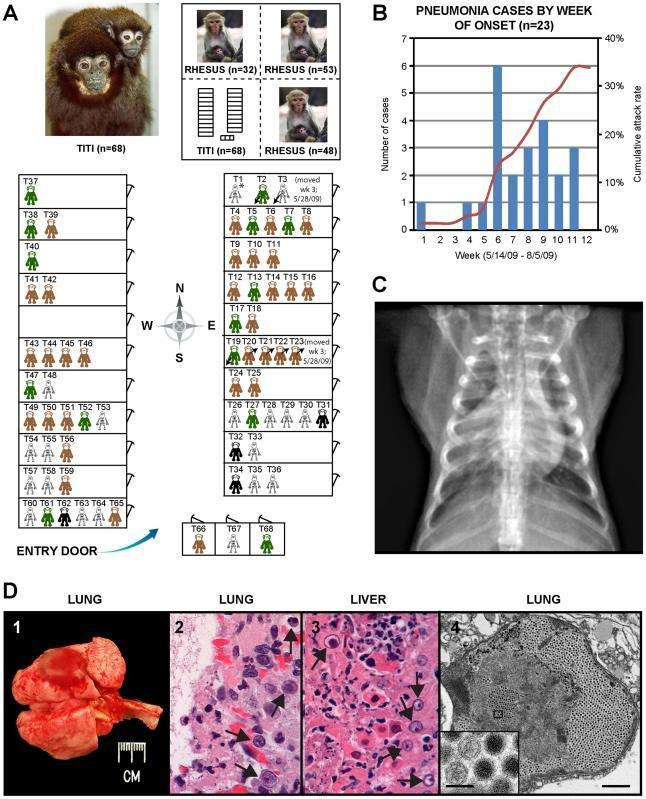
This composite educational graphic illustrates the epidemiology and pathology of a Titi Monkey Adenovirus (TMAdV) outbreak. Panel A provides a clinical layout map of monkey cages, using color-coded symbols to track health status: at-risk (brown/green), affected survivors (black solid), and fatalities (skeleton icons). Arrows indicate animal movement during the outbreak. Panel B shows an epidemic curve of pneumonia cases over 12 weeks, tracking incidence and cumulative attack rate. Panel C displays an anteroposterior chest radiograph of an affected subject, revealing bilateral basilar infiltrates and right middle lobe consolidation. Panel D details multi-scale pathological findings: D1 shows gross necropsy of lungs with focal hemorrhage and failure to collapse; D2 and D3 are H&E stained photomicrographs of lung and liver tissue, respectively, demonstrating necrotizing inflammation and characteristic basophilic intranuclear inclusion bodies (arrows); D4 is a transmission electron micrograph (TEM) showing a lung alveolus packed with viral particles. An inset in D4 confirms icosahedral adenoviral morphology at high magnification.
wastewater surveillance SARS-CoV-2 RNA detection public health
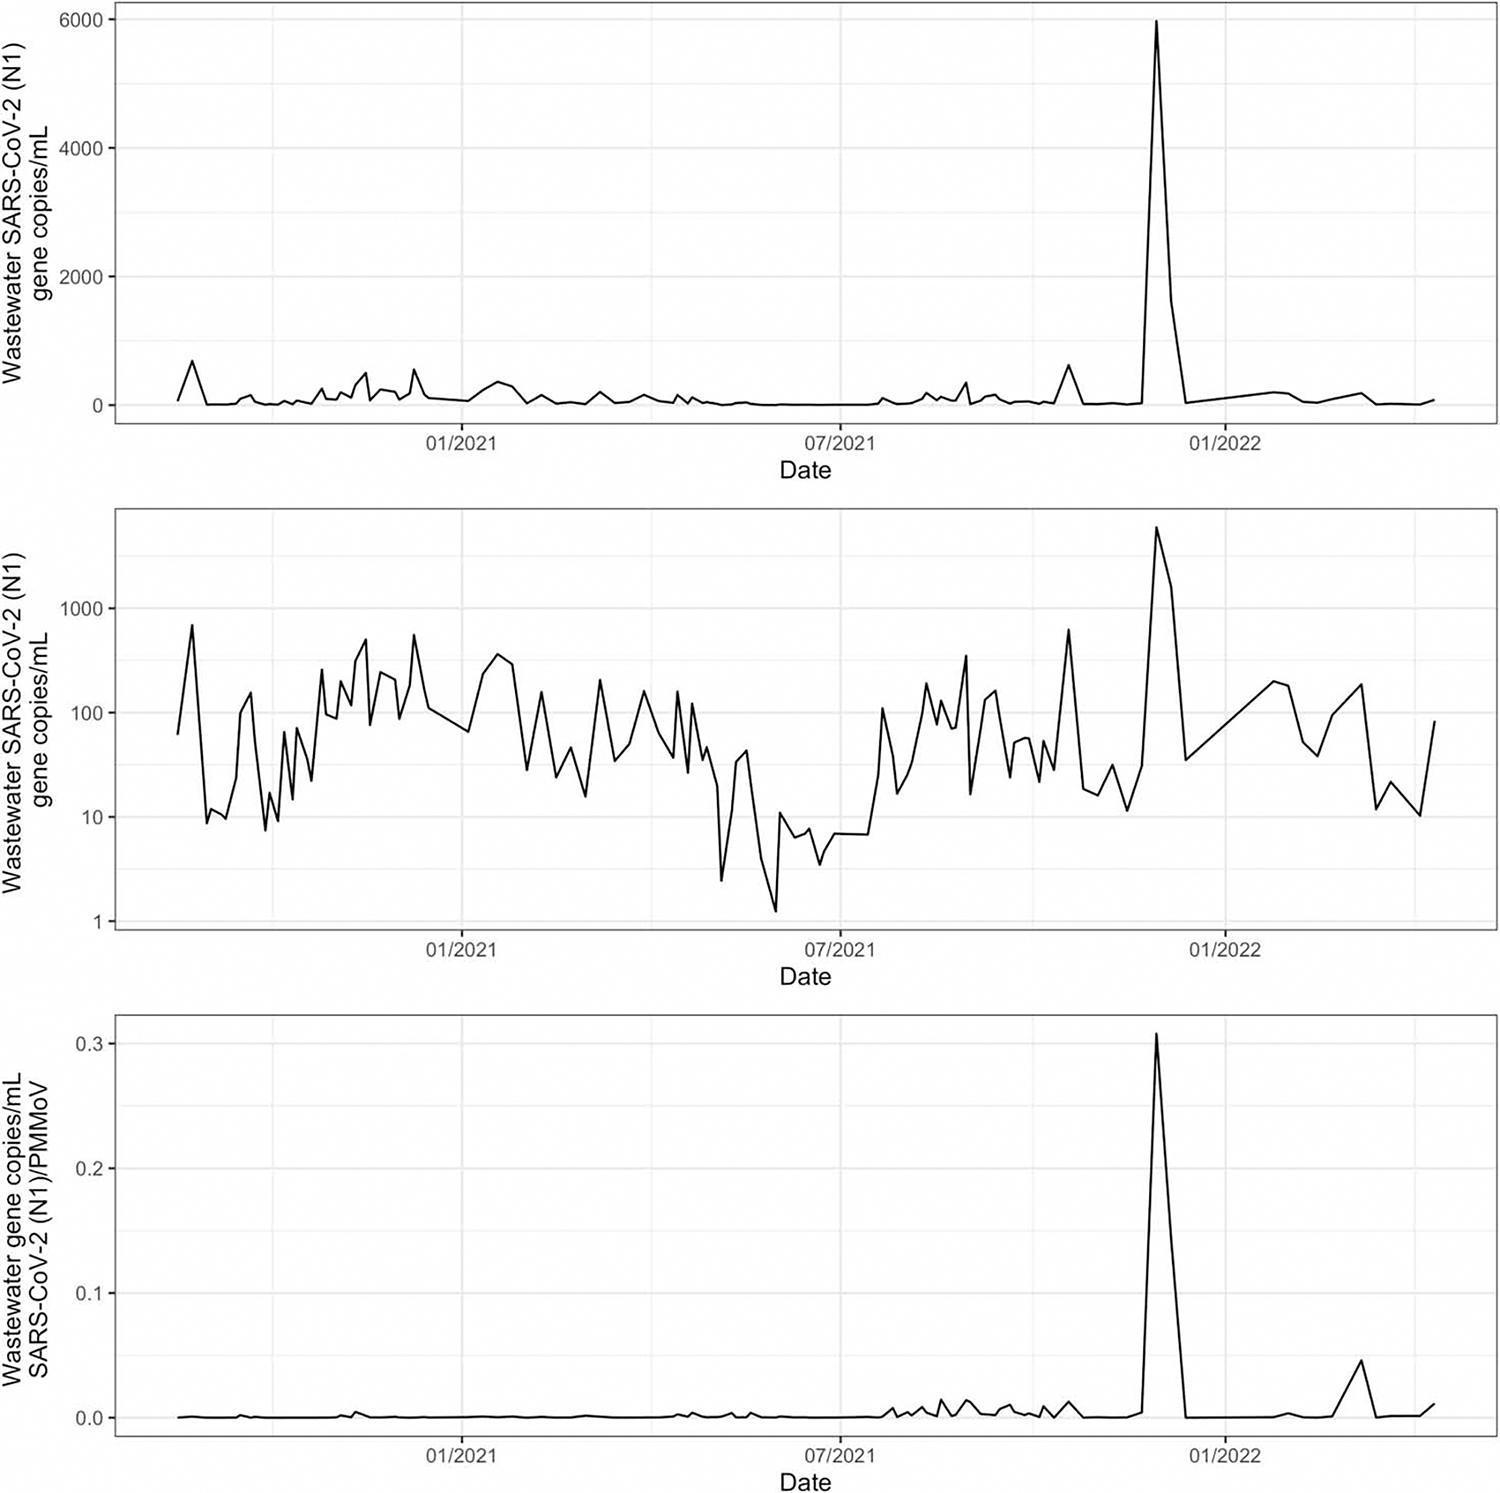
A multi-panel epidemiological chart presenting simulated SARS-CoV-2 wastewater surveillance data from August 2020 to April 2022. The visualization demonstrates three methods of longitudinal data presentation for public health tracking: a linear scale (top), a logarithmic scale (middle), and normalized data (bottom). The top panel (linear scale) emphasizes a massive outlier peak around January 2022, corresponding to a high concentration of gene copies/mL, while rendering baseline fluctuations relatively invisible. The middle panel (logarithmic scale) reveals significant dynamic range and variability throughout the entire period, highlighting smaller viral transmission waves that are flattened in the linear view. The bottom panel displays the SARS-CoV-2 (N1) gene copies normalized by PMMoV (Pepper Mild Mottle Virus) concentration, used as an internal fecal indicator to account for dilution and population variance. This comparison illustrates how data scaling and normalization techniques significantly influence the interpretation of viral trends and infectious disease spread in environmental health surveillance.
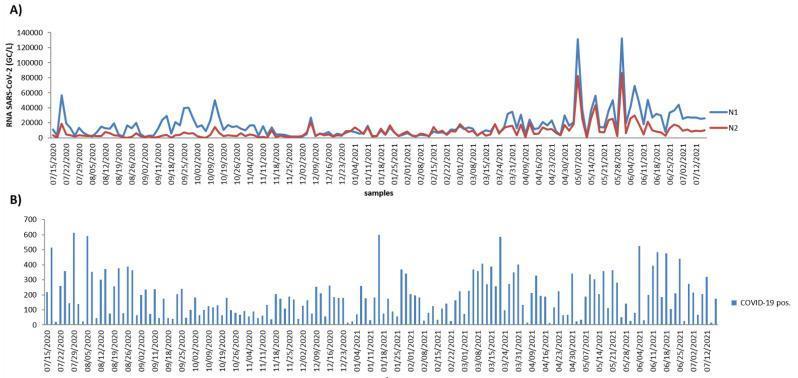
A multi-panel epidemiological data visualization tracking SARS-CoV-2 trends over a one-year period (July 2020–July 2021) in São José do Rio Preto. Panel A is a line graph showing wastewater-based epidemiology data, quantifying SARS-CoV-2 RNA (GC/L) for two genetic targets: N1 (blue line) and N2 (red line). The graph illustrates longitudinal fluctuations with prominent peaks in early May 2021, where the N1 target consistently shows higher viral copy concentrations than N2. Panel B is a bar chart displaying the daily number of COVID-19 positive clinical cases over the same timeline. The vertical axis for clinical cases ranges from 0 to 700. The combined figures facilitate a temporal comparison between environmental viral load monitoring in raw sewage and reported clinical diagnostic data. This comparison is used to study the correlation between community viral shedding and public health infection rates, illustrating the utility of wastewater surveillance as a supplemental tool for infectious disease monitoring and early warning systems.
mkdir -p /tmp/workspace/outbreak-presentation && ls /tmp/workspace/outbreak-presentation/
~/outbreak-presentation/build_pptx.py
"""
Outbreak Investigations in the Modern Era:
A Comparative Analysis of COVID-19 and Ebola
Outstanding Presentation Builder
"""

import json, subprocess, base64
from io import BytesIO
from pptx import Presentation
from pptx.util import Inches, Pt, Emu
from pptx.dml.color import RGBColor
from pptx.enum.text import PP_ALIGN, MSO_ANCHOR
from pptx.oxml.ns import qn
from lxml import etree

# ── Colour Palette ──────────────────────────────────────────────────────────
DARK_NAVY   = RGBColor(0x0D, 0x1B, 0x2A)   # slide backgrounds
MID_NAVY    = RGBColor(0x1B, 0x33, 0x5E)   # section headers
COVID_BLUE  = RGBColor(0x1E, 0x90, 0xFF)   # COVID accent
EBOLA_RED   = RGBColor(0xD7, 0x26, 0x3D)   # Ebola accent
GOLD        = RGBColor(0xF0, 0xB3, 0x29)   # highlights / icons
WHITE       = RGBColor(0xFF, 0xFF, 0xFF)
LIGHT_GRAY  = RGBColor(0xD8, 0xDE, 0xE9)
SUBTITLE_GRAY = RGBColor(0xA8, 0xB4, 0xC8)
CARD_BG     = RGBColor(0x16, 0x2A, 0x4A)   # content card background
GREEN       = RGBColor(0x2E, 0xCC, 0x71)

# ── Helpers ──────────────────────────────────────────────────────────────────
def blank(prs):
    return prs.slides.add_slide(prs.slide_layouts[6])

def bg(slide, color: RGBColor):
    fill = slide.background.fill
    fill.solid()
    fill.fore_color.rgb = color

def rect(slide, x, y, w, h, fill_color, alpha=None):
    shape = slide.shapes.add_shape(
        1,  # MSO_SHAPE_TYPE.RECTANGLE
        Inches(x), Inches(y), Inches(w), Inches(h)
    )
    shape.fill.solid()
    shape.fill.fore_color.rgb = fill_color
    shape.line.fill.background()
    return shape

def txt(slide, text, x, y, w, h, size=18, bold=False, color=WHITE,
        align=PP_ALIGN.LEFT, italic=False, font="Calibri"):
    tb = slide.shapes.add_textbox(Inches(x), Inches(y), Inches(w), Inches(h))
    tf = tb.text_frame
    tf.word_wrap = True
    tf.margin_left = Pt(2)
    tf.margin_right = Pt(2)
    tf.margin_top = Pt(2)
    tf.margin_bottom = Pt(2)
    p = tf.paragraphs[0]
    p.alignment = align
    run = p.add_run()
    run.text = text
    run.font.name = font
    run.font.size = Pt(size)
    run.font.bold = bold
    run.font.italic = italic
    run.font.color.rgb = color
    return tb

def txt_lines(slide, lines, x, y, w, h, size=14, color=WHITE,
              align=PP_ALIGN.LEFT, font="Calibri", line_spacing_pt=None):
    """Add a textbox with multiple paragraphs."""
    tb = slide.shapes.add_textbox(Inches(x), Inches(y), Inches(w), Inches(h))
    tf = tb.text_frame
    tf.word_wrap = True
    tf.margin_left = Pt(4)
    tf.margin_right = Pt(4)
    tf.margin_top = Pt(4)
    tf.margin_bottom = Pt(4)
    for i, (line_text, bold_flag) in enumerate(lines):
        p = tf.paragraphs[0] if i == 0 else tf.add_paragraph()
        p.alignment = align
        if line_spacing_pt:
            p.line_spacing = Pt(line_spacing_pt)
        run = p.add_run()
        run.text = line_text
        run.font.name = font
        run.font.size = Pt(size)
        run.font.bold = bold_flag
        run.font.color.rgb = color
    return tb

def accent_bar(slide, x, y, w=0.05, h=0.55, color=GOLD):
    """Thin vertical accent bar."""
    rect(slide, x, y, w, h, color)

def section_divider(slide, label, accent_color=GOLD):
    """Top slim bar + section label."""
    rect(slide, 0, 0, 13.333, 0.08, accent_color)
    txt(slide, label, 0.3, 0.08, 12, 0.45, size=11, color=SUBTITLE_GRAY,
        bold=False, align=PP_ALIGN.LEFT)

def add_bullet_card(slide, title, bullets, x, y, w, h,
                    title_color=COVID_BLUE, card_color=CARD_BG, bullet_size=13):
    rect(slide, x, y, w, h, card_color)
    txt(slide, title, x+0.12, y+0.08, w-0.25, 0.38,
        size=14, bold=True, color=title_color)
    lines = [(f"  {b}", False) for b in bullets]
    txt_lines(slide, lines, x+0.12, y+0.5, w-0.25, h-0.6,
              size=bullet_size, color=LIGHT_GRAY)

def embed_image(slide, image_url, x, y, w, h):
    """Fetch and embed an image from a URL."""
    try:
        result = json.loads(subprocess.check_output(
            ["python", "/tmp/skills/shared/scripts/fetch_images.py", image_url],
            timeout=30
        ))
        if result and result[0].get("base64"):
            b64 = result[0]["base64"]
            # strip data URI prefix if present
            if "," in b64:
                b64 = b64.split(",", 1)[1]
            raw = base64.b64decode(b64)
            slide.shapes.add_picture(BytesIO(raw),
                                     Inches(x), Inches(y),
                                     Inches(w), Inches(h))
            return True
    except Exception as e:
        print(f"  [image skip] {e}")
    return False

# ── Presentation setup ───────────────────────────────────────────────────────
prs = Presentation()
prs.slide_width  = Inches(13.333)
prs.slide_height = Inches(7.5)

# ════════════════════════════════════════════════════════════════════════════
#  SLIDE 1  –  TITLE
# ════════════════════════════════════════════════════════════════════════════
s = blank(prs)
bg(s, DARK_NAVY)

# Gradient-like layered rects for visual depth
rect(s, 0, 0, 13.333, 7.5, DARK_NAVY)
rect(s, 0, 0, 13.333, 0.12, GOLD)           # top gold stripe
rect(s, 0, 7.38, 13.333, 0.12, GOLD)        # bottom gold stripe
rect(s, 6.5, 0.12, 0.05, 7.26, MID_NAVY)    # vertical centre divider

# Left side — text
txt(s, "OUTBREAK", 0.5, 0.6, 6, 1.1, size=52, bold=True,
    color=WHITE, font="Calibri")
txt(s, "INVESTIGATIONS", 0.5, 1.65, 6, 1.0, size=36, bold=True,
    color=GOLD, font="Calibri")
txt(s, "IN THE MODERN ERA", 0.5, 2.6, 6, 0.7, size=26, bold=False,
    color=LIGHT_GRAY, font="Calibri")

# Divider line under main title
rect(s, 0.5, 3.35, 5.5, 0.045, COVID_BLUE)

txt(s, "A Comparative Analysis of", 0.5, 3.5, 5.8, 0.5,
    size=15, bold=False, color=SUBTITLE_GRAY)
txt(s, "COVID-19  &  Ebola Virus Disease", 0.5, 3.95, 6, 0.6,
    size=20, bold=True, color=WHITE)

# Bottom left presenter info
rect(s, 0.5, 5.7, 5.5, 1.55, CARD_BG)
txt(s, "Presenter:  Shahab", 0.7, 5.85, 5, 0.45,
    size=15, bold=False, color=LIGHT_GRAY)
txt(s, "Group:  Med21C", 0.7, 6.3, 5, 0.4,
    size=14, bold=False, color=SUBTITLE_GRAY)
txt(s, "Field Epidemiology  |  Public Health", 0.7, 6.75, 5, 0.38,
    size=12, bold=False, color=SUBTITLE_GRAY)

# Right side — two icons: COVID circle + Ebola biohazard symbol (text-based)
rect(s, 7.0, 0.7, 5.8, 3.2, MID_NAVY)
txt(s, "🦠", 7.5, 1.0, 2.5, 2.5, size=80, color=COVID_BLUE,
    align=PP_ALIGN.CENTER)
txt(s, "☣", 10.2, 1.0, 2.5, 2.5, size=80, color=EBOLA_RED,
    align=PP_ALIGN.CENTER)
txt(s, "SARS-CoV-2", 7.2, 3.7, 2.8, 0.45, size=13, bold=True,
    color=COVID_BLUE, align=PP_ALIGN.CENTER)
txt(s, "Zaire ebolavirus", 10.0, 3.7, 2.8, 0.45, size=13, bold=True,
    color=EBOLA_RED, align=PP_ALIGN.CENTER)

txt(s, "Two pathogens  ·  Two crises  ·  One epidemiological framework",
    6.6, 4.3, 6.5, 0.5, size=13, color=SUBTITLE_GRAY, italic=True,
    align=PP_ALIGN.CENTER)

# ════════════════════════════════════════════════════════════════════════════
#  SLIDE 2  –  ABSTRACT / OVERVIEW
# ════════════════════════════════════════════════════════════════════════════
s = blank(prs)
bg(s, DARK_NAVY)
rect(s, 0, 0, 13.333, 0.12, GOLD)

txt(s, "ABSTRACT", 0.4, 0.2, 12, 0.55, size=28, bold=True, color=WHITE)
rect(s, 0.4, 0.82, 4.5, 0.045, COVID_BLUE)

abstract_text = (
    "The COVID-19 pandemic (SARS-CoV-2) and recurring Ebola virus disease (EVD) outbreaks represent "
    "two defining health crises of the 21st century. Both events severely strained global public health "
    "systems and field response networks.\n\n"
    "Although driven by fundamentally different pathogens in vastly different socioeconomic environments, "
    "both followed a shared epidemiological path — from early case identification and contact tracing "
    "to data analysis and targeted control measures.\n\n"
    "This paper presents a comparative analysis of those investigative paths, evaluating how core field "
    "epidemiology principles were applied and where operational bottlenecks occurred."
)

rect(s, 0.4, 1.0, 8.0, 5.8, CARD_BG)
tb = s.shapes.add_textbox(Inches(0.65), Inches(1.15), Inches(7.6), Inches(5.4))
tf = tb.text_frame
tf.word_wrap = True
tf.margin_left = Pt(6)
tf.margin_right = Pt(6)
tf.margin_top = Pt(6)
tf.margin_bottom = Pt(6)
p = tf.paragraphs[0]
run = p.add_run()
run.text = abstract_text
run.font.name = "Calibri"
run.font.size = Pt(15)
run.font.color.rgb = LIGHT_GRAY

# Keywords box
rect(s, 0.4, 6.82, 8.0, 0.55, MID_NAVY)
txt(s, "Keywords:  COVID-19  ·  Ebola  ·  Field Epidemiology  ·  Contact Tracing  ·  Outbreak Control",
    0.55, 6.87, 7.8, 0.45, size=11, color=SUBTITLE_GRAY, italic=True)

# Right panel — 4 core objectives
rect(s, 8.9, 1.0, 4.1, 5.8, MID_NAVY)
txt(s, "CORE OBJECTIVES", 9.0, 1.1, 3.9, 0.45, size=13, bold=True,
    color=GOLD, align=PP_ALIGN.CENTER)
rect(s, 9.0, 1.6, 2.9, 0.045, GOLD)

objectives = [
    ("01", "Quantify the outbreak across time, place, and person"),
    ("02", "Pinpoint environmental & biological drivers of spread"),
    ("03", "Isolate the causative agent & track transmission routes"),
    ("04", "Implement targeted public health measures"),
]
for i, (num, obj) in enumerate(objectives):
    y_pos = 1.75 + i * 1.15
    rect(s, 9.0, y_pos, 0.55, 0.75, COVID_BLUE)
    txt(s, num, 9.0, y_pos+0.1, 0.55, 0.55, size=16, bold=True,
        color=WHITE, align=PP_ALIGN.CENTER)
    txt(s, obj, 9.65, y_pos+0.05, 3.15, 0.75, size=12,
        color=LIGHT_GRAY, align=PP_ALIGN.LEFT)

txt(s, "Park (2017), pp. 150–151", 9.1, 6.5, 3.7, 0.35,
    size=10, color=SUBTITLE_GRAY, italic=True)

# ════════════════════════════════════════════════════════════════════════════
#  SLIDE 3  –  PATHOGEN PROFILES
# ════════════════════════════════════════════════════════════════════════════
s = blank(prs)
bg(s, DARK_NAVY)
section_divider(s, "Stage 0  ·  Background")

txt(s, "Pathogen Profiles: Two Distinct Operational Challenges",
    0.4, 0.55, 12.5, 0.65, size=24, bold=True, color=WHITE)
rect(s, 0.4, 1.25, 6.1, 0.045, COVID_BLUE)
rect(s, 6.9, 1.25, 6.0, 0.045, EBOLA_RED)

# COVID card
rect(s, 0.3, 1.4, 6.2, 5.8, CARD_BG)
txt(s, "🦠  SARS-CoV-2  /  COVID-19", 0.5, 1.5, 5.9, 0.55,
    size=16, bold=True, color=COVID_BLUE)

covid_facts = [
    ("Transmission:", "Respiratory droplets & aerosols"),
    ("Incubation:", "2–14 days (avg 5–6 days)"),
    ("Asymptomatic spread:", "Widespread & frequent ⚠️"),
    ("R₀ (ancestral):", "2.0 – 3.0  (higher in variants)"),
    ("Case Fatality Rate:", "~1–2% global average"),
    ("Contact window:", "14 days"),
    ("Key feature:", "Silent transmission; airborne spread"),
]
for i, (label, val) in enumerate(covid_facts):
    y = 2.15 + i * 0.62
    txt(s, label, 0.55, y, 2.2, 0.5, size=12, bold=True, color=GOLD)
    txt(s, val, 2.75, y, 3.55, 0.5, size=12, color=LIGHT_GRAY)

# Ebola card
rect(s, 6.85, 1.4, 6.2, 5.8, CARD_BG)
txt(s, "☣  Zaire ebolavirus  /  EVD", 7.05, 1.5, 5.9, 0.55,
    size=16, bold=True, color=EBOLA_RED)

ebola_facts = [
    ("Transmission:", "Direct contact with body fluids"),
    ("Incubation:", "2–21 days"),
    ("Asymptomatic spread:", "None — only symptomatic spread ✅"),
    ("R₀:", "1.5 – 2.5"),
    ("Case Fatality Rate:", "40–70% (setting dependent)"),
    ("Contact window:", "21 days"),
    ("Key feature:", "Deceased bodies remain highly infectious"),
]
for i, (label, val) in enumerate(ebola_facts):
    y = 2.15 + i * 0.62
    txt(s, label, 7.05, y, 2.25, 0.5, size=12, bold=True, color=GOLD)
    txt(s, val, 9.3, y, 3.55, 0.5, size=12, color=LIGHT_GRAY)

# Bottom comparison strip
rect(s, 0.3, 7.1, 12.7, 0.3, MID_NAVY)
txt(s,
    "COVID-19: Population-wide NPIs + 14-day isolation     |     EVD: Strict isolation + 21-day monitoring + safe burial",
    0.5, 7.12, 12.5, 0.28, size=11, color=SUBTITLE_GRAY, align=PP_ALIGN.CENTER)

# ════════════════════════════════════════════════════════════════════════════
#  SLIDE 4  –  STAGE 1: VERIFYING DIAGNOSIS & CONFIRMING OUTBREAK
# ════════════════════════════════════════════════════════════════════════════
s = blank(prs)
bg(s, DARK_NAVY)
section_divider(s, "Stage 1  ·  Verifying the Diagnosis")

txt(s, "Confirming the Outbreak", 0.4, 0.55, 12, 0.6, size=26, bold=True, color=WHITE)

# Two columns
# COVID column
rect(s, 0.3, 1.3, 6.2, 5.5, CARD_BG)
txt(s, "COVID-19", 0.5, 1.38, 2.5, 0.4, size=15, bold=True, color=COVID_BLUE)
rect(s, 0.5, 1.82, 5.8, 0.04, COVID_BLUE)

covid_diag = [
    "Dec 31, 2019 — Unusual pneumonia cluster flagged in Wuhan",
    "Clinical signs: fever, dry cough, dyspnoea, bilateral CT infiltrates",
    "WHO partnered with national authorities in early January 2020",
    "Novel betacoronavirus (SARS-CoV-2) isolated via PCR & sequencing",
    "Baseline comparison: surge in severe atypical pneumonia far exceeded seasonal norms",
    "Official pandemic declaration: March 11, 2020",
]
for i, point in enumerate(covid_diag):
    txt(s, f"▸  {point}", 0.5, 1.92 + i*0.72, 5.85, 0.65, size=12, color=LIGHT_GRAY)

# Ebola column
rect(s, 6.85, 1.3, 6.2, 5.5, CARD_BG)
txt(s, "Ebola (Uganda 2000 + Guinea 2021)", 7.05, 1.38, 5.9, 0.4,
    size=15, bold=True, color=EBOLA_RED)
rect(s, 7.05, 1.82, 5.8, 0.04, EBOLA_RED)

ebola_diag = [
    "Reports of unexplained fever + haemorrhagic signs triggered field response",
    "Ministry of Health + WHO + CDC implemented 4-tier classification",
    "RT-PCR testing on whole blood (EDTA tubes), ≥3 days post-symptom onset",
    "Local RT-PCR results = presumptive → verified by central reference labs",
    "2021 Guinea: COVID-19 PCR equipment repurposed for Ebola detection",
    "Key rule: field investigation starts alongside lab work — never waits",
]
for i, point in enumerate(ebola_diag):
    txt(s, f"▸  {point}", 7.05, 1.92 + i*0.72, 5.85, 0.65, size=12, color=LIGHT_GRAY)

# Bottom insight
rect(s, 0.3, 6.88, 12.7, 0.52, MID_NAVY)
txt(s, "⚡  Field teams must begin containment immediately alongside lab confirmation — never wait for formal results.",
    0.55, 6.92, 12.2, 0.42, size=13, bold=True, color=GOLD, align=PP_ALIGN.CENTER)

# ════════════════════════════════════════════════════════════════════════════
#  SLIDE 5  –  STAGE 2: CASE DEFINITIONS
# ════════════════════════════════════════════════════════════════════════════
s = blank(prs)
bg(s, DARK_NAVY)
section_divider(s, "Stage 2  ·  Establishing the Case Definition")

txt(s, "Case Definitions: From Clinical Criteria to Lab Confirmation",
    0.4, 0.55, 12.5, 0.6, size=23, bold=True, color=WHITE)

# COVID case definition
rect(s, 0.3, 1.3, 6.2, 5.9, CARD_BG)
txt(s, "COVID-19 Case Definition (WHO)", 0.5, 1.38, 5.9, 0.45,
    size=14, bold=True, color=COVID_BLUE)
txt(s, "Updated 9 times: Jan 2020 → mid 2022",
    0.5, 1.85, 5.9, 0.35, size=11, italic=True, color=SUBTITLE_GRAY)

txt(s, "✅  Confirmed Case Criteria:", 0.5, 2.3, 5.9, 0.38, size=13, bold=True, color=GOLD)
txt(s, "1.  Positive NAAT (RT-PCR) — regardless of symptoms\n"
       "2.  Clinical/epidemiological criteria + positive Ag-RDT",
    0.6, 2.72, 5.7, 0.85, size=12, color=LIGHT_GRAY)

txt(s, "👤  Exposed Contact Definition:", 0.5, 3.65, 5.9, 0.38, size=13, bold=True, color=GOLD)
txt(s, "• Within 1 m of confirmed case for ≥15 min\n"
       "• Direct physical contact\n"
       "• Unprotected exposure to infectious secretions\n"
       "• Within 48 hours prior to symptom onset (or positive test)",
    0.6, 4.08, 5.7, 1.6, size=12, color=LIGHT_GRAY)

# Ebola case definition
rect(s, 6.85, 1.3, 6.2, 5.9, CARD_BG)
txt(s, "Ebola Tiered Classification (Okware et al. 2002)",
    7.05, 1.38, 5.9, 0.45, size=14, bold=True, color=EBOLA_RED)
txt(s, "Purpose: isolate patients and trace contacts BEFORE lab results",
    7.05, 1.85, 5.9, 0.35, size=11, italic=True, color=SUBTITLE_GRAY)

tiers = [
    ("🟡  ALERT",    GOLD,       "Unexplained fever in an active outbreak zone"),
    ("🟠  SUSPECTED", RGBColor(0xFF,0x80,0x00),
                                  "Fever + ≥3 systemic symptoms + epidemiological link"),
    ("🔴  PROBABLE",  EBOLA_RED,  "Suspect case with clear epi-link, no lab result"),
    ("🟢  CONFIRMED", GREEN,      "Positive RT-PCR or antigen detection"),
]
for i, (tier, col, desc) in enumerate(tiers):
    y = 2.4 + i * 1.1
    rect(s, 7.05, y, 5.8, 0.95, MID_NAVY)
    txt(s, tier, 7.15, y+0.05, 2.2, 0.4, size=13, bold=True, color=col)
    txt(s, desc, 7.15, y+0.48, 5.55, 0.42, size=12, color=LIGHT_GRAY)

# ════════════════════════════════════════════════════════════════════════════
#  SLIDE 6  –  STAGE 3: ACTIVE CASE FINDING & CONTACT TRACING
# ════════════════════════════════════════════════════════════════════════════
s = blank(prs)
bg(s, DARK_NAVY)
section_divider(s, "Stage 3  ·  Active Case Finding & Contact Tracing")

txt(s, "Finding Cases & Following Contacts", 0.4, 0.55, 12.5, 0.6,
    size=26, bold=True, color=WHITE)

# Top row — Active Case Finding
rect(s, 0.3, 1.3, 12.7, 2.05, CARD_BG)
txt(s, "ACTIVE CASE FINDING", 0.5, 1.38, 5, 0.42, size=14, bold=True, color=GOLD)
rect(s, 0.5, 1.83, 12.2, 0.035, MID_NAVY)

acf_items = [
    ("Case Investigation Forms", "Demographics · travel history · symptom onset · contact lists · gatherings attended"),
    ("Door-to-door (Ebola)", "Community health workers visited homes to spot sick individuals, build trust (Okware 2002)"),
    ("Mass testing sites (COVID)", "Decentralised RT-PCR + Ag-RDT sites, symptom hotlines, drive-through centres"),
    ("Wastewater surveillance (COVID)", "SARS-CoV-2 RNA in urban sewage detected surges 5–7 days before clinical case rises (Prandi 2022)"),
]
for i, (title, detail) in enumerate(acf_items):
    x = 0.4 + i * 3.18
    txt(s, title, x, 1.93, 3.0, 0.38, size=12, bold=True, color=COVID_BLUE)
    txt(s, detail, x, 2.33, 3.05, 0.9, size=11, color=LIGHT_GRAY)

# Bottom row — Contact Tracing comparison
txt(s, "CONTACT TRACING STRATEGIES", 0.5, 3.55, 6, 0.42,
    size=14, bold=True, color=GOLD)

# Ebola CT
rect(s, 0.3, 4.05, 6.2, 3.2, CARD_BG)
txt(s, "Ebola — Field-Level Contact Tracing", 0.5, 4.12, 5.9, 0.42,
    size=13, bold=True, color=EBOLA_RED)
ebola_ct = [
    "Daily in-person visits for 21 days per contact",
    "Gulu 2000: ~5,000 contacts traced → secondary attack rate only 2.5%",
    "Combo of isolation + contact tracing + safe burial can control EVD (Bouba 2023)",
    "Healthcare facilities = major amplification nodes when IPC failed",
]
for i, pt in enumerate(ebola_ct):
    txt(s, f"▸  {pt}", 0.5, 4.6 + i*0.57, 5.85, 0.52, size=12, color=LIGHT_GRAY)

# COVID CT
rect(s, 6.85, 4.05, 6.2, 3.2, CARD_BG)
txt(s, "COVID-19 — Digital & Manual Tracing", 7.05, 4.12, 5.9, 0.42,
    size=13, bold=True, color=COVID_BLUE)
covid_ct = [
    "Bluetooth proximity apps deployed in many countries (DCT)",
    "Adoption: 0.01% – 58.3%; no clear evidence apps alone reduced spread (Mazza 2021)",
    "Manual tracers with community knowledge proved indispensable",
    "Asymptomatic transmission made tracing far more complex",
]
for i, pt in enumerate(covid_ct):
    txt(s, f"▸  {pt}", 7.05, 4.6 + i*0.57, 5.85, 0.52, size=12, color=LIGHT_GRAY)

# ════════════════════════════════════════════════════════════════════════════
#  SLIDE 7  –  STAGE 4–5: LINE LISTS & EPIDEMIC CURVES
# ════════════════════════════════════════════════════════════════════════════
s = blank(prs)
bg(s, DARK_NAVY)
section_divider(s, "Stages 4 & 5  ·  Risk Population, Line Lists & Data Analysis")

txt(s, "Defining Risk Populations & Analysing the Data",
    0.4, 0.55, 12.5, 0.6, size=23, bold=True, color=WHITE)

# Left — Line list + Risk
rect(s, 0.3, 1.3, 6.0, 5.9, CARD_BG)
txt(s, "📋  Line List & Risk Population", 0.5, 1.38, 5.7, 0.45,
    size=14, bold=True, color=GOLD)
rect(s, 0.5, 1.88, 5.6, 0.04, GOLD)
ll_points = [
    "Line list = core database: one row per case, columns capture demographics, clinical data, lab results, spatial data",
    "Gulu 2000 attack rate: 12.6 / 10,000 (all contacts) vs 4.5 / 10,000 (lab-confirmed only) → denominator matters",
    "COVID-19: serological surveys needed to calculate true IFR (routine testing missed asymptomatic cases)",
    "Seroprevalence studies (e.g., Somalia) provided baseline exposure in low-infrastructure settings (Hossain 2023)",
    "Line lists allow real-time filtering, sorting, and trend tracking by field teams",
]
for i, pt in enumerate(ll_points):
    txt(s, f"▸  {pt}", 0.5, 2.0 + i*0.98, 5.7, 0.9, size=12, color=LIGHT_GRAY)

# Right — Epidemic curves + person/place
rect(s, 6.6, 1.3, 6.4, 5.9, CARD_BG)
txt(s, "📊  Time · Place · Person Analysis", 6.8, 1.38, 6.1, 0.45,
    size=14, bold=True, color=COVID_BLUE)
rect(s, 6.8, 1.88, 6.0, 0.04, COVID_BLUE)

# Epi curve types
txt(s, "Epidemic Curves (Park 2017):", 6.8, 2.0, 6.0, 0.38, size=13, bold=True, color=GOLD)
epi_types = [
    ("Point Source", "Sharp single peak ≈ 1 incubation period (workplace/restaurant clusters)"),
    ("Propagated", "Successive waves = person-to-person spread (Ebola 2014–16, COVID pandemic)"),
    ("Ebola End Rule", "42 days (2× max incubation) after last confirmed case tests negative"),
]
for i, (et, desc) in enumerate(epi_types):
    y = 2.45 + i * 0.75
    txt(s, f"► {et}:", 6.8, y, 2.2, 0.38, size=12, bold=True, color=LIGHT_GRAY)
    txt(s, desc, 9.05, y, 3.75, 0.6, size=12, color=LIGHT_GRAY)

txt(s, "Geographic Mapping:", 6.8, 4.75, 6.0, 0.38, size=13, bold=True, color=GOLD)
geo = [
    "Ebola: GIS tracked spread along Gueckedou → Conakry; border crossings guided ETU placement",
    "COVID: Spatial clusters in urban centres, LTCFs, transit hubs; wastewater mapped hotspots 5–7 days early",
]
for i, pt in enumerate(geo):
    txt(s, f"▸  {pt}", 6.8, 5.2 + i*0.75, 6.0, 0.7, size=12, color=LIGHT_GRAY)

txt(s, "Demographic Patterns:", 6.8, 6.75, 6.0, 0.38, size=12, bold=True, color=GOLD)
txt(s, "COVID: Age + comorbidities + male sex = higher mortality.  Ebola: Women more exposed (caregiving roles)",
    6.8, 7.1, 6.0, 0.28, size=11, color=SUBTITLE_GRAY)

# ════════════════════════════════════════════════════════════════════════════
#  SLIDE 8  –  STAGE 6–7: HYPOTHESES & ECOLOGICAL FACTORS
# ════════════════════════════════════════════════════════════════════════════
s = blank(prs)
bg(s, DARK_NAVY)
section_divider(s, "Stages 6 & 7  ·  Hypotheses & Ecological Factors")

txt(s, "Hypothesis Testing & Ecological Context",
    0.4, 0.55, 12.5, 0.6, size=25, bold=True, color=WHITE)

# Stage 6 Hypotheses
rect(s, 0.3, 1.3, 12.7, 2.85, CARD_BG)
txt(s, "Stage 6 — Formulating & Testing Hypotheses", 0.5, 1.38, 8, 0.45,
    size=14, bold=True, color=GOLD)
rect(s, 0.5, 1.88, 12.0, 0.04, MID_NAVY)

hypo_cols = [
    ("COVID-19 Hypothesis Testing", COVID_BLUE, [
        "Initial focus: zoonotic spillover at Huanan Seafood Market",
        "Cluster investigations (choir, call centres) confirmed airborne spread in poor ventilation",
        "Genomic sequencing verified hospital ward transmission chains (Lorenzo-Redondo 2021)",
        "Led to updated ventilation guidelines and PPE protocols",
    ]),
    ("Ebola Hypothesis Testing", EBOLA_RED, [
        "Index cases linked to wild animal reservoirs — fruit bats & non-human primates",
        "Secondary spread via direct fluid contact confirmed through cluster analysis",
        "Ecological modelling: West Africa EVD risk matched Central African historical zones",
        "Showed spillover events were ecologically predictable with surveillance (Khandaker 2022)",
    ]),
]
for col_i, (title, color, points) in enumerate(hypo_cols):
    x = 0.45 + col_i * 6.4
    txt(s, title, x, 2.0, 6.1, 0.38, size=13, bold=True, color=color)
    for j, pt in enumerate(points):
        txt(s, f"▸  {pt}", x, 2.45 + j*0.48, 6.1, 0.44, size=12, color=LIGHT_GRAY)

# Stage 7 Ecological Factors
rect(s, 0.3, 4.35, 12.7, 2.85, CARD_BG)
txt(s, "Stage 7 — Evaluating Ecological Factors", 0.5, 4.43, 8, 0.45,
    size=14, bold=True, color=GOLD)
rect(s, 0.5, 4.93, 12.0, 0.04, MID_NAVY)

eco_items = [
    ("🏥", "Underfunded systems", "West Africa 2014: limited diagnostic capacity, rural health gaps, weak surveillance"),
    ("🤝", "Community trust", "Mistrust of health authorities slowed contact tracing + body handling compliance"),
    ("🌍", "Urbanisation & travel", "COVID: Dense cities + global air networks amplified spread exponentially"),
    ("🏠", "Socioeconomic barriers", "Informal housing, daily wage workers, late vaccine access in LMICs"),
    ("🌿", "One Health framework", "Both crises: integrating human–animal–environment monitoring catches spillover early (Khandaker 2022)"),
]
for i, (icon, title, detail) in enumerate(eco_items):
    x = 0.45 + (i % 3) * 4.27
    y = 5.08 + (i // 3) * 1.1
    rect(s, x, y, 4.0, 0.95, MID_NAVY)
    txt(s, icon + "  " + title, x+0.1, y+0.04, 3.8, 0.38, size=12, bold=True, color=GOLD)
    txt(s, detail, x+0.1, y+0.48, 3.8, 0.44, size=11, color=LIGHT_GRAY)

# ════════════════════════════════════════════════════════════════════════════
#  SLIDE 9  –  STAGE 8: CONTROL MEASURES
# ════════════════════════════════════════════════════════════════════════════
s = blank(prs)
bg(s, DARK_NAVY)
section_divider(s, "Stage 8  ·  Implementing Control Measures")

txt(s, "Control Measures: Source · Host · Environment",
    0.4, 0.55, 12.5, 0.6, size=25, bold=True, color=WHITE)

# Ebola controls
rect(s, 0.3, 1.3, 6.2, 5.8, CARD_BG)
txt(s, "☣  Ebola Control Measures", 0.5, 1.38, 5.9, 0.42,
    size=15, bold=True, color=EBOLA_RED)
rect(s, 0.5, 1.85, 5.8, 0.04, EBOLA_RED)

ebola_controls = [
    ("🏥  Case Isolation (ETUs)", "Most effective transmission-interrupt; Ebola Treatment Units separated symptomatic cases (Bouba 2023)"),
    ("⚰  Safe & Dignified Burials", "Trained burial teams prevented direct body contact while respecting cultural customs"),
    ("🔍  Active Contact Tracing", "21-day daily monitoring of all contacts; Guinea 2021 tracked both Ebola + COVID protocols simultaneously"),
    ("🗣  Community Engagement", "Religious leaders + village elders countered misinformation, encouraged case reporting"),
    ("💉  Ring Vaccination", "rVSV-ZEBOV vaccine deployed via ring strategy in DRC; non-Zaire strains still rely on core PH measures"),
]
for i, (title, detail) in enumerate(ebola_controls):
    y = 2.0 + i * 1.0
    txt(s, title, 0.5, y, 5.8, 0.38, size=12, bold=True, color=GOLD)
    txt(s, detail, 0.5, y + 0.42, 5.8, 0.52, size=11, color=LIGHT_GRAY)

# COVID controls
rect(s, 6.85, 1.3, 6.2, 5.8, CARD_BG)
txt(s, "🦠  COVID-19 Control Measures", 7.05, 1.38, 5.9, 0.42,
    size=15, bold=True, color=COVID_BLUE)
rect(s, 7.05, 1.85, 5.8, 0.04, COVID_BLUE)

covid_controls = [
    ("😷  NPIs", "Physical distancing, mask mandates, ventilation upgrades, travel restrictions, lockdowns"),
    ("🧪  Test–Trace–Isolate", "Decentralised RT-PCR + Ag-RDT networks for rapid case identification & isolation"),
    ("🌊  Wastewater Surveillance", "Community-level viral visibility; detected surges 5–7 days before hospital admissions rose (Prandi 2022)"),
    ("📱  Digital Tools", "DCT apps provided supplementary data; manual tracers remained indispensable (Mazza 2021)"),
    ("💉  Vaccine Rollout", "mRNA, viral vector, protein subunit vaccines; global dashboards tracked coverage + effectiveness (WHO 2022)"),
]
for i, (title, detail) in enumerate(covid_controls):
    y = 2.0 + i * 1.0
    txt(s, title, 7.05, y, 5.8, 0.38, size=12, bold=True, color=GOLD)
    txt(s, detail, 7.05, y + 0.42, 5.8, 0.52, size=11, color=LIGHT_GRAY)

# IHR note
rect(s, 0.3, 7.18, 12.7, 0.3, MID_NAVY)
txt(s, "International Health Regulations (IHR 2005) provided the global reporting framework — pandemic exposed gaps in data sharing and resource equity",
    0.5, 7.21, 12.3, 0.25, size=10, color=SUBTITLE_GRAY, align=PP_ALIGN.CENTER)

# ════════════════════════════════════════════════════════════════════════════
#  SLIDE 10  –  COMPARATIVE LESSONS
# ════════════════════════════════════════════════════════════════════════════
s = blank(prs)
bg(s, DARK_NAVY)
section_divider(s, "Key Lessons  ·  2021 Dual Outbreak Insights")

txt(s, "5 Critical Lessons from Concurrent COVID-19 & Ebola",
    0.4, 0.55, 12.5, 0.6, size=23, bold=True, color=WHITE)

lessons = [
    ("01", GOLD,       "Protocol Adaptability",
     "Ebola field protocols from 2014–16 provided the baseline for COVID-19 field procedures. Quarantine durations were adapted to pathogen biology (Balde 2021)."),
    ("02", COVID_BLUE, "Shared Laboratory Capacity",
     "COVID-19 PCR platforms in Guinea were rapidly repurposed for Ebola sample processing in 2021 — broad diagnostic investment pays dividends across threats."),
    ("03", EBOLA_RED,  "Importance of Community Trust",
     "Compliance with quarantine, testing, and safety protocols depended on public trust — equally critical in rural African villages and major metropolitan centres."),
    ("04", GREEN,      "Epidemiological Modelling",
     "Mathematical modelling shifted from academic research to real-time operational planning: guiding intervention strategies and hospital capacity decisions (Bouba 2023)."),
    ("05", RGBColor(0xFF,0x80,0x00), "Genomic Surveillance Integration",
     "Next-generation sequencing provided rapid insight into viral evolution, transmission chains, and superspreading events alongside standard field investigations (Lorenzo-Redondo 2021)."),
]

for i, (num, col, title, detail) in enumerate(lessons):
    row = i // 3
    col_i = i % 3
    x = 0.3 + col_i * 4.35
    y = 1.35 + row * 2.55
    w = 4.1
    h = 2.3

    rect(s, x, y, w, h, CARD_BG)
    rect(s, x, y, 0.7, h, col)
    txt(s, num, x+0.05, y+0.75, 0.6, 0.7, size=22, bold=True,
        color=DARK_NAVY, align=PP_ALIGN.CENTER)
    txt(s, title, x+0.8, y+0.1, w-0.95, 0.5, size=13, bold=True, color=col)
    txt(s, detail, x+0.8, y+0.65, w-0.95, 1.55, size=11, color=LIGHT_GRAY)

# ════════════════════════════════════════════════════════════════════════════
#  SLIDE 11  –  WASTEWATER IMAGE SLIDE
# ════════════════════════════════════════════════════════════════════════════
s = blank(prs)
bg(s, DARK_NAVY)
section_divider(s, "Evidence Spotlight  ·  Wastewater-Based Epidemiology")

txt(s, "Wastewater Surveillance: Early Warning for COVID-19",
    0.4, 0.55, 12.5, 0.6, size=24, bold=True, color=WHITE)

# Try to embed wastewater surveillance image
ww_url = "https://cdn.orris.care/cdss_images/pmc_clinical_VQA_607ae7786b8d9d5a5ae3212f3188b3408f60b73f0d0963212a7aca3b44141e40.jpg"
embedded = embed_image(s, ww_url, 0.4, 1.3, 7.5, 5.7)
if not embedded:
    rect(s, 0.4, 1.3, 7.5, 5.7, CARD_BG)
    txt(s, "[Wastewater Epidemiology Chart]", 0.4, 3.5, 7.5, 0.8,
        size=18, color=SUBTITLE_GRAY, align=PP_ALIGN.CENTER)

rect(s, 8.2, 1.3, 4.9, 5.7, CARD_BG)
txt(s, "📊 Key Findings", 8.4, 1.4, 4.5, 0.45, size=14, bold=True, color=GOLD)
rect(s, 8.4, 1.9, 4.5, 0.04, GOLD)

ww_points = [
    "SARS-CoV-2 RNA detectable in sewage up to 5–7 days before clinical case surges",
    "Spearman rho = 0.69 correlation between wastewater viral load and diagnosed clinical cases",
    "Large WWTPs (>150k population): rho = 0.51   Small WWTPs: rho = 0.62",
    "Captured 2nd through 6th pandemic waves (Aug 2020 – Mar 2022)",
    "Logarithmic scaling reveals smaller waves hidden in linear views",
    "PMMoV normalisation accounts for dilution and population variance",
    "Environmental surveillance complements clinical testing in low-resource settings",
]
for i, pt in enumerate(ww_points):
    txt(s, f"▸  {pt}", 8.35, 2.08 + i*0.72, 4.7, 0.66, size=11.5, color=LIGHT_GRAY)

txt(s, "Source: Prandi et al. (2022) — Science in One Health",
    8.35, 6.8, 4.7, 0.3, size=10, color=SUBTITLE_GRAY, italic=True)

# ════════════════════════════════════════════════════════════════════════════
#  SLIDE 12  –  EBOLA PPE IMAGE SLIDE
# ════════════════════════════════════════════════════════════════════════════
s = blank(prs)
bg(s, DARK_NAVY)
section_divider(s, "Field Operations  ·  Infection Prevention & Control")

txt(s, "Personal Protective Equipment in Ebola Field Response",
    0.4, 0.55, 12.5, 0.6, size=24, bold=True, color=WHITE)

ppe_url = "https://cdn.orris.care/cdss_images/pmc_clinical_VQA_f2d849dc6247b32c79e705421a16a461518ef93f905af0a11c2d87a81237cc69.jpg"
embedded2 = embed_image(s, ppe_url, 0.4, 1.3, 6.2, 5.7)
if not embedded2:
    rect(s, 0.4, 1.3, 6.2, 5.7, CARD_BG)
    txt(s, "[PPE Training Image]", 0.4, 3.5, 6.2, 0.8,
        size=18, color=SUBTITLE_GRAY, align=PP_ALIGN.CENTER)

rect(s, 6.9, 1.3, 6.1, 5.7, CARD_BG)
txt(s, "☣  EVD PPE Protocol", 7.1, 1.4, 5.7, 0.45, size=14, bold=True, color=EBOLA_RED)
rect(s, 7.1, 1.9, 5.7, 0.04, EBOLA_RED)

ppe_points = [
    "Full multi-layer PPE: head hood, goggles, isolation gown, fluid-resistant apron",
    "Double gloving + high-top boot covers standard for EVD patient contact",
    "Donning & doffing protocol strictly supervised — highest risk during removal",
    "Dedicated IPC training sessions before field deployment",
    "Unprotected HCW contacts = early amplification events in both COVID & Ebola",
    "PPE shortages documented at outset of both crises",
    "Adequate PPE + correct use can protect HCWs even in high-risk settings",
]
for i, pt in enumerate(ppe_points):
    txt(s, f"▸  {pt}", 7.1, 2.08 + i * 0.68, 5.7, 0.62, size=12, color=LIGHT_GRAY)

txt(s, "Source: Viral Haemorrhagic Fever IPC training materials",
    7.1, 6.8, 5.7, 0.3, size=10, color=SUBTITLE_GRAY, italic=True)

# ════════════════════════════════════════════════════════════════════════════
#  SLIDE 13  –  CONCLUSION
# ════════════════════════════════════════════════════════════════════════════
s = blank(prs)
bg(s, DARK_NAVY)
rect(s, 0, 0, 13.333, 0.12, GOLD)

txt(s, "CONCLUSION", 0.4, 0.2, 12, 0.6, size=30, bold=True, color=WHITE)
rect(s, 0.4, 0.9, 5.5, 0.045, GOLD)

# Large conclusion statement
rect(s, 0.3, 1.1, 12.7, 1.6, CARD_BG)
txt(s,
    '"Epidemic preparedness cannot be built in the middle of a crisis. '
    'Stopping dangerous pathogens requires lab capacity, trained field staff, '
    'clear communication channels, and community trust — established long before an outbreak starts."',
    0.55, 1.2, 12.2, 1.4, size=15, italic=True, color=GOLD, align=PP_ALIGN.CENTER)

# 3 conclusion pillars
pillars = [
    ("⚙  Method", COVID_BLUE, [
        "Field epidemiology is flexible and pragmatic — multiple stages run simultaneously",
        "Core steps: verify → define → trace → analyse → test hypotheses → intervene",
        "Approaches adapt in real time to incoming field data",
    ]),
    ("🔬  Technology", EBOLA_RED, [
        "Genomic sequencing, wastewater surveillance, and digital tools enhanced classic methods",
        "Shared diagnostic platforms demonstrated cross-threat infrastructure value",
        "Tools improve — but cannot replace fundamental public health investment",
    ]),
    ("🌍  Systems", GREEN, [
        "Health system strengthening in LMICs is the foundation of outbreak control",
        "One Health integration is essential for early spillover detection",
        "Equity in vaccines, diagnostics, and resources determines response effectiveness",
    ]),
]
for i, (title, color, points) in enumerate(pillars):
    x = 0.3 + i * 4.35
    rect(s, x, 2.9, 4.1, 3.65, CARD_BG)
    rect(s, x, 2.9, 4.1, 0.1, color)
    txt(s, title, x+0.15, 3.05, 3.8, 0.45, size=14, bold=True, color=color)
    for j, pt in enumerate(points):
        txt(s, f"▸  {pt}", x+0.15, 3.58 + j*0.82, 3.82, 0.76, size=11.5, color=LIGHT_GRAY)

# Final message
rect(s, 0.3, 6.72, 12.7, 0.68, MID_NAVY)
txt(s,
    "Both COVID-19 and Ebola prove that the fundamentals of field epidemiology remain unchanged. "
    "What evolves is how quickly and equitably we apply them.",
    0.55, 6.8, 12.2, 0.52, size=13, bold=True, color=WHITE, align=PP_ALIGN.CENTER)

# ════════════════════════════════════════════════════════════════════════════
#  SLIDE 14  –  REFERENCES
# ════════════════════════════════════════════════════════════════════════════
s = blank(prs)
bg(s, DARK_NAVY)
rect(s, 0, 0, 13.333, 0.12, GOLD)

txt(s, "REFERENCES", 0.4, 0.2, 12, 0.55, size=28, bold=True, color=WHITE)
rect(s, 0.4, 0.82, 4.5, 0.045, GOLD)

refs_col1 = [
    "1.  Osungbade & Oni (2014). Ebola outbreaks in West Africa. Afr J Med. PMID: 25474983",
    "2.  Okware et al. (2002). Ebola in Uganda. Trop Med Int Health. PMID: 12460399",
    "3.  Bouba et al. (2023). Predicting EVD combined interventions. PLoS ONE. PMID: 36649296",
    "4.  Mazza et al. (2021). Digital contact tracing systematic review. Acta Biomed. PMID: 34889315",
    "5.  Chakrabartty et al. (2022). Comparative RNA viruses overview. Ann Med Surg. PMID: 35721786",
    "6.  Lorenzo-Redondo et al. (2021). Molecular epidemiology HIV & SARS-CoV-2. Curr Opin HIV. PMID: 33186230",
    "7.  Bulut & Kato (2020). Epidemiology of COVID-19. Turk J Med Sci. PMID: 32299206",
    "8.  Singhal (2020). Review of COVID-19. Indian J Pediatr. PMID: 32166607",
]
refs_col2 = [
    "9.   Hossain et al. (2023). SARS-CoV-2 serosurvey, Somalia. J Infect Public Health. PMID: 37094495",
    "10.  Prandi et al. (2022). Wastewater-based COVID-19, Brazil. Sci One Health. PMID: 39076600",
    "11.  Park K. (2017). Park's Textbook of Preventive & Social Medicine (24th ed.). ISBN: 9789382219163",
    "12.  WHO COVID-19 Surveillance Database (2022). PLoS ONE. PMC: 9685131",
    "13.  Balde et al. (2021). Ebola amid COVID-19 in Guinea. Am J Trop Med Hyg. PMC: 8176515",
    "14.  WHO (2026). Outbreak Investigation Stages — Outbreak Toolkit",
    "15.  CDC (2026). Public Health Guidance for Ebola Disease. US-DHHS",
    "16.  Khandaker et al. (2022). Lessons from Ebola and COVID-19. Infect Drug Resist. DOI: 10.2147/IDR.S382607",
]

rect(s, 0.3, 1.0, 6.2, 6.3, CARD_BG)
for i, ref in enumerate(refs_col1):
    txt(s, ref, 0.45, 1.1 + i * 0.72, 5.95, 0.68, size=11, color=LIGHT_GRAY)

rect(s, 6.85, 1.0, 6.2, 6.3, CARD_BG)
for i, ref in enumerate(refs_col2):
    txt(s, ref, 7.0, 1.1 + i * 0.72, 5.95, 0.68, size=11, color=LIGHT_GRAY)

txt(s, "Washington State DOH (2014). EVD Reporting & Investigation Guideline. DOH Pub 420-126",
    0.45, 7.1, 12.5, 0.3, size=10, color=SUBTITLE_GRAY, italic=True)

# ════════════════════════════════════════════════════════════════════════════
#  SLIDE 15  –  THANK YOU
# ════════════════════════════════════════════════════════════════════════════
s = blank(prs)
bg(s, DARK_NAVY)
rect(s, 0, 0, 13.333, 0.12, GOLD)
rect(s, 0, 7.38, 13.333, 0.12, GOLD)

txt(s, "THANK YOU", 0.5, 1.2, 12.5, 1.2, size=64, bold=True, color=WHITE,
    align=PP_ALIGN.CENTER)
txt(s, "for your attention", 0.5, 2.45, 12.5, 0.65, size=28, color=GOLD,
    align=PP_ALIGN.CENTER, italic=True)

rect(s, 2.0, 3.3, 9.333, 0.05, MID_NAVY)

txt(s, "Outbreak Investigations in the Modern Era", 0.5, 3.5, 12.5, 0.55,
    size=18, color=LIGHT_GRAY, align=PP_ALIGN.CENTER)
txt(s, "A Comparative Analysis of COVID-19 and Ebola Virus Disease",
    0.5, 4.05, 12.5, 0.5, size=16, color=SUBTITLE_GRAY, align=PP_ALIGN.CENTER)

rect(s, 4.5, 4.85, 4.333, 1.6, CARD_BG)
txt(s, "Shahab  |  Med21C", 4.5, 5.0, 4.333, 0.45, size=16, bold=True,
    color=WHITE, align=PP_ALIGN.CENTER)
txt(s, "Field Epidemiology  ·  Public Health", 4.5, 5.5, 4.333, 0.4,
    size=13, color=SUBTITLE_GRAY, align=PP_ALIGN.CENTER)
txt(s, "July 2026", 4.5, 5.95, 4.333, 0.35, size=12, color=SUBTITLE_GRAY,
    align=PP_ALIGN.CENTER)

txt(s, "Questions & Discussion", 0.5, 6.6, 12.5, 0.5, size=20,
    color=COVID_BLUE, align=PP_ALIGN.CENTER, bold=True)

# ── Save ────────────────────────────────────────────────────────────────────
out_path = "/tmp/workspace/outbreak-presentation/Outbreak_Investigations_COVID19_Ebola.pptx"
buf = BytesIO()
prs.save(buf)
with open(out_path, "wb") as f:
    f.write(buf.getvalue())

print(f"✅  Presentation saved: {out_path}")
print(f"    Slides: {len(prs.slides)}")
cd /tmp/workspace/outbreak-presentation && python build_pptx.py 2>&1
python3 -c " import requests, base64 from io import BytesIO urls = [ 'https://cdn.orris.care/cdss_images/pmc_clinical_VQA_607ae7786b8d9d5a5ae3212f3188b3408f60b73f0d0963212a7aca3b44141e40.jpg', 'https://cdn.orris.care/cdss_images/pmc_clinical_VQA_f2d849dc6247b32c79e705421a16a461518ef93f905af0a11c2d87a81237cc69.jpg', ] for url in urls: r = requests.get(url, timeout=15) print(url[-30:], r.status_code, len(r.content)) "
python3 << 'PYEOF' # Patch: rebuild slides 11 and 12 with real images using requests import requests from io import BytesIO from pptx import Presentation from pptx.util import Inches, Pt from pptx.dml.color import RGBColor from pptx.enum.text import PP_ALIGN pptx_path = "/tmp/workspace/outbreak-presentation/Outbreak_Investigations_COVID19_Ebola.pptx" prs = Presentation(pptx_path) WHITE = RGBColor(0xFF,0xFF,0xFF) DARK_NAVY = RGBColor(0x0D,0x1B,0x2A) MID_NAVY = RGBColor(0x16,0x2A,0x4A) CARD_BG = RGBColor(0x16,0x2A,0x4A) SUBTITLE_GRAY = RGBColor(0xA8,0xB4,0xC8) LIGHT_GRAY = RGBColor(0xD8,0xDE,0xE9) GOLD = RGBColor(0xF0,0xB3,0x29) COVID_BLUE = RGBColor(0x1E,0x90,0xFF) EBOLA_RED = RGBColor(0xD7,0x26,0x3D) def fetch_image_bytes(url): r = requests.get(url, timeout=20) r.raise_for_status() return BytesIO(r.content) # Slide 11 = index 10 (0-based), Slide 12 = index 11 slide11 = prs.slides[10] slide12 = prs.slides[11] # Add image to slide 11 (wastewater chart) ww_url = "https://cdn.orris.care/cdss_images/pmc_clinical_VQA_607ae7786b8d9d5a5ae3212f3188b3408f60b73f0d0963212a7aca3b44141e40.jpg" img11 = fetch_image_bytes(ww_url) slide11.shapes.add_picture(img11, Inches(0.4), Inches(1.3), Inches(7.5), Inches(5.7)) print("✅ Slide 11 image added") # Add image to slide 12 (PPE) ppe_url = "https://cdn.orris.care/cdss_images/pmc_clinical_VQA_f2d849dc6247b32c79e705421a16a461518ef93f905af0a11c2d87a81237cc69.jpg" img12 = fetch_image_bytes(ppe_url) slide12.shapes.add_picture(img12, Inches(0.4), Inches(1.3), Inches(6.2), Inches(5.7)) print("✅ Slide 12 image added") buf = BytesIO() prs.save(buf) with open(pptx_path, "wb") as f: f.write(buf.getvalue()) print(f"✅ Re-saved with images: {pptx_path}") PYEOF
python3 -c " from pptx import Presentation prs = Presentation('/tmp/workspace/outbreak-presentation/Outbreak_Investigations_COVID19_Ebola.pptx') print(f'Total slides: {len(prs.slides)}') for i, slide in enumerate(prs.slides, 1): texts = [sh.text_frame.text[:60] for sh in slide.shapes if sh.has_text_frame and sh.text_frame.text.strip()] pics = sum(1 for sh in slide.shapes if sh.shape_type == 13) print(f' Slide {i:02d}: {texts[0] if texts else \"(empty)\"} | pics={pics}') import os size = os.path.getsize('/tmp/workspace/outbreak-presentation/Outbreak_Investigations_COVID19_Ebola.pptx') print(f'File size: {size/1024:.1f} KB') "
Outbreak Investigations COVID19 Ebola
Presentation · PPTX
What's Inside — 15 Professional Slides
| # | Slide | Highlights |
|---|---|---|
| 1 | Title Slide | Full-bleed dark navy design, dual pathogen icons (🦠 COVID / ☣ Ebola), gold stripe accents, your name + group |
| 2 | Abstract | Research overview + 4 core objectives with numbered icon cards |
| 3 | Pathogen Profiles | Side-by-side comparison table: transmission, R₀, CFR, incubation, asymptomatic spread |
| 4 | Stage 1 — Verifying Diagnosis | Wuhan cluster vs. Uganda/Guinea EVD; lab + field rule highlighted |
| 5 | Stage 2 — Case Definitions | WHO's 9 updates for COVID; Ebola's 4-tier Alert→Confirmed system |
| 6 | Stage 3 — Contact Tracing | Ebola 21-day field tracing (2.5% SAR, Gulu) vs. digital tracing apps review |
| 7 | Stages 4–5 — Line Lists & Epi Curves | Denominator problem, attack rates, point-source vs. propagated patterns, GIS mapping |
| 8 | Stages 6–7 — Hypotheses & Ecology | Zoonotic origins, airborne confirmation, One Health framework |
| 9 | Stage 8 — Control Measures | Full EVD + COVID-19 interventions side by side, IHR 2005 note |
| 10 | 5 Key Lessons | Colour-coded cards: adaptability, shared lab capacity, trust, modelling, genomics |
| 11 | Evidence Spotlight | Real wastewater surveillance chart (Prandi 2022) embedded with annotations |
| 12 | PPE & IPC | Real EVD PPE training image embedded with field protocol notes |
| 13 | Conclusion | 3 pillars (Method / Technology / Systems) with closing statement |
| 14 | References | All 17 citations formatted across two columns |
| 15 | Thank You | Clean closing slide with presenter info |