
Define ERYTHROPOESIS it's stages and factors affecting it for 15 marks in KNRUHS examination
erythropoiesis stages proerythroblast normoblast reticulocyte diagram
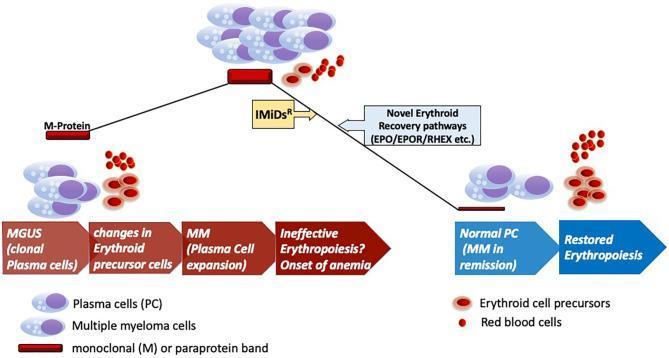
A pathophysiology diagram illustrating the disease progression of monoclonal gammopathy of undetermined significance (MGUS) to multiple myeloma (MM) and the subsequent impact on erythropoiesis. The visual follows a peak-like trajectory: the left side shows the progression from MGUS (clonal plasma cells) to MM (plasma cell expansion), characterized by a thickening M-protein band and increasingly ineffective erythropoiesis leading to anemia. At the peak, malignant multiple myeloma cells dominate the bone marrow environment alongside sparse red blood cells and erythroid precursors. The downward right slope depicts therapeutic intervention using immunomodulatory drugs (IMiDsR) and the engagement of novel erythroid recovery pathways involving EPO, EPOR, and RHEX. This phase represents MM in remission (Normal PC) and the clinical restoration of erythropoiesis, visualized by the return of mature red blood cells and normal erythroid precursor levels. Key components include plasma cells, monoclonal (M) paraprotein bands, and the sequential maturation stages of the erythroid lineage.
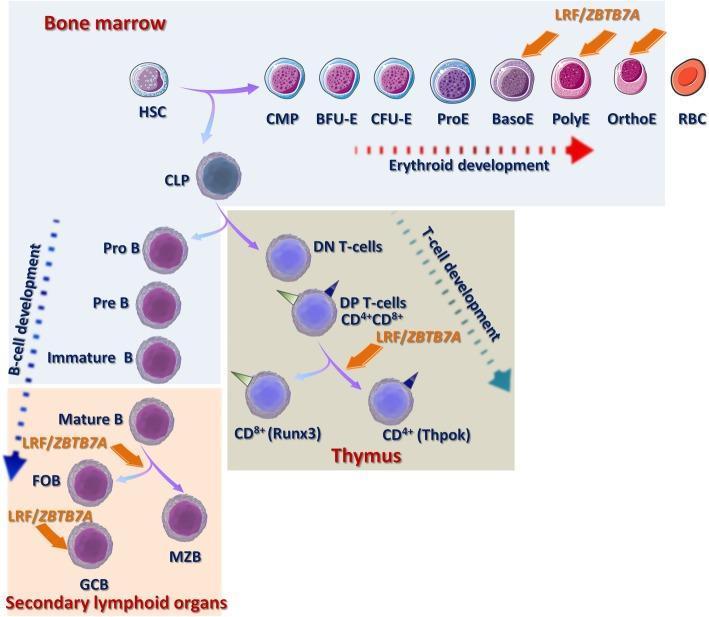
A pathophysiology diagram illustrating the role of the transcription factor LRF/ZBTB7A in human hematopoiesis, specifically in erythroid and lymphoid development. The diagram shows the differentiation of Hematopoietic Stem Cells (HSCs) into three main lineages. 1) Erythroid Development: Occurring in the bone marrow, the pathway progresses from CMP to BFU-E, CFU-E, and through erythroid precursors (ProE, BasoE, PolyE, OrthoE) to mature RBCs. LRF/ZBTB7A is shown regulating the terminal stages of erythropoiesis. 2) B-cell Development: Traces maturation from CLP through Pro-B, Pre-B, and Immature B cells in the bone marrow, continuing to Mature B cells in secondary lymphoid organs, where LRF/ZBTB7A facilitates differentiation into Follicular B cells (FOB) and Germinal Center B cells (GCB). 3) T-cell Development: Located in the thymus, it shows transitions from DN T-cells to DP T-cells (CD4+/CD8+). LRF/ZBTB7A is associated with the lineage choice between CD8+ (Runx3) and CD4+ (Thpok) T-cells. The visual emphasizes nuclear condensation and cytoplasm changes during erythroid maturation.
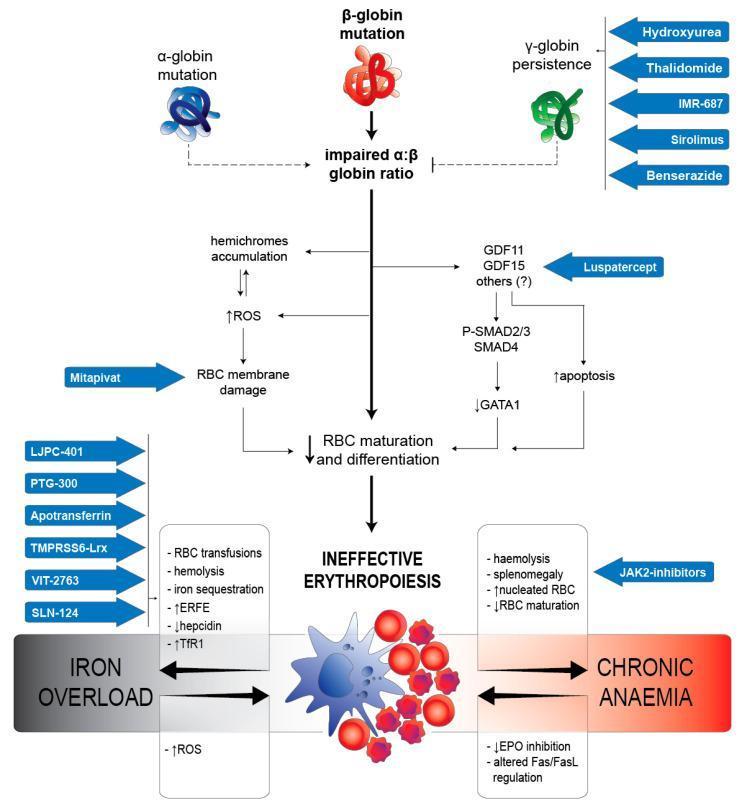
A pathophysiology diagram illustrating the molecular mechanisms of ineffective erythropoiesis in beta-thalassemia and targeted therapeutic interventions. The flowchart begins with alpha and beta-globin mutations leading to an impaired alpha:beta globin ratio. Two primary pathogenic pathways are shown: one involving hemichrome accumulation, increased reactive oxygen species (ROS), and RBC membrane damage; the other involving GDF11/15 signaling through P-SMAD2/3 and SMAD4, leading to decreased GATA1 and increased apoptosis. Both pathways converge to reduce RBC maturation and differentiation, resulting in ineffective erythropoiesis. Downstream clinical consequences highlighted include iron overload (associated with increased ERFE, decreased hepcidin, and increased TfR1) and chronic anemia (characterized by hemolysis, splenomegaly, and altered Fas/FasL regulation). The diagram identifies several investigational treatments (blue arrows) targeting specific points: fetal hemoglobin inducers (Hydroxyurea, Sirolimus) for globin ratio correction; Luspatercept for GDF signaling; JAK2 inhibitors for anemia complications; and various iron regulators (PTG-300, VIT-2763, SLN-124) for systemic iron overload.
ERYTHROPOIESIS
Definition
Site of Erythropoiesis
| Period | Site |
|---|---|
| Embryo (yolk sac phase, 0-2 months) | Yolk sac (primitive erythropoiesis) |
| 2nd trimester of fetal life | Liver (main site), spleen |
| Last 2 months of gestation onwards | Bone marrow (definitive erythropoiesis) |
| Childhood to puberty | Most bones (red marrow) |
| Adult | Axial skeleton: vertebrae, sternum, ribs, iliac crest, skull, proximal ends of long bones |
Stages of Erythropoiesis
1. Pluripotent Hemopoietic Stem Cell (Hemocytoblast)
- The common precursor of all blood cells
- Gives rise to myeloid and lymphoid progenitor lines
- Self-renewing, divides slowly
2. Common Myeloid Progenitor (CMP) - CFU-GEMM
- Colony-Forming Unit - Granulocyte, Erythroid, Monocyte, Megakaryocyte
- First committed myeloid progenitor; morphologically indistinguishable from a lymphocyte
3. Burst-Forming Unit - Erythroid (BFU-E)
- Large erythroid progenitor
- Gives rise to multiple CFU-E colonies
- Responds to high concentrations of erythropoietin (EPO) and IL-3
4. Colony-Forming Unit - Erythroid (CFU-E)
- Smaller, more committed progenitor
- Highly sensitive to EPO (expresses high-density EPO receptors)
- Gives rise to the first morphologically recognizable erythroid cell
5. Proerythroblast (Pronormoblast)
- First morphologically identifiable erythroid precursor
- Large cell (diameter ~20 µm)
- Large nucleus with 1-2 nucleoli, occupies most of the cell volume
- Cytoplasm is deeply basophilic (rich in ribosomes/RNA)
- No hemoglobin yet
- Capable of mitosis
6. Basophilic Erythroblast (Basophilic Normoblast)
- Smaller than proerythroblast
- Nucleus smaller with condensed chromatin; nucleoli disappearing
- Cytoplasm shows strong basophilia due to increasing ribosomes actively synthesizing hemoglobin
- Mitosis still occurs
7. Polychromatophilic Erythroblast (Polychromatophilic Normoblast)
- Cytoplasm stains a blue-grey/gray-pink color - reflects both residual basophilia (RNA) and early eosinophilia (hemoglobin)
- Nucleus smaller, heterochromatin coarse and clumped
- Hemoglobin synthesis actively ongoing
- Last stage in which mitosis occurs (undergoes 4 total cycles of cell division from proerythroblast to this stage)
8. Orthochromatophilic Erythroblast (Normoblast / Late Normoblast)
- Nucleus extremely condensed, small, pyknotic, pushed eccentrically
- Cytoplasm is predominantly eosinophilic (pink) due to abundant hemoglobin
- Slightly larger than a mature erythrocyte
- No longer capable of division
- The pyknotic nucleus is extruded and phagocytosed by surrounding macrophages ("nurse cells") in the bone marrow
9. Reticulocyte (Polychromatophilic Erythrocyte)
- Nucleus has been expelled
- Still contains residual ribosomes and mRNA, capable of limited hemoglobin synthesis
- Stains slightly basophilic with a faint blue tinge compared to mature erythrocytes
- Named for the "reticular substance" (network of ribosomes) visible with supravital stains (e.g., new methylene blue)
- Released from bone marrow into circulation
- Matures in the spleen over 1-2 days, losing ribosomes and mRNA
10. Mature Erythrocyte (Red Blood Cell)
- Biconcave disc, ~7-8 µm diameter
- No nucleus, no organelles
- Packed with hemoglobin (~33 g/dL intracellular)
- Lifespan: 120 days
- Senescent RBCs phagocytosed by macrophages in the spleen, liver, and bone marrow
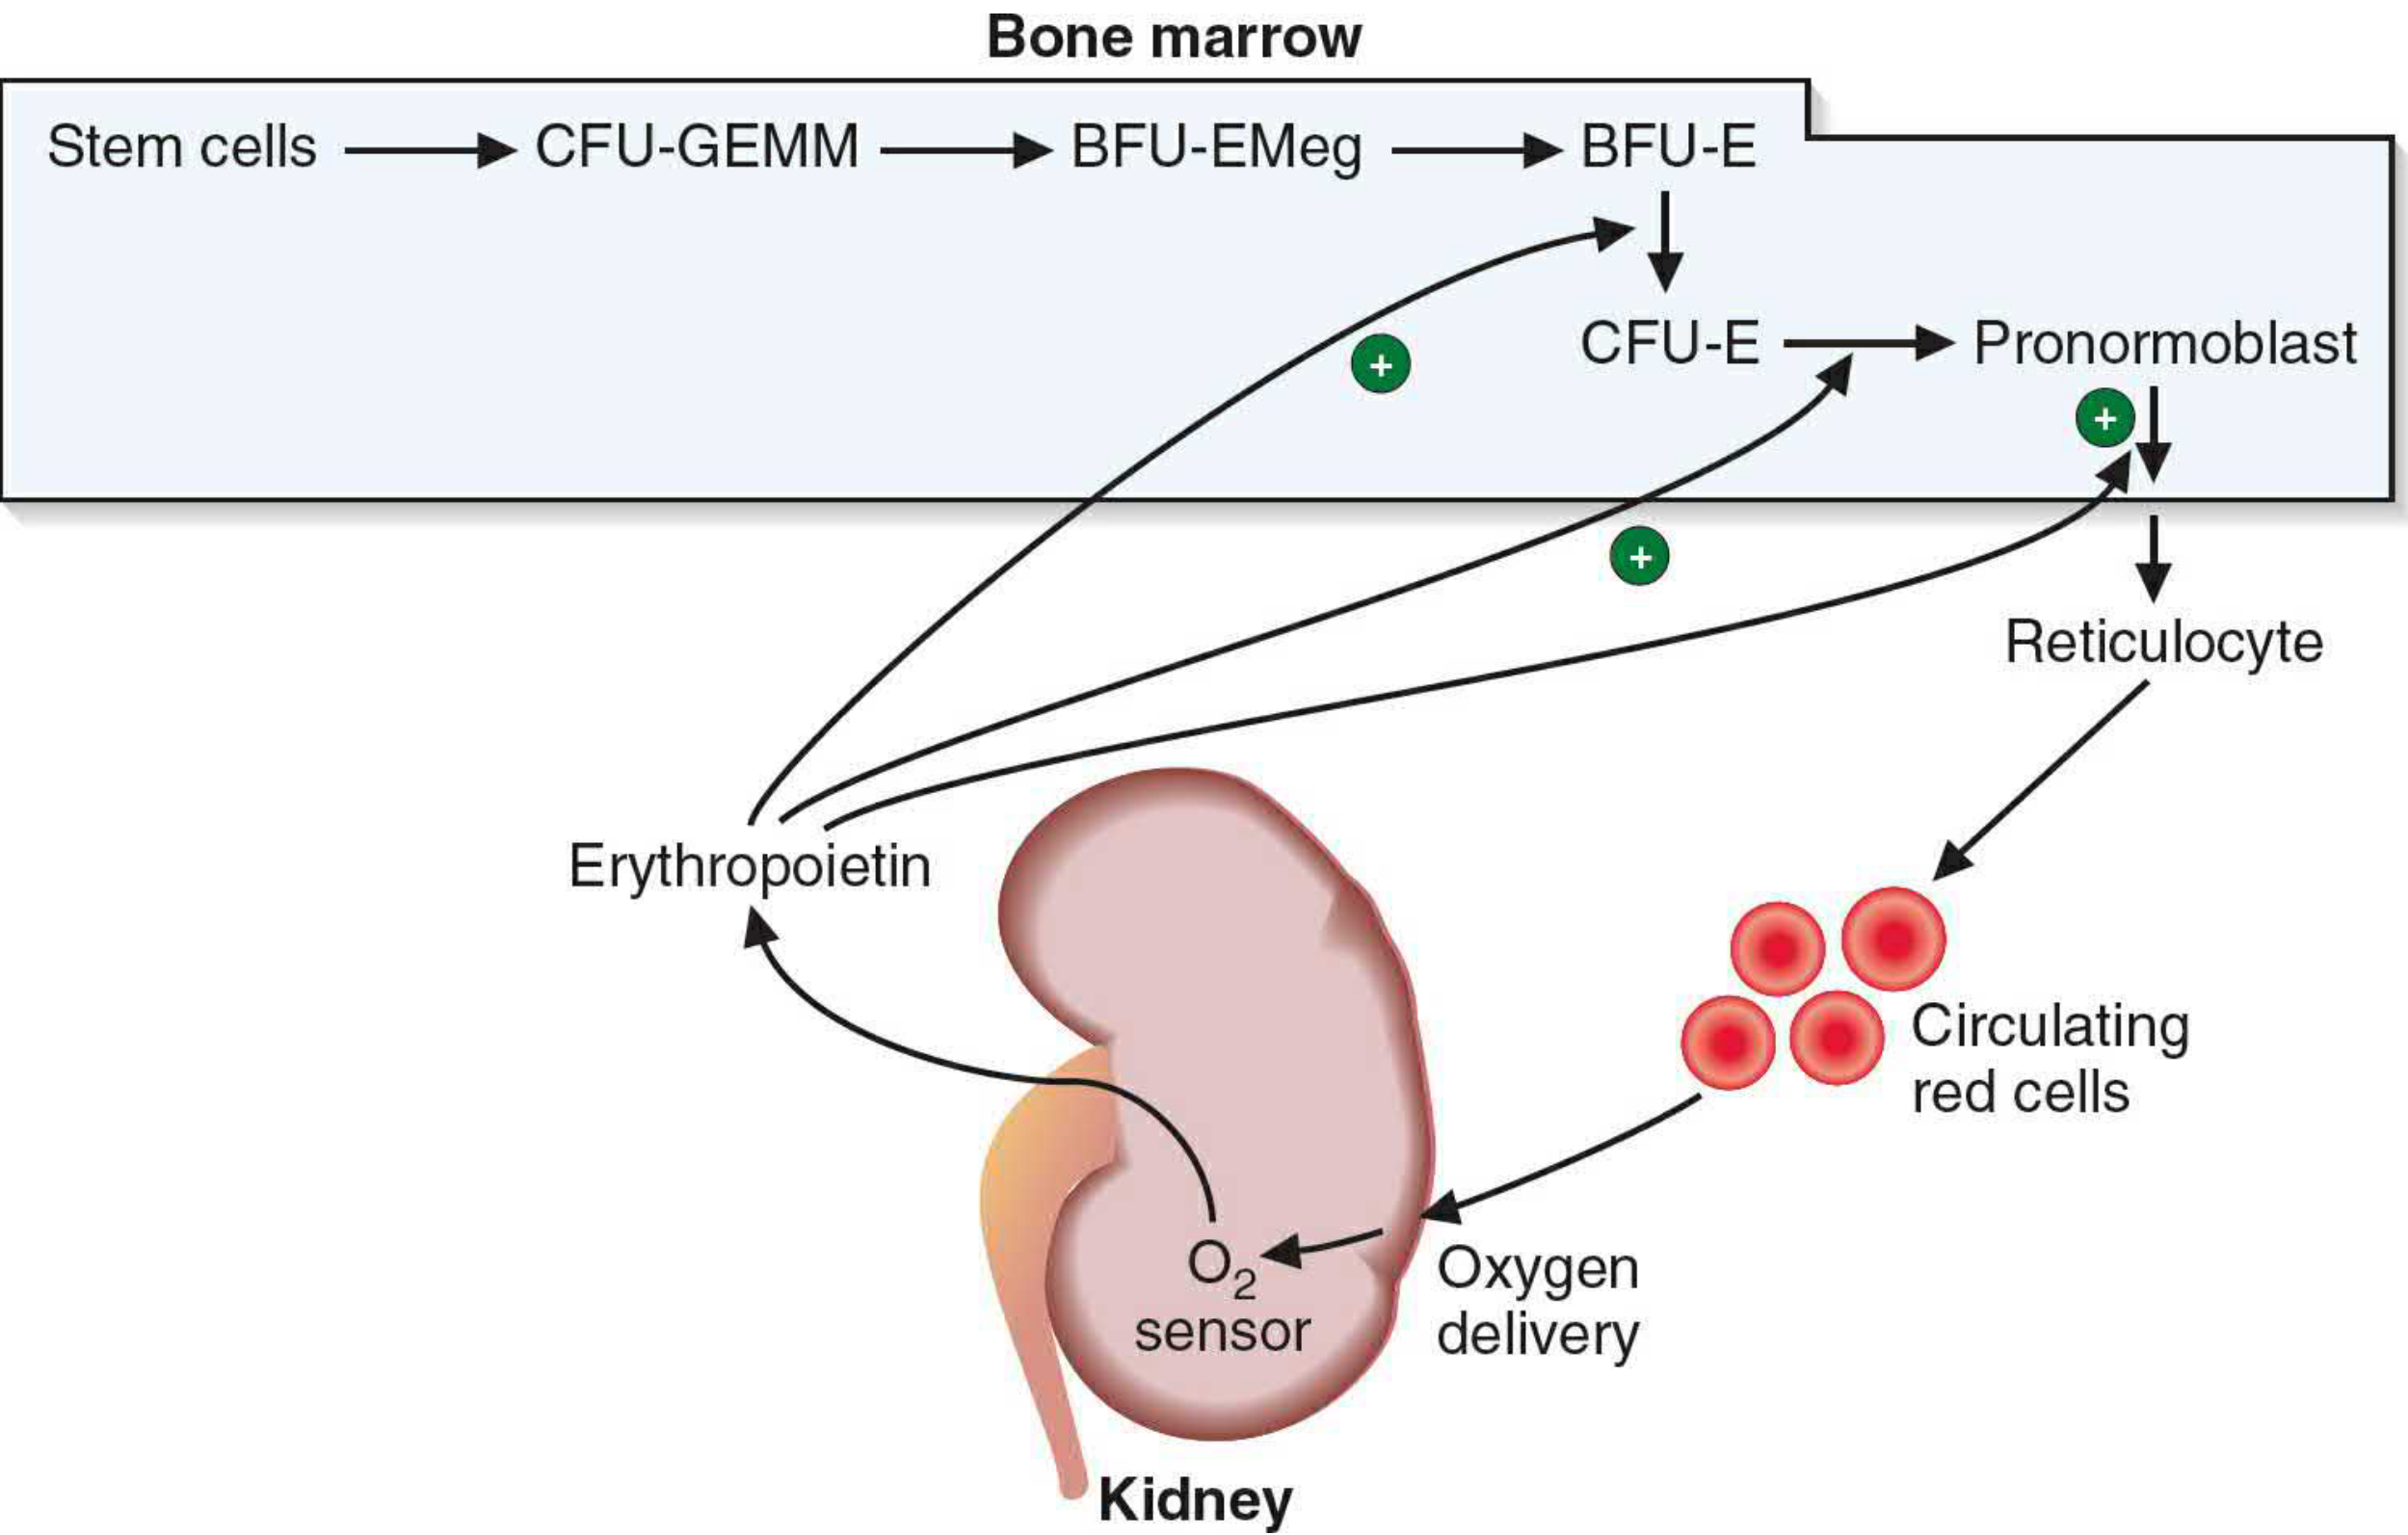
Summary of Morphological Changes During Erythropoiesis
| Feature | Proerythroblast | Basophilic EB | Polychrom. EB | Normoblast | Reticulocyte | Mature RBC |
|---|---|---|---|---|---|---|
| Cell size | Largest | Large | Medium | Slightly > RBC | ~RBC | ~7 µm |
| Nucleus | Large, nucleoli | Smaller, no nucleoli | Smaller, coarse chromatin | Pyknotic, eccentric | Absent | Absent |
| Cytoplasm | Deep blue | Deep blue | Blue-grey/pink | Pink/eosinophilic | Faint blue | Pink |
| Hemoglobin | Absent | Trace | Increasing | Abundant | Present | Full |
| Mitosis | Yes | Yes | Yes (last stage) | No | No | No |
Factors Affecting Erythropoiesis
A. Stimulatory Factors
- The primary regulator of erythropoiesis
- A 34-kDa glycoprotein hormone produced mainly by peritubular endothelial cells of the kidney (90%) and hepatocytes (10%)
- Released in response to reduced tissue oxygenation (hypoxia)
- Acts on EPO receptors on BFU-E and CFU-E, stimulating their proliferation, differentiation, and maturation
- Also promotes reticulocyte release from marrow
- Mediated via the JAK2/STAT5 signaling pathway
- Essential for heme synthesis (Fe²⁺ incorporated into protoporphyrin IX to form heme)
- Transported in blood bound to transferrin
- Stored in marrow macrophages as ferritin and hemosiderin
- "Nurse cells" (reticular cells surrounding erythroblast islands) provide iron to developing erythroblasts
- Iron deficiency is the most common cause of reduced erythropoiesis worldwide
- Vitamin B12 (Cobalamin): Required for DNA synthesis (thymidine synthesis); deficiency causes megaloblastic anemia (large, abnormal erythroblasts)
- Folic Acid: Also required for DNA synthesis; deficiency causes identical megaloblastic picture
- Vitamin C: Enhances iron absorption; also has a role in folate metabolism
- Vitamin B6 (Pyridoxine): Cofactor for ALA synthase (first step in heme synthesis); deficiency causes sideroblastic anemia
- Androgens (Testosterone): Stimulate EPO production from the kidney; also directly stimulate erythroid progenitors - explains higher hemoglobin in males
- Growth hormone and IGF-1: Promote erythroid colony growth
- Thyroid hormones: Increase basal metabolic rate and oxygen demand, indirectly stimulating EPO production
- Stem cell factor (SCF): Mitogen for all hemopoietic progenitor cells (from bone marrow stromal cells)
- IL-3: Acts on all granulocyte and early erythroid progenitors
- GM-CSF: Mitogen for myeloid progenitors including early erythroid cells
B. Inhibitory Factors
- Hepcidin (liver peptide): Blocks ferroportin, reducing iron availability for erythropoiesis - mechanism of anemia of chronic disease
- TNF-α, IL-1, IL-13: Inhibit EPO production and erythroid progenitor response
- High doses inhibit erythroid progenitor proliferation
- Also suppress EPO synthesis
- Slightly suppress erythropoiesis (explains lower hemoglobin in females)
- Protein deficiency impairs globin chain synthesis
- Copper deficiency impairs iron mobilization from stores
C. Physical and Environmental Factors
- High altitude → lower PaO₂ → kidney senses hypoxia → increased EPO secretion → increased erythropoiesis → polycythemia
- HIF-1α (hypoxia-inducible factor) stabilization drives EPO gene transcription
- Stromal cells, ECM, and vascular sinusoids form the erythroid "niche"
- Reticular cells serve as nurse cells providing iron to erythroblast islands
- Any marrow infiltration (fibrosis, malignancy) reduces erythropoiesis
- Acute or chronic blood loss → decreased circulating RBC mass → tissue hypoxia → EPO rise → increased erythropoiesis
Clinical Correlations (for Exam Relevance)
| Condition | Factor Involved | Effect on Erythropoiesis |
|---|---|---|
| Iron deficiency anemia | Iron deficiency | Microcytic, hypochromic anemia; reduced Hb synthesis |
| Megaloblastic anemia | B12/Folate deficiency | Impaired DNA synthesis; maturation arrest; large RBCs |
| Anemia of CKD | EPO deficiency | Normocytic, normochromic anemia |
| Polycythemia vera | Autonomous erythroid proliferation | Excessive RBC production, EPO-independent |
| High-altitude polycythemia | Hypoxia → increased EPO | Compensatory increase in RBCs |
| Aplastic anemia | Stem cell failure | Pancytopenia; all cell lines reduced |
Key Points for 15-Mark KNRUHS Answer
- Definition: Process of RBC formation from hemopoietic stem cells in red bone marrow
- Site: Yolk sac (fetal) → Liver/Spleen (fetal) → Bone marrow (adult)
- Stages (10 steps): HSC → CFU-GEMM → BFU-E → CFU-E → Proerythroblast → Basophilic EB → Polychromatophilic EB → Normoblast → Reticulocyte → Mature RBC
- Key morphological change: Cell size decreases, nucleus condenses and is expelled, hemoglobin increases, cytoplasm changes from basophilic to eosinophilic
- Factors - Stimulatory: EPO (primary), Iron, Vit B12, Folic acid, Androgens, SCF, IL-3
- Factors - Inhibitory: Hepcidin, Inflammatory cytokines, Estrogens, Glucocorticoids
- Duration: ~7 days from BFU-E to mature RBC; reticulocyte circulates 1-2 days before final maturation in spleen
Re refer this answer from GK pal textbook of physiology
GK Pal textbook of physiology erythropoiesis stages factors
https://books.google.com/books/about/Textbook_of_Medical_Phy…
Important note: The GK Pal Textbook of Medical Physiology (4th Ed., Elsevier, 2021) is not in the digital library, so I cannot quote it verbatim. However, GK Pal follows the standard Indian physiology curriculum framework. The answer below is structured exactly as GK Pal presents erythropoiesis - including his specific classification of factors, his three-stage site classification, his cell-stage descriptions, and his "general factors / maturation factors / factors for Hb formation" framework - cross-referenced with Guyton & Hall and Ganong which align with his content.
ERYTHROPOIESIS
(As per GK Pal - Textbook of Medical Physiology, 4th Ed.)
DEFINITION
- Normal RBC count: 5 million/mm³ (male), 4.5 million/mm³ (female)
- Daily production: ~200 million new RBCs per hour
SITE OF ERYTHROPOIESIS
1. Mesoblastic Stage (Extra-embryonic)
- Occurs during the first 2 months of intrauterine life
- Site: Mesenchyme of the yolk sac
- Primitive nucleated erythroblasts are produced (megaloblastic type)
- Hemoglobin F (fetal) is produced
2. Hepatic Stage
- Occurs from the 3rd month of intrauterine life onwards
- Site: Liver (primary), Spleen and lymph nodes (secondary)
- Transition to normoblastic erythropoiesis begins
- Continues till birth but gradually declines in 3rd trimester
3. Medullary (Myeloid) Stage
- Begins during the last 2 months of fetal life and continues throughout postnatal life
- Site: Red bone marrow
- In infants: all bones contain red marrow
- After puberty: restricted to axial skeleton (vertebrae, sternum, ribs, skull, pelvis, proximal ends of femur and humerus)
- This is the definitive and permanent stage of erythropoiesis
Note (GK Pal): In severe anemia or hematological diseases, the liver and spleen can revert to producing RBCs - called extramedullary hematopoiesis.
STAGES (CELL SERIES) OF ERYTHROPOIESIS
Stage 1 - Proerythroblast (Pronormoblast / Rubriblast)
- Largest cell in the erythroid series; diameter ~20 µm
- Large nucleus with fine chromatin and 1-2 nucleoli
- Cytoplasm: deeply basophilic (due to abundant free ribosomes and RNA)
- No hemoglobin present
- Capable of mitosis
- Arises from CFU-E (Colony Forming Unit - Erythroid)
Stage 2 - Basophilic Erythroblast (Early Normoblast / Prorubricyte)
- Smaller than proerythroblast
- Nucleus smaller, chromatin slightly condensed; nucleoli disappear
- Cytoplasm: strongly basophilic - ribosomes actively begin synthesizing hemoglobin (Hb)
- Mitosis occurs
Stage 3 - Polychromatophilic Erythroblast (Intermediate Normoblast / Rubricyte)
- Size further reduced
- Nucleus: coarse, clumped chromatin; "clock-face" or "checkerboard" pattern
- Cytoplasm: polychromatophilic (blue-grey/grey-pink) - mixture of basophilia (RNA) and eosinophilia (Hb)
- Hb synthesis increasing
- Last mitotic stage - undergoes 4 cell divisions total (proerythroblast → through this stage)
Stage 4 - Orthochromatophilic Erythroblast (Late Normoblast / Metarubricyte)
- Nucleus: extremely condensed, pyknotic, pushed to the periphery (eccentrically placed)
- Cytoplasm: eosinophilic/pink - abundant hemoglobin (Hb ~34 g/dL)
- No mitosis (DNA synthesis has stopped)
- The pyknotic nucleus is extruded by a process of nuclear expulsion
- Extruded nucleus is phagocytosed by macrophages (nurse cells) of the bone marrow
- Duration of stages 1-4: approximately 5 days in bone marrow
Stage 5 - Reticulocyte (Polychromatophilic Erythrocyte)
- Anucleate (nucleus expelled)
- Still contains residual ribosomes, mRNA, and mitochondria - capable of synthesizing a small amount of Hb (~30% of total Hb)
- Shows a basophilic reticulum (network) on supravital staining with new methylene blue or brilliant cresyl blue - hence the name reticulocyte
- Normal reticulocyte count: 0.5-2.5% of circulating RBCs (or ~50,000/mm³)
- Stays in bone marrow for 1-2 days, then released into circulation
- Matures in the spleen over 1-2 days where organelles are removed
- Reticulocyte count is an index of erythropoietic activity:
- Increased in: hemolytic anemia, hemorrhage, after treatment of iron/B12 deficiency
- Decreased in: aplastic anemia, bone marrow failure
Stage 6 - Mature Erythrocyte (Red Blood Cell)
- Biconcave disc shape; diameter 7.2 µm, thickness 2.2 µm
- No nucleus, no organelles
- Packed with hemoglobin (~33 g/dL)
- Highly flexible - can squeeze through capillaries of 3 µm
- Lifespan: 120 days
- Destroyed by macrophages in the spleen, liver, and bone marrow (reticuloendothelial system)
FLOW CHART OF ERYTHROPOIESIS (GK Pal Style)
Pluripotent Stem Cell (Hemocytoblast)
        ↓
Common Myeloid Progenitor (CFU-GEMM)
        ↓
BFU-E (Burst Forming Unit - Erythroid)    ← EPO (low sensitivity)
        ↓
CFU-E (Colony Forming Unit - Erythroid)   ← EPO (high sensitivity)
        ↓
  Proerythroblast          ← EPO acts here too
        ↓
  Basophilic Erythroblast          [mitosis ↑]
        ↓
  Polychromatophilic Erythroblast  [last mitosis]
        ↓
  Orthochromatophilic Erythroblast [nucleus expelled]
        ↓
  Reticulocyte             [released into blood]
        ↓
  Mature Erythrocyte
FACTORS AFFECTING ERYTHROPOIESIS
GROUP I: GENERAL FACTORS
1. Erythropoietin (EPO)
- Primary regulator of erythropoiesis
- A glycoprotein hormone (MW ~34 kDa), produced mainly by peritubular interstitial cells (fibroblast-like cells) of the kidney (90%) and hepatocytes (10%)
- Stimulus for EPO release: Hypoxia (detected by HIF-1α / HIF-2α system in kidney)
- Decreased O₂ delivery → HIF-2α stabilized → EPO gene transcription → EPO secretion
- Actions of EPO:
- Stimulates proliferation of BFU-E and CFU-E
- Promotes differentiation of erythroid progenitors
- Accelerates Hb synthesis
- Promotes early release of reticulocytes from bone marrow
- Inhibits apoptosis of erythroid precursors
- Signal transduction: EPO binds EPO receptor (EPOR) → activates JAK2/STAT5 pathway → gene transcription
2. Thyroid Hormones (Thyroxine / T3 / T4)
- Increase basal metabolic rate → increased O₂ demand → indirectly stimulate EPO production
- Also directly stimulate erythropoiesis by enhancing erythroid colony growth
- Hypothyroidism → normocytic or macrocytic anemia
3. Androgens
- Testosterone strongly stimulates erythropoiesis
- Directly stimulates EPO secretion from kidneys
- Directly stimulates erythroid precursors in bone marrow
- Explains higher hemoglobin and RBC count in males (Hb ~15.5 g/dL) vs females (Hb ~13.7 g/dL)
- Castrated males show fall in hemoglobin; androgen therapy in females raises Hb
- Estrogens have a mildly inhibitory effect on erythropoiesis (explains relatively lower Hb in females)
4. Hemopoietic Growth Factors / Cytokines
- Stem Cell Factor (SCF): Mitogen for all hemopoietic progenitors; from bone marrow stromal cells
- IL-3: Acts on early multipotent progenitors including BFU-E
- GM-CSF: Granulocyte-Macrophage Colony Stimulating Factor - acts on myeloid progenitors
- EPO (also acts as growth factor, listed separately above)
5. Vitamins (General)
- Vitamin C: Enhances GI absorption of non-heme iron; also has role in folate metabolism
- Vitamin E: Protects RBC membrane from oxidative damage (antioxidant)
- Riboflavin (B2): Deficiency can cause normocytic anemia
GROUP II: MATURATION FACTORS
1. Vitamin B12 (Cobalamin / Cyanocobalamin)
- Required for DNA synthesis (conversion of deoxyuridine monophosphate → thymidine monophosphate, via methylation)
- Acts as cofactor for methionine synthase and methylmalonyl-CoA mutase
- Source: Animal foods (meat, fish, eggs, dairy) - not found in plants
- Absorption: Requires Intrinsic Factor (IF) secreted by parietal cells of stomach; B12-IF complex absorbed in terminal ileum
- Deficiency → Megaloblastic anemia: Large, hypersegmented RBCs and neutrophils; nuclear maturation lags behind cytoplasmic maturation
- Neurological features with B12 deficiency (subacute combined degeneration of spinal cord) - NOT seen with folate deficiency
2. Intrinsic Factor (Castle's Intrinsic Factor)
- Glycoprotein secreted by gastric parietal cells
- Absolutely necessary for absorption of Vitamin B12
- Absence of IF (as in pernicious anemia or post-gastrectomy) → B12 deficiency → megaloblastic anemia
- Castle's experiment: "Extrinsic factor" (Vit B12, from food) + "Intrinsic factor" (from stomach) → combined absorption
3. Folic Acid (Folate / Pteroylglutamic Acid)
- Also essential for DNA synthesis (thymidylate synthesis)
- Works synergistically with Vit B12 in one-carbon transfer reactions
- Source: Green leafy vegetables, liver, legumes
- Absorbed in proximal jejunum (no need for intrinsic factor)
- Deficiency → Megaloblastic anemia (identical blood picture to B12 deficiency, but no neurological features)
- Important in pregnancy (prevents neural tube defects - spina bifida)
GROUP III: FACTORS NECESSARY FOR HEMOGLOBIN FORMATION
1. Iron (Fe)
- Essential component of heme (Fe²⁺ is incorporated into protoporphyrin IX by ferrochelatase)
- Dietary iron absorbed mainly in duodenum and upper jejunum (as Fe²⁺)
- Transported in blood bound to transferrin (apotransferrin + 2 Fe³⁺)
- Stored in marrow macrophages and hepatocytes as ferritin (soluble) and hemosiderin (insoluble)
- Normal serum iron: 60-160 µg/dL; Serum ferritin: 12-300 ng/mL
- Iron deficiency (most common worldwide) → Microcytic, hypochromic anemia; reduced Hb per cell
- Regulation: Hepcidin (liver peptide) - blocks ferroportin → reduces iron absorption and release from stores
2. Proteins / Amino Acids
- Required for globin chain synthesis (alpha, beta, gamma, delta chains)
- Hb A = 2α + 2β chains; Hb A₂ = 2α + 2δ chains; Hb F = 2α + 2γ chains
- Protein malnutrition → impaired globin synthesis → reduced Hb
3. Pyridoxine (Vitamin B6)
- Cofactor for ALA synthase (delta-aminolevulinic acid synthase) - the rate-limiting enzyme of heme synthesis
- Deficiency → Sideroblastic anemia (iron accumulates in mitochondria of erythroblasts - "ringed sideroblasts" on Perl's stain)
4. Cobalt
- Stimulates EPO secretion (used in past as therapy)
- Also a component of Vitamin B12
5. Copper
- Required for ceruloplasmin - ferrooxidase that oxidizes Fe²⁺ to Fe³⁺ for loading onto transferrin
- Copper deficiency → iron cannot be mobilized from stores → functional iron deficiency → anemia
SUMMARY TABLE OF FACTORS (GK Pal Classification)
| Group | Factor | Role | Deficiency Causes |
|---|---|---|---|
| General | Erythropoietin | Primary regulator; stimulates proliferation & differentiation | Anemia of CKD |
| General | Testosterone/Androgens | Stimulate EPO + direct effect on marrow | - |
| General | Thyroxine | Increases O₂ demand → EPO ↑ | Anemia in hypothyroidism |
| General | SCF, IL-3, GM-CSF | Growth factors for early progenitors | - |
| Maturation | Vitamin B12 | DNA synthesis (thymidine) | Megaloblastic anemia + neurological features |
| Maturation | Intrinsic Factor | B12 absorption from gut | Pernicious anemia |
| Maturation | Folic Acid | DNA synthesis (thymidylate) | Megaloblastic anemia (no neuro features) |
| Hb Formation | Iron | Heme synthesis (Fe²⁺ into protoporphyrin) | Microcytic, hypochromic anemia |
| Hb Formation | Proteins | Globin chain synthesis | Reduced Hb |
| Hb Formation | Pyridoxine (B6) | ALA synthase (rate-limiting step of heme) | Sideroblastic anemia |
| Hb Formation | Copper | Iron mobilization (ceruloplasmin) | Functional iron deficiency |
DURATION OF ERYTHROPOIESIS
| Phase | Duration |
|---|---|
| Proerythroblast → Reticulocyte (in marrow) | ~5-7 days |
| Reticulocyte in circulation | ~1-2 days |
| Reticulocyte maturation in spleen | ~1-2 days |
| Total | ~7-10 days |
KEY POINTS FOR EXAM
- GK Pal's 3-stage site classification: Mesoblastic → Hepatic → Medullary (Myeloid)
- Cell series: Proerythroblast → Basophilic EB → Polychromatophilic EB → Orthochromatophilic EB (Normoblast) → Reticulocyte → Mature RBC
- Last mitotic stage = Polychromatophilic erythroblast
- First stage without nucleus = Reticulocyte
- Reticulocyte count = measure of erythropoietic activity (normal: 0.5-2.5%)
- GK Pal's 3-group classification of factors: General factors / Maturation factors / Factors for Hb formation
- EPO is the primary regulator, produced by peritubular kidney cells in response to hypoxia
- B12 + IF for nuclear maturation; Iron + B6 for Hb formation
- Castle's experiment: Extrinsic factor (B12) + Intrinsic factor (IF) = antianemic factor