Explain the basics of ecg
Reading File
Finding Sources
Searching Images
ECG electrocardiogram waves P QRS T normal
Finding Sources
Finding Sources
Reading File
Reading File
Reading File
Reading File
Reading File
Loading Image
Loading Image
Here is a comprehensive overview of ECG basics, sourced from Goldman-Cecil Medicine.
Basics of the ECG (Electrocardiogram)
What Is an ECG?
An electrocardiogram (ECG or EKG) is a recording of the electrical activity of the heart over time. Electrodes placed on the skin detect tiny voltage changes produced by cardiac muscle depolarization (activation) and repolarization (recovery). These voltages are plotted as a waveform on gridded paper or a digital display.
The Cardiac Conduction System
The ECG reflects the orderly spread of electrical impulses through a specialized conduction system:
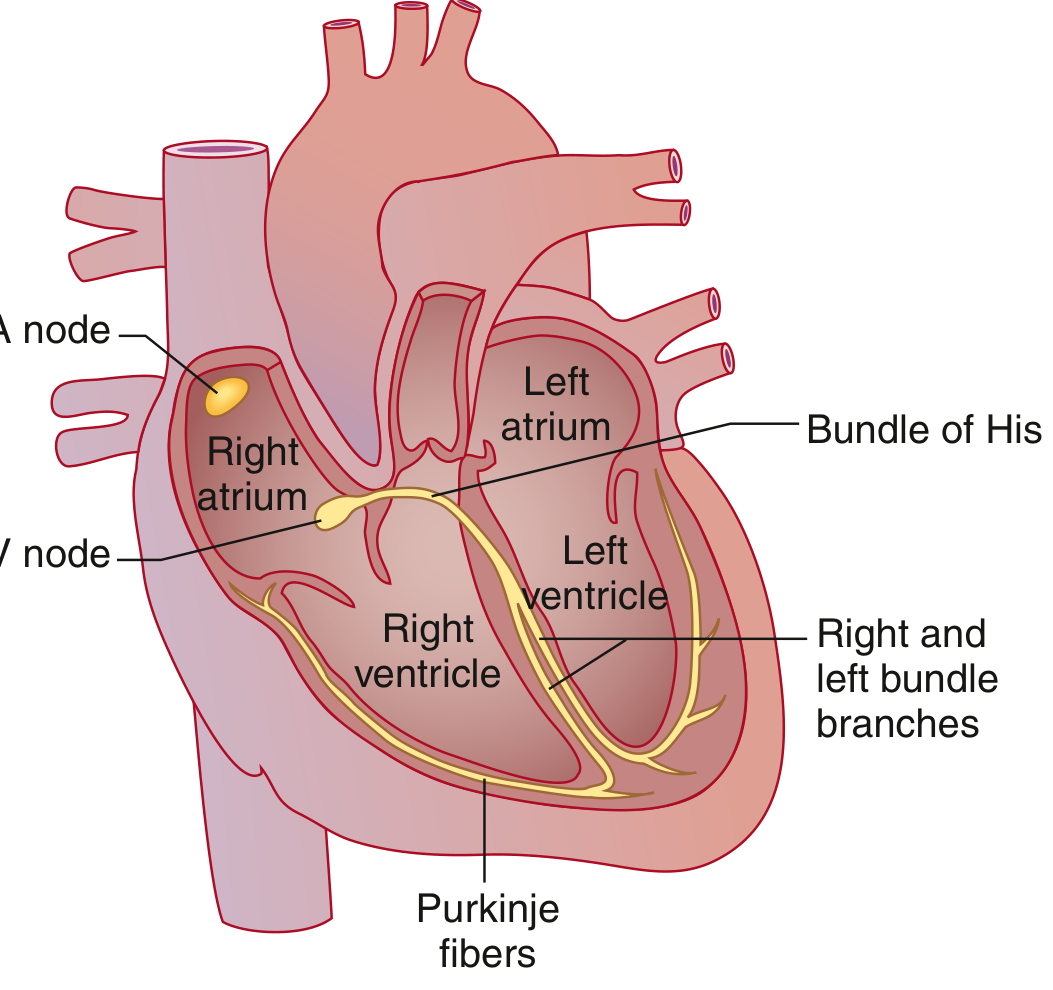
- SA node (sinoatrial node) — dominant pacemaker in the high right atrium; fires spontaneously at ~60–100 bpm.
- Atria — the wave front spreads through both atria (Bachmann bundle speeds it to the left atrium).
- AV node — the only normal electrical bridge between atria and ventricles; introduces a physiologic conduction delay.
- Bundle of His → right & left bundle branches → Purkinje fibers — rapid conduction through the ventricles ensures synchronous contraction.
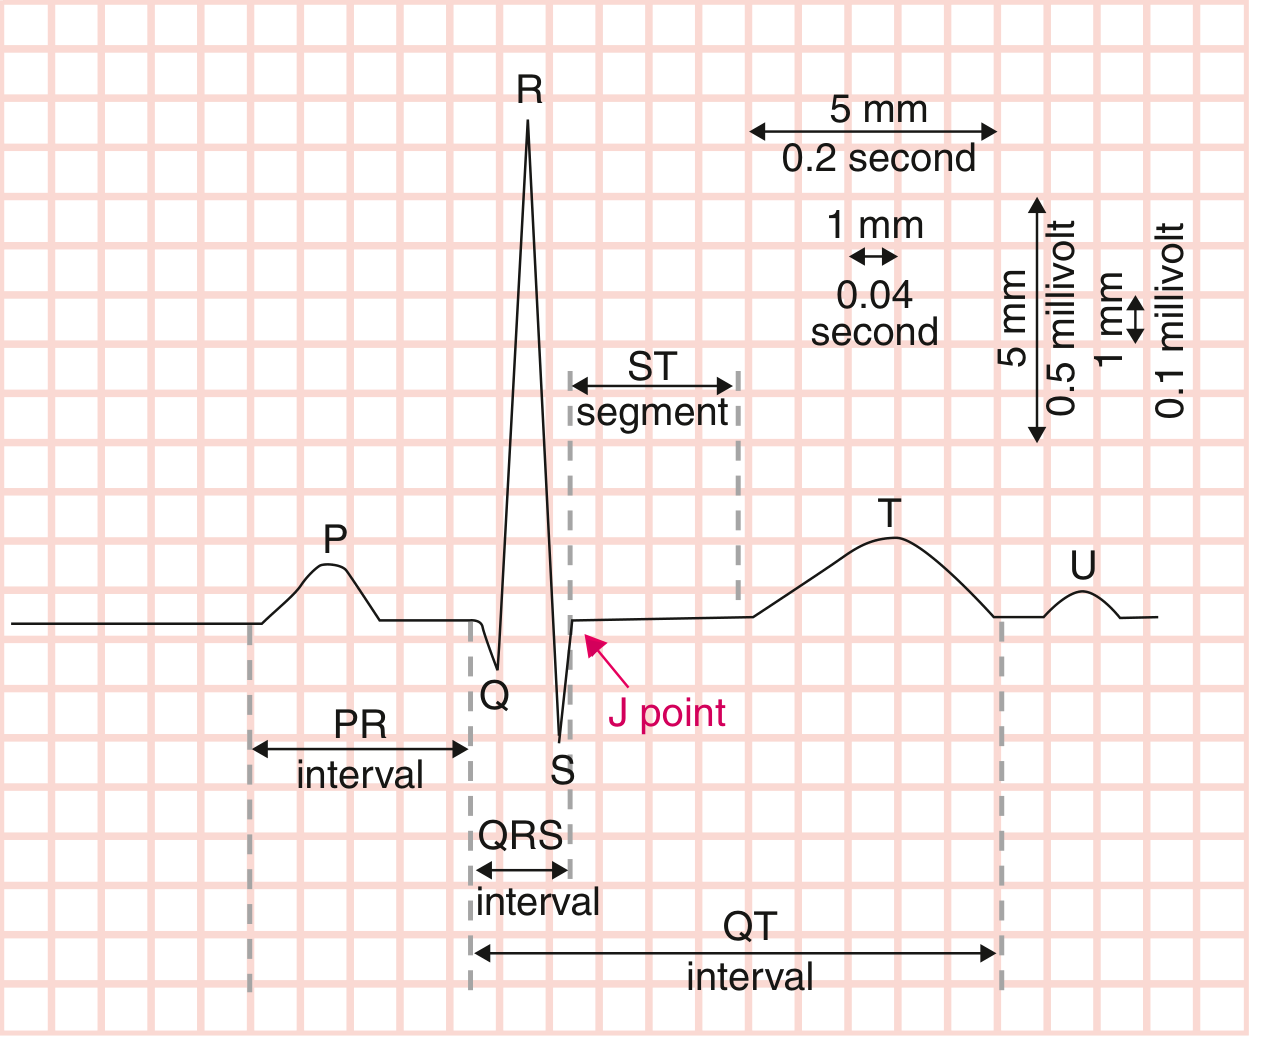
The ECG Waveform
| Wave / Segment | What It Represents |
|---|---|
| P wave | Atrial muscle depolarization (SA → atria) |
| PR interval | Conduction from atria through AV node and His-Purkinje system |
| QRS complex | Ventricular muscle depolarization; larger than P wave due to greater ventricular mass |
| J point | Junction between end of QRS and beginning of ST segment |
| ST segment | Early ventricular repolarization; normally isoelectric (flat) |
| T wave | Ventricular repolarization (electrical recovery) |
| U wave | Occasionally visible; likely reflects late ventricular repolarization or Purkinje repolarization |
| QT interval | Total ventricular electrical activity — from QRS onset to end of T wave |
Atrial repolarization also occurs but is buried inside the large QRS complex and is not visible on a standard ECG.
ECG Paper & Calibration
The standard ECG grid uses two axes:
- Horizontal (time): Each small box (1 mm) = 0.04 sec (40 ms); each large box (5 mm) = 0.2 sec (200 ms)
- Vertical (voltage): Each small box = 0.1 mV; 10 mm (two large boxes) = 1 mV
Recording speed is 25 mm/sec. A standard ECG covers 10 seconds total.
Normal Intervals
| Parameter | Normal Range |
|---|---|
| Heart rate | 50–100 bpm |
| P wave duration | < 120 ms (< 3 small boxes) |
| PR interval | 90–200 ms |
| QRS duration | 75–110 ms |
| QTc (corrected QT) | ≤ 450 ms (males), ≤ 460 ms (females) |
| QRS axis | −30° to +90° |
Calculating heart rate from a regular rhythm: count the number of large boxes between two R waves and divide into 300 (e.g., 4 large boxes → 300/4 = 75 bpm). On a 10-second strip, multiply the number of QRS complexes by 6.
The 12 Leads
A standard ECG uses 12 leads — each a different "vantage point" on cardiac electrical activity:
Limb leads (frontal plane)
- Bipolar leads I, II, III — measure voltage differences between pairs of limb electrodes.
- Lead I: left arm vs. right arm
- Lead II: left leg vs. right arm
- Lead III: left leg vs. left arm
- Augmented unipolar leads aVR, aVL, aVF — compare one limb to a composite reference of the other two.
- aVR: right arm; aVL: left arm; aVF: left foot (inferior)
- Because cardiac activation moves right→left and head→foot, P waves and QRS complexes are negative in aVR and positive in aVF.
Precordial (chest) leads V1–V6 (transverse plane)
Electrodes are placed across the chest. As you move from V1 (right of sternum) to V6 (lateral chest):
- V1: Dominant S wave (activation moving away), biphasic P wave (right then left atrial activation)
- V6: Dominant R wave (activation moving toward it)
- R-wave progression — the R wave grows and S wave shrinks from V1 to V6. The transition point (R = S) normally occurs at V3–V4.
Electrical Axis
The frontal plane QRS axis reflects the overall direction of ventricular depolarization.
- Normal: −30° to +90°
- Left axis deviation (LAD): more negative than −30° → seen in left anterior fascicular block, left ventricular hypertrophy
- Right axis deviation (RAD): beyond +90° → seen in right ventricular hypertrophy, pulmonary embolism, left posterior fascicular block
A quick rule: if QRS is positive in both leads I and II, the axis is normal.
Systematic Approach to ECG Interpretation
A stepwise approach avoids missing findings:
- Rate — Calculate from RR interval
- Rhythm — Regular or irregular? Sinus or not? (Look for P before every QRS)
- Axis — Normal, left, or right deviation?
- Intervals — PR, QRS duration, QTc
- Waveform morphology — P wave shape, R-wave progression, Q waves, ST elevation/depression, T-wave changes
- Compare to a prior ECG when available
Key Clinical Correlations
| ECG Finding | Clinical Significance |
|---|---|
| PR > 200 ms | First-degree AV block |
| Wide QRS > 110 ms | Bundle branch block or ventricular origin |
| ST elevation | Acute myocardial infarction (STEMI) until proven otherwise |
| ST depression | Ischemia, subendocardial injury |
| Prolonged QTc | Risk of torsades de pointes (e.g., drugs, electrolyte abnormalities) |
| Peaked T waves | Hyperkalemia |
| Absent P waves + irregular rhythm | Atrial fibrillation |
Sources: Goldman-Cecil Medicine, International Edition — Chapter 42: Electrocardiography
This is a shared conversation. Sign in to Orris to start your own chat.