
Emergency medical technician paramedic (ems paramedic) Completed course
You've completed your EMS Paramedic course — congratulations! How can I help you today?
- NREMT paramedic exam review (cognitive & psychomotor)
- Practice questions on pharmacology, ACLS, trauma, OB, peds
- High-yield topic summaries (12-lead ECG, RSI, CPAP, etc.)
- Drug dosages, mechanisms, and contraindications
- Assessment and management protocols (cardiac arrest, stroke, sepsis, etc.)
- Airway management (BVM, supraglottic, RSI/DAI)
- Trauma - TXA, tourniquet use, needle decompression, IO access
- ACLS / PALS / ITLS / PHTLS updates
- Medical vs. trauma priority calls
- Medication lists and routes for field use
- NREMT registration & recertification
- State licensure steps
- Specialty tracks (flight medic, critical care transport, ER tech)
Study so course syllabus One by one teach me
EMS Paramedic Course Syllabus
The 11 Core Modules (We'll cover these one by one)
| # | Module | Key Topics |
|---|---|---|
| 1 | Preparatory | EMS systems, roles, ethics, medical-legal, research |
| 2 | Anatomy & Physiology | Body systems, pathophysiology |
| 3 | Patient Assessment | Scene size-up, primary/secondary survey, history |
| 4 | Airway Management | BVM, intubation, RSI, surgical airway |
| 5 | Pharmacology | Drug classes, routes, calculations, specific drugs |
| 6 | Medical Emergencies | Cardiac, respiratory, neuro, GI, renal, endocrine |
| 7 | Shock & Resuscitation | Types of shock, fluid therapy, ACLS |
| 8 | Trauma | Kinematics, hemorrhage, TBI, thoracic, abdominal, MSK |
| 9 | Special Populations | OB/GYN, pediatrics, geriatrics, bariatrics |
| 10 | EMS Operations | ICS, MCI, hazmat, rescue, air medical |
| 11 | Advanced Skills | 12-lead ECG, IO access, CPAP, advanced procedures |
How We'll Work
- I'll teach one module at a time
- Each lesson includes: Core concepts → Key points → Clinical application → Practice questions
- You tell me when you're ready to move to the next topic
- You can ask questions at any point
Let's Begin: Module 1 - Preparatory
Topic 1.1 - The EMS System
- Emergency Medical Responder (EMR) - Basic life support, CPR, AED, bleeding control
- Emergency Medical Technician (EMT) - BLS + oxygen, glucose, epinephrine auto-injector
- Advanced EMT (AEMT) - EMT + IV access, some medications (epinephrine, nitro, glucose)
- Paramedic - Full ALS: RSI, 12-lead, drug therapy, advanced procedures
- Access - 911/dispatch
- Response - Units dispatched
- On-scene care - Your job
- Transport - Air/ground
- Hospital care - Handoff to ER team
- Rehabilitation - Patient recovery
Topic 1.2 - Roles & Responsibilities of the Paramedic
- Preparation - Know your equipment, drugs, and protocols
- Response - Safe, timely, appropriate
- Scene management - Safety first (scene size-up)
- Patient assessment & care - Primary and secondary survey
- Transport - Decision: load and go vs. stay and play
- Transfer of care - Complete, accurate handoff report
- Documentation - PCR (Patient Care Report) - legal document
- Patient advocacy - Always act in the patient's best interest
Topic 1.3 - Medical-Legal & Ethics
| Term | Meaning |
|---|---|
| Scope of Practice | What you are legally allowed to do |
| Standard of Care | What a reasonable paramedic would do in the same situation |
| Duty to Act | Legal obligation to respond and provide care |
| Negligence | Failure to meet standard of care causing harm |
| Abandonment | Stopping care without transferring to equal/higher level |
| Assault | Threatening to touch without consent |
| Battery | Touching without consent |
- Expressed (Informed) - Patient verbally agrees to care
- Implied - Unconscious patient; assumed they would consent
- Minor - Parent/guardian must consent (exception: emancipated minor)
- Involuntary - Court-ordered (psychiatric holds)
- Alert and oriented
- Understand the risks of refusal
- Not under the influence
Topic 1.4 - EMS Research & Evidence-Based Practice
- EMS evolves based on research and outcomes data
- You should understand how to read a study (observational vs. RCT)
- Practice guidelines (ACLS, PHTLS, etc.) are built on evidence
- You are expected to contribute to quality improvement (QI)
Module 1 Quick Review - Practice Questions
A: Implied consent
A: Battery
A: Ensure they are alert/oriented, explain the risks, have them sign a refusal form, and document thoroughly.
A: Scope of practice = what you're legally allowed to do. Standard of care = what a reasonable paramedic would do in the same situation.
Ready for Module 2?
2 . module with pictures details plz
human body systems anatomy overview diagram
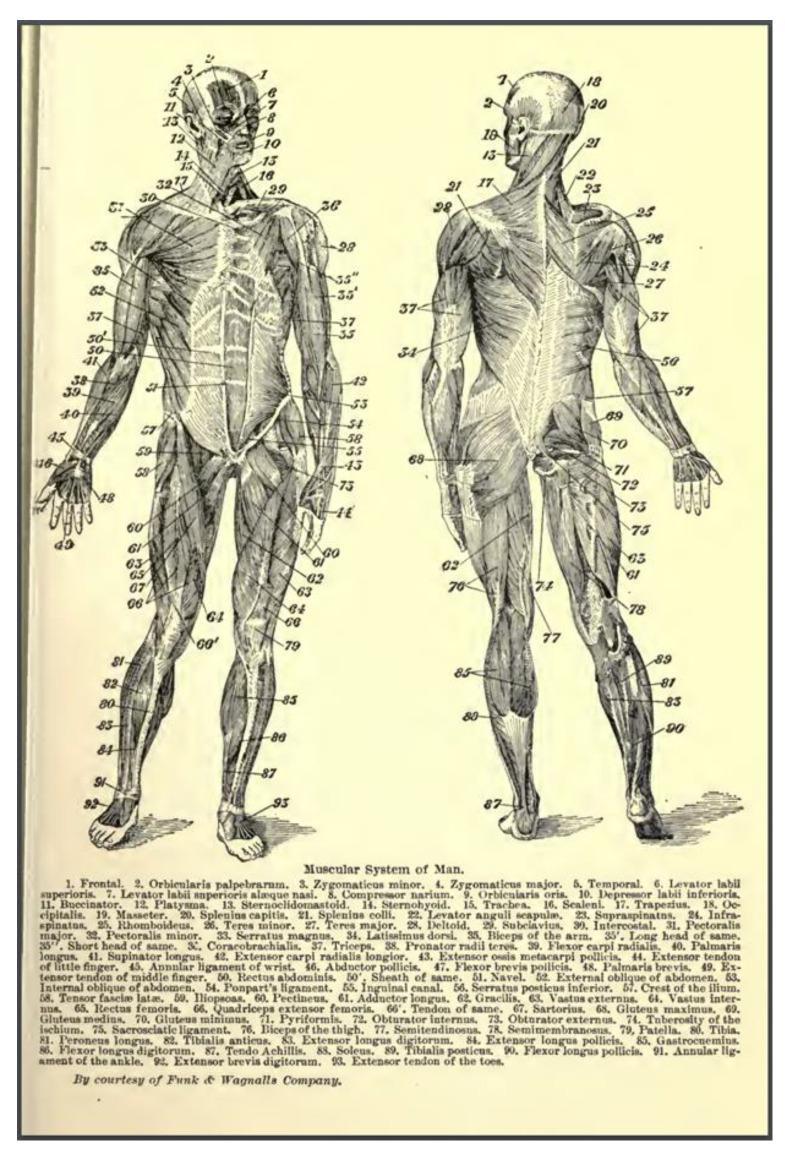
This is a detailed anatomical diagram titled 'Muscular System of Man,' presenting two full-body views of the human musculature: an anterior (front) view on the left and a posterior (back) view on the right. The diagram features numerical labeling (1-93) corresponding to a comprehensive legend at the bottom. The anterior view highlights major muscle groups including the muscles of facial expression, the sternocleidomastoid (13), pectoralis major (31), biceps brachii (35), rectus abdominis (50), and sartorius (67). The posterior view emphasizes the trapezius (17), deltoid (28), latissimus dorsi (34), gluteus maximus (68), and the hamstrings and gastrocnemius (85) of the lower limb. The illustration demonstrates the origin, insertion points, and superficial layering of the human skeletal muscle system. This resource is designed for medical education and provides a systematic overview of musculoskeletal anatomy, useful for identifying specific muscle names and their relative locations within the torso, limbs, and head.
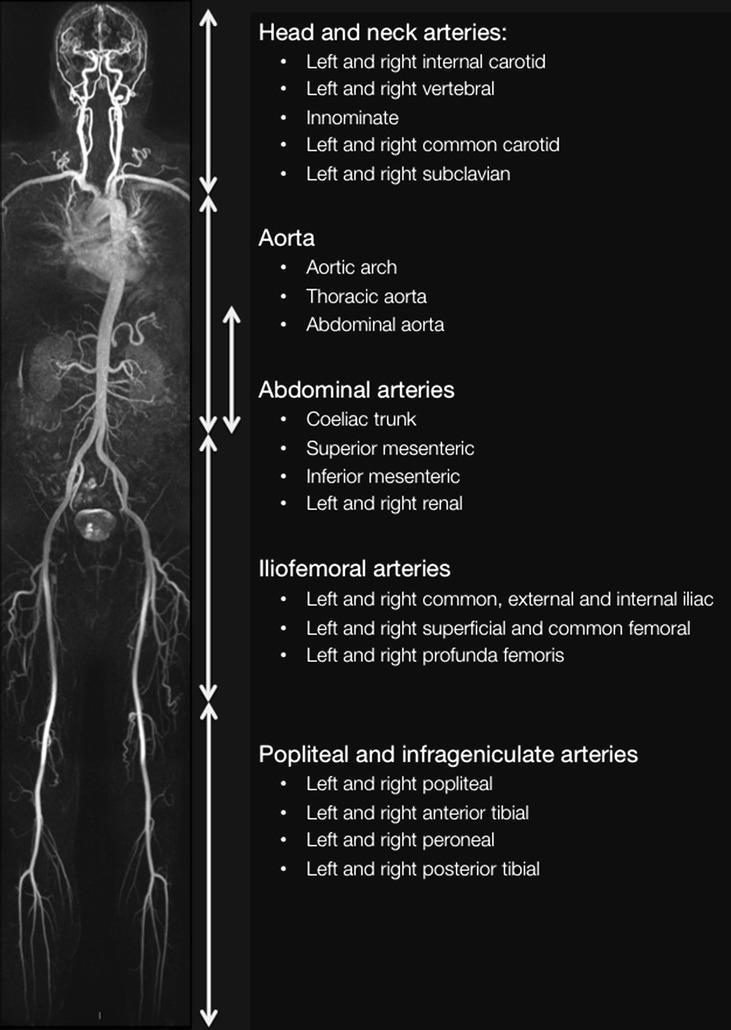
A whole-body diagnostic image presented as a Maximum Intensity Projection (MIP) of a Magnetic Resonance Angiogram (MRA). The visual provides a comprehensive coronal overview of the human arterial system from the cranium to the lower extremities, accompanied by descriptive labels of vascular territories. The content is divided into five anatomical stations: (1) Head and neck arteries, including carotids, vertebrals, and subclavians; (2) Aorta, encompassing the arch, thoracic, and abdominal segments; (3) Abdominal arteries, detailing the celiac trunk, superior/inferior mesenteric, and renal arteries; (4) Iliofemoral arteries, showing the common/external/internal iliac and femoral systems; and (5) Popliteal and infrageniculate arteries, highlighting the trifurcation into anterior/posterior tibial and peroneal vessels. The image serves as an educational reference for whole-body vascular anatomy and systematic assessment of arterial patency, atherosclerosis, or stenotic lesions. The visualization highlights the continuous, tapering morphology of the arterial tree and its major branch points, essential for radiology trainees and vascular specialists.
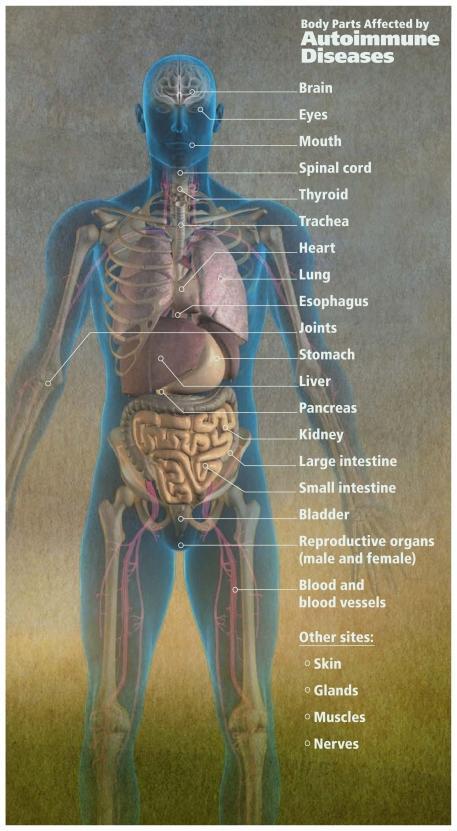
This medical infographic features a full-body anatomical diagram of a human figure titled Body Parts Affected by Autoimmune Diseases. The figure is rendered in a semi-transparent blue-toned style, revealing internal structures including the skeletal system, major organs, and a pink-colored vascular network. Labeled structures span the entire body, including the brain, eyes, mouth, spinal cord, thyroid, trachea, heart, lung, esophagus, stomach, liver, pancreas, kidney, large and small intestines, bladder, reproductive organs, and joints. A list of additional affected sites such as skin, glands, muscles, and nerves is also provided. The educational focus of the diagram is to illustrate the systemic nature of autoimmune conditions, highlighting how various organs and tissue types are susceptible to immune-mediated damage. This visual serves as a comprehensive overview for medical students or clinicians to understand the broad clinical manifestations of autoimmune pathology across multiple body systems.
cardiovascular heart anatomy diagram EMS
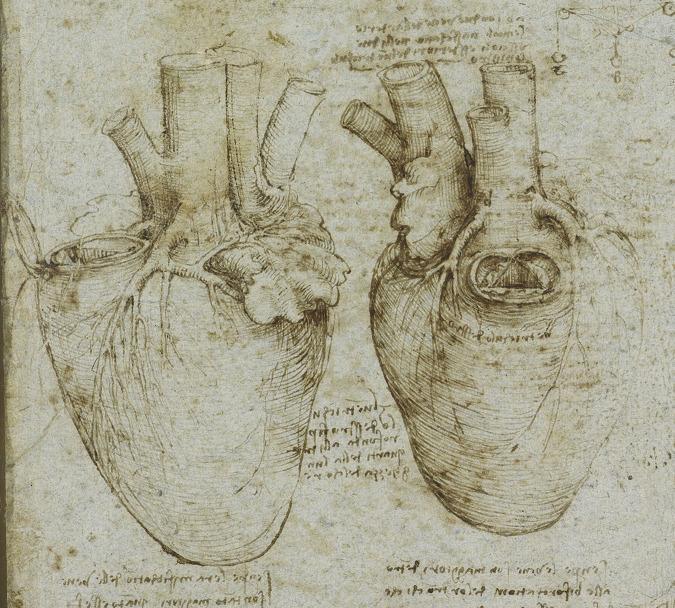
This historical anatomical diagram consists of two detailed sepia-toned ink sketches of the human heart, attributed to Leonardo da Vinci. The illustration serves as a foundational study in cardiac anatomy and pathophysiology. The heart on the left depicts the external morphology, including the ventricular surface and the branching of the coronary arteries. The heart on the right features a windowed dissection revealing an internal view of a cardiac chamber and valve-like structures. Both sketches prominently display the great vessels—specifically the ascending aorta and pulmonary trunk—arising from the superior aspect of the heart. The artist uses masterfully executed hatching and cross-hatching to represent the three-dimensional volume and muscular texture of the myocardium. The drawings are accompanied by mirror-written annotations in Italian, reflecting early scientific inquiry into cardiovascular function and the first accurate representations of cardiac valves and vessels in medical history. This visual is highly relevant for the history of medicine and understanding the evolution of anatomical illustration.
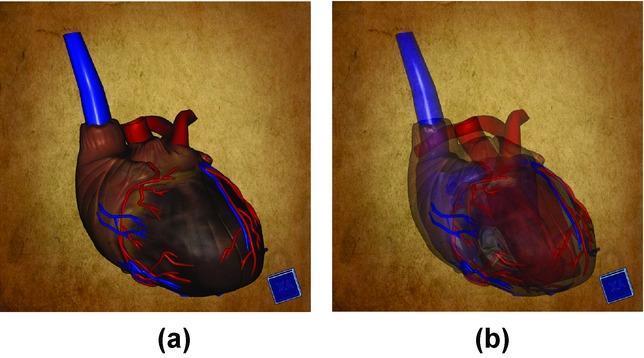
Anatomical Diagram: This image displays a side-by-side comparison of a 3D digital model of a human heart, emphasizing cardiovascular anatomy and medical visualization techniques. Figure (a) illustrates the external morphology of the heart with high opacity. It shows the muscular surface in a dark reddish-brown hue, featuring visible coronary arteries in red and cardiac veins in blue. A prominent blue cylindrical structure representing the superior vena cava or ascending aorta is visible at the base. Figure (b) demonstrates the same model with reduced opacity (semi-transparency), a technique used in diagnostic imaging and education to reveal internal cardiac structures. This view highlights the spatial relationships between internal chambers (atria and ventricles), heart valves, and the intra-cardiac pathways of major vessels. The comparison serves as an educational tool for medical students to understand the transition from external cardiac topography to internal anatomy using advanced volumetric rendering software.
respiratory system lungs anatomy diagram
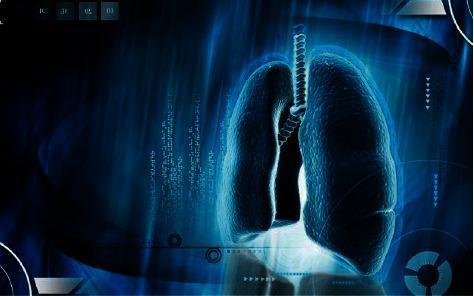
This medical illustration is a stylized 3D anatomical diagram of the human respiratory system, focusing on the lungs and trachea. The central feature is a pair of symmetrically positioned lungs with a granulated, textured surface that evokes the presence of pulmonary parenchyma and alveoli. Connecting them at the superior midline is the trachea, depicted with visible horizontal ridges representing cartilaginous rings. The image utilizes a cool, high-contrast blue color palette with digital overlays—including binary code patterns and circular UI elements—to establish a clinical and technological aesthetic. This infographic-style visual represents the intersection of pulmonology and advanced diagnostic technology, specifically the application of deep learning algorithms and artificial intelligence in lung cancer imaging and nodule detection. The educational focus is on visualizing thoracic anatomy within the context of computer-aided diagnosis (CAD) and medical informatics.
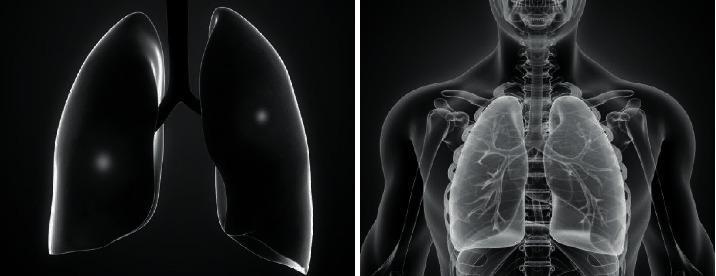
A dual-panel medical illustration titled 'Pathological diagram of severe pneumonia' providing a comparative anatomical view of the human respiratory system. The left panel shows an isolated 3D anatomical model of the lungs and trachea against a black background. The lung surfaces appear smooth and dark, with subtle highlights suggesting three-dimensional volume and lobar structure. The right panel displays the lungs integrated into a full-body sagittal-view silhouette of a human torso. This panel reveals the internal architecture of the respiratory tree, including the branching patterns of the bronchi and bronchioles within the lung parenchyma. The skeletal framework, including the rib cage, clavicles, and vertebral column, is visible as a translucent overlay. This educational visual is designed to demonstrate the relationship between external lung morphology and internal airway distribution, specifically contextualizing the sites of parenchymal inflammation and consolidation typical in severe pneumonia cases for medical students and clinical trainees.
nervous system brain spinal cord anatomy
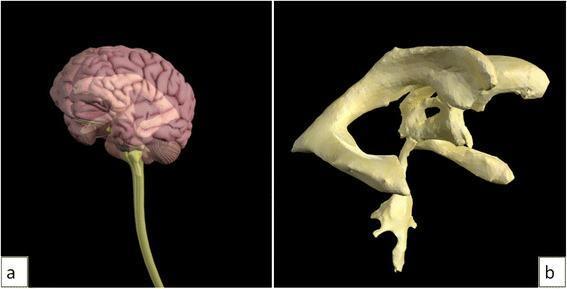
This dual-panel image features 3D anatomical models of the central nervous system and ventricular system, used for neuroanatomical education. Image (a) depicts a lateral view of the human brain and spinal cord. The cerebral cortex shows distinct gyri and sulci, with the cerebellum positioned posteriorly and the brainstem tapering into a long, cylindrical spinal cord. The model utilizes varying opacities to suggest internal depth. Image (b) provides a detailed, isolated 3D reconstruction of the cerebral ventricular system. Visible structures include the bilateral lateral ventricles with their characteristic C-shape (comprising the anterior, posterior, and inferior horns), the midline third ventricle, the narrow cerebral aqueduct of Sylvius, and the fourth ventricle located inferiorly. The model demonstrates the spatial relationships and interconnected pathways essential for understanding cerebrospinal fluid (CSF) flow. This visual material is designed for medical students and clinicians to study intracranial anatomy and the pathophysiology of conditions like hydrocephalus.
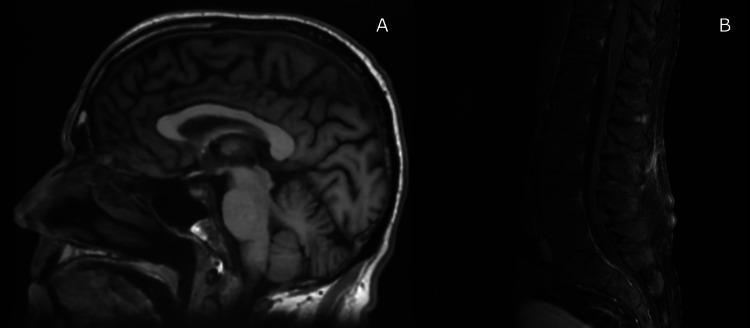
Diagnostic Imaging: This composite clinical image displays T1-weighted Magnetic Resonance Imaging (MRI) sequences of the central nervous system. Panel A features a sagittal view of the brain, demonstrating normal intracranial anatomy. Key visible structures include the cerebral cortex with preserved sulcation and gyration, the corpus callosum, the brainstem (pons and medulla), and the cerebellum. The brain parenchyma shows no evidence of masses, midline shift, or signal abnormalities. Panel B presents a sagittal MRI of the spinal column. The alignment of the vertebral bodies is preserved, and the intervertebral disc spaces appear intact. The spinal cord is clearly visualized within the spinal canal, showing no signs of extrinsic compression or significant nerve root thickening. While the clinical context mentions possible mild pial enhancement, the primary educational value of this image set lies in demonstrating baseline normal neurological imaging in a patient undergoing workup for demyelinating polyneuropathy (CIDP). These images serve as a reference for negative diagnostic findings in cases of progressive sensory-motor neuropathy.
cardiac conduction system ECG PQRST wave
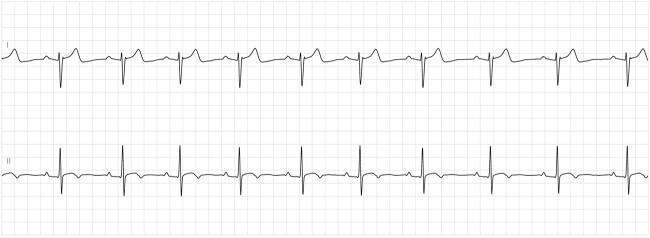
This diagnostic image displays a two-lead electrocardiogram (ECG) rhythm strip, likely from a Holter monitor, showing a regular sinus rhythm. The top tracing (Lead I) and bottom tracing (Lead II) demonstrate consistent PQRST morphology across a standard grid background. Each cardiac cycle consists of a visible P wave preceding a narrow QRS complex, followed by a symmetric T wave. The R-R intervals are regular, indicating a stable heart rate and rhythm. Clinically, this image serves as an educational example of normalized electrical conduction after recovery from high-grade atrioventricular block, specifically in the context of Lyme carditis treatment. The lack of PR prolongation or dropped beats highlights the resolution of the conduction delay. Key educational features include the 1:1 atrioventricular relationship and the absence of morphological abnormalities in the repolarization phase (T waves), confirming clinical stability upon discharge.
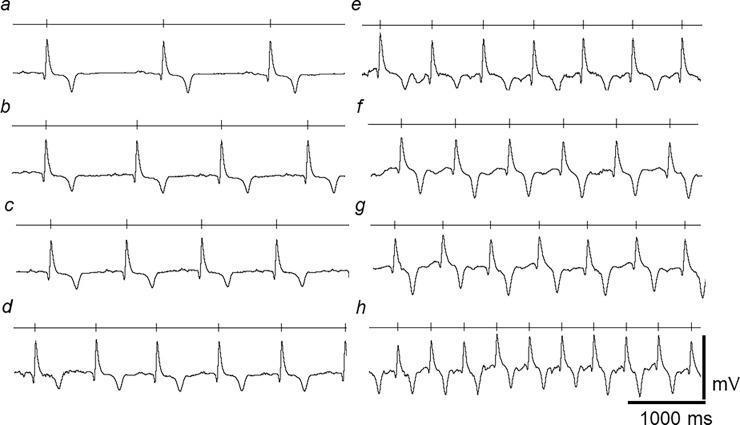
This diagnostic image displays eight comparative electrocardiogram (ECG) rhythm strips, labeled (a) through (h), demonstrating the physiological accommodation of the ECG waveform to an increasing heart rate. The sequences transition from a low heart rate in trace (a) (40–45 bpm) to a high heart rate in trace (h) (140–145 bpm). Each rhythm strip includes a horizontal timing line with vertical markers above the trace that denote successive R-wave occurrences, visually representing the shortening of the R-R interval and basic cycle length (BCL). Key educational features shown include the consistent morphology and amplitude of the PQRST complexes despite the rate increase, and the progressive compaction of the T-Q (diastolic) interval. The traces illustrate the equine cardiac conduction system's ability to maintain stable ventricular depolarization (QRS) and recovery (QT) properties across a broad physiological range. Scale markers at the bottom right indicate voltage in millivolts (mV) and time in milliseconds (1000 ms).
cell membrane homeostasis pathophysiology
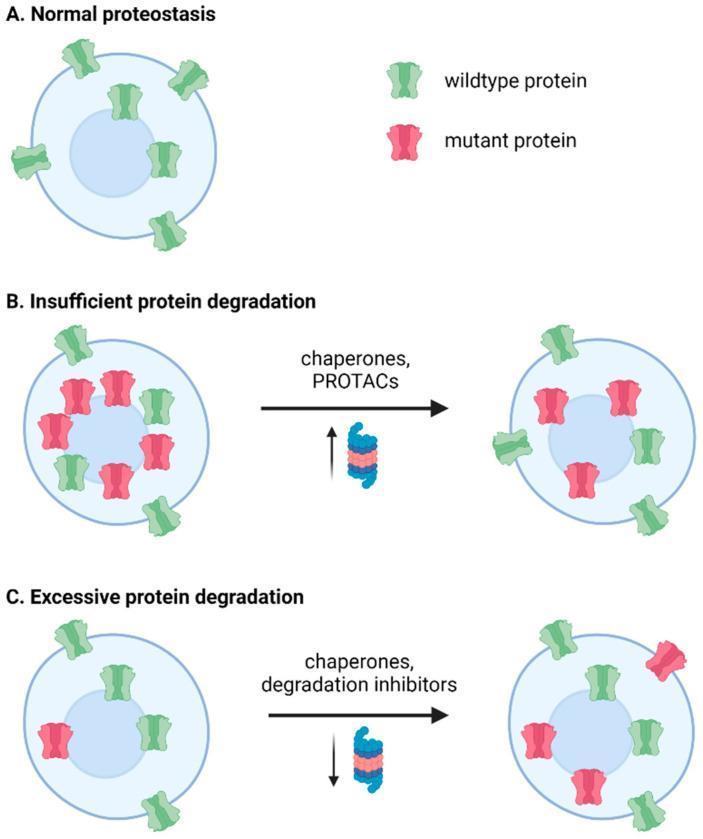
A pathophysiology diagram illustrating three cellular states of proteostasis (protein homeostasis) in the context of epilepsy and potential therapeutic interventions. (A) Normal proteostasis: Shows a healthy cell with green wildtype proteins properly trafficking to and localized on the plasma membrane. (B) Insufficient protein degradation: Depicts an accumulation of red mutant proteins within the cytoplasm, representing protein aggregation or failure of the ubiquitin-proteasome system (UPS). An arrow indicates that the addition of 'chaperones and PROTACs' (proteolysis-targeting chimeras) successfully reduces mutant protein burden and restores membrane trafficking of wildtype proteins. (C) Excessive protein degradation: Illustrates a scenario where partially functional mutant proteins are degraded too rapidly, leading to low protein density. The diagram shows that adding 'chaperones and degradation inhibitors' helps stabilize these proteins, facilitating their proper folding and trafficking to the cell surface. The illustration uses green icons for wildtype proteins and red icons for mutant proteins to demonstrate how pharmacological rescue strategies can rebalance protein expression and localization in genetic seizure disorders.
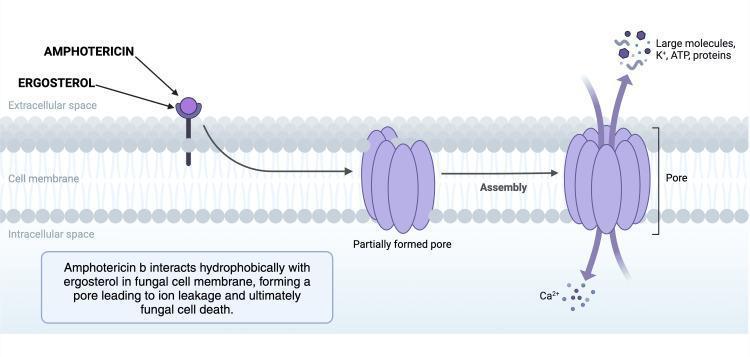
This pathophysiology diagram illustrates the mechanism of action of Amphotericin B, a polyene antifungal agent, on a fungal cell membrane. The diagram depicts the cell membrane as a phospholipid bilayer separating the extracellular space from the intracellular space. The process is shown in a three-step progression from left to right: (1) Initial interaction where Amphotericin B molecules bind hydrophobically to ergosterol, a primary sterol in the fungal membrane; (2) An intermediate state showing a 'partially formed pore' resulting from this interaction; and (3) The final 'Assembly' stage where a complete transmembrane pore is established. The diagram highlights the clinical consequence of pore formation: altered membrane permeability leading to the efflux of large molecules, potassium ions (K+), ATP, and proteins, and the influx of calcium ions (Ca2+). This disruption of cellular homeostasis results in fungal cell death. The visual is intended for medical education regarding antifungal pharmacology and is relevant to the treatment of invasive fungal infections like Cryptococcosis or Candidiasis.
📚 MODULE 2 - Anatomy & Physiology for EMS Paramedics
Why this matters in the field: You cannot treat what you don't understand. Every intervention you perform - from intubation to defibrillation - is based on A&P.
2.1 - Organization of the Human Body
| Level | Example |
|---|---|
| Chemical | Atoms, molecules (O₂, H₂O) |
| Cell | Smallest living unit (neuron, RBC) |
| Tissue | Muscle tissue, nervous tissue |
| Organ | Heart, lung, brain |
| Organ System | Cardiovascular system |
| Organism | The whole human body |
Body Positions & Planes
| Term | Meaning | EMS Use |
|---|---|---|
| Anatomical position | Standing, palms forward | Reference for all terms |
| Supine | Lying face up | Cardiac arrest position |
| Prone | Lying face down | Avoid in airway compromise |
| Lateral recumbent | On the side | Recovery position, OB patients |
| Fowler's | Seated upright | CHF, respiratory distress |
| Trendelenburg | Head down | Shock (controversial in EMS) |
| Sagittal plane | Divides left/right | - |
| Coronal plane | Divides front/back | - |
| Transverse plane | Divides top/bottom | - |
2.2 - The Musculoskeletal System
Skeleton (206 bones in adults)
- Axial skeleton - Skull, spine (33 vertebrae), sternum, ribs (protects vital organs)
- Appendicular skeleton - Arms, legs, pelvis, shoulder girdle (movement)
Spine (EMS critical knowledge!)
| Region | Vertebrae | Key Point |
|---|---|---|
| Cervical (C) | C1-C7 | C3-C5 - "stay alive" (diaphragm innervation) |
| Thoracic (T) | T1-T12 | Attached to ribs |
| Lumbar (L) | L1-L5 | Largest, most weight-bearing |
| Sacral (S) | S1-S5 (fused) | Pelvis |
| Coccyx | 4 fused | Tailbone |
⚠️ Field Pearl: C3, C4, C5 keep the diaphragm alive! A high cervical injury (C1-C2) = apnea = immediate assisted ventilation needed.
3 Types of Muscle
| Type | Location | Control | Example |
|---|---|---|---|
| Skeletal | Attached to bones | Voluntary | Biceps, quads |
| Smooth | Organs, vessels | Involuntary | GI tract, blood vessels |
| Cardiac | Heart only | Involuntary (automatic) | Myocardium |
2.3 - The Cardiovascular System
Heart Anatomy
- Right Atrium (RA) - receives deoxygenated blood from body (via SVC/IVC)
- Right Ventricle (RV) - pumps to lungs (low pressure)
- Left Atrium (LA) - receives oxygenated blood from lungs
- Left Ventricle (LV) - pumps to entire body (HIGH pressure - thickest wall)
| Valve | Location | Opens When |
|---|---|---|
| Tricuspid | RA → RV | RV filling |
| Pulmonic | RV → Pulmonary artery | RV pumping |
| Mitral (Bicuspid) | LA → LV | LV filling |
| Aortic | LV → Aorta | LV pumping |
Memory trick: Try Pulling My Aorta = Tricuspid, Pulmonic, Mitral, Aortic (right to left)
Blood Flow Through the Heart
Body → SVC/IVC → Right Atrium → Tricuspid valve → Right Ventricle
→ Pulmonic valve → Pulmonary arteries → LUNGS (oxygenation)
→ Pulmonary veins → Left Atrium → Mitral valve → Left Ventricle
→ Aortic valve → Aorta → BODY
Cardiac Conduction System
| Structure | Location | Normal Rate | Function |
|---|---|---|---|
| SA Node | Right atrium | 60-100 bpm | Primary pacemaker ("master switch") |
| AV Node | Junction of atria/ventricles | 40-60 bpm | Delays signal (allows atria to empty) |
| Bundle of His | Interventricular septum | - | Passes signal to ventricles |
| Bundle Branches | L and R ventricles | - | Distribute signal |
| Purkinje Fibers | Ventricular walls | 20-40 bpm | Final conduction to myocardium |
- P wave = Atrial depolarization (atria contracting)
- PR interval = AV node delay (normal: 0.12-0.20 sec)
- QRS complex = Ventricular depolarization (ventricles contracting) - normal < 0.12 sec
- T wave = Ventricular repolarization (heart "resetting")
Key Cardiovascular Formulas
| Formula | Meaning |
|---|---|
| CO = HR x SV | Cardiac Output = Heart Rate x Stroke Volume |
| BP = CO x SVR | Blood Pressure = Cardiac Output x Systemic Vascular Resistance |
| Normal CO | 4-8 L/min |
| Normal SV | 60-100 mL/beat |
⚠️ Field Pearl: If HR goes up but SV drops (e.g., shock), CO may stay same or decrease. This is why tachycardia in trauma is a RED FLAG.
2.4 - The Respiratory System
Upper Airway
- Nose/Mouth - air entry, filtration, warming
- Pharynx - throat (naso, oro, laryngopharynx)
- Epiglottis - flap that covers trachea during swallowing (critical for intubation)
- Larynx - voice box, contains vocal cords
Lower Airway
- Trachea - 10-12 cm long, 16-20 cartilage rings
- Carina - where trachea splits (right mainstem goes more straight - most common intubation error)
- Bronchi → Bronchioles → Alveoli
- Alveoli - gas exchange site (300 million alveoli = tennis court surface area!)
Gas Exchange (Critical!)
| Location | Process | Direction |
|---|---|---|
| Alveoli → Blood | External respiration | O₂ in, CO₂ out |
| Blood → Cells | Internal respiration | O₂ in, CO₂ out of cells |
Pressure ↑ = Volume ↓ (and vice versa)
- Inhale: Diaphragm contracts → chest expands → pressure drops → air rushes IN
- Exhale: Diaphragm relaxes → chest recoils → pressure rises → air rushes OUT
Normal Respiratory Values
| Parameter | Normal Adult Value |
|---|---|
| Respiratory Rate | 12-20 breaths/min |
| Tidal Volume | ~500 mL |
| Minute Volume | RR x TV = ~6-8 L/min |
| SpO₂ | 94-100% |
| EtCO₂ | 35-45 mmHg |
| PaO₂ | 80-100 mmHg |
| PaCO₂ | 35-45 mmHg |
| pH | 7.35-7.45 |
⚠️ Field Pearl: EtCO₂ is your best tool to confirm tube placement AND monitor perfusion. If EtCO₂ drops suddenly during cardiac arrest = check for pulse/ROSC!
2.5 - The Nervous System
Two Major Divisions
Nervous System
├── Central Nervous System (CNS)
│   ├── Brain
│   └── Spinal Cord
└── Peripheral Nervous System (PNS)
    ├── Somatic (voluntary - you control it)
    └── Autonomic (involuntary)
        ├── Sympathetic ("Fight or Flight")
        └── Parasympathetic ("Rest and Digest")
The Brain - 4 Major Regions
| Region | Location | Controls |
|---|---|---|
| Cerebrum | Top, largest | Thought, movement, sensation, speech |
| Cerebellum | Back/bottom | Balance, coordination |
| Brainstem | Base (midbrain, pons, medulla) | Breathing, HR, BP - VITAL FUNCTIONS |
| Hypothalamus | Deep center | Temperature, hunger, thirst, hormone control |
⚠️ Field Pearl: Brainstem herniation (from brain bleed/severe TBI) = CUSHING'S TRIAD:
- Hypertension (widened pulse pressure)
- Bradycardia
- Irregular respirations This is a pre-death sign. Hyperventilate slightly (20 breaths/min) and get to trauma center FAST.
Autonomic Nervous System (ANS) - EMS Gold
| Feature | Sympathetic | Parasympathetic |
|---|---|---|
| Nickname | "Fight or Flight" | "Rest and Digest" |
| Neurotransmitter | Epinephrine, Norepinephrine | Acetylcholine |
| Heart Rate | ↑ Increases | ↓ Decreases |
| Blood Pressure | ↑ Increases | ↓ Decreases |
| Pupils | Dilate (Mydriasis) | Constrict (Miosis) |
| Bronchioles | Dilate | Constrict |
| GI Activity | ↓ Decreases | ↑ Increases |
| Skin | Pale, sweaty | Warm, dry |
Field Application: A patient in shock (trauma, sepsis) activates sympathetic response → tachycardia, pale/diaphoretic skin, dilated pupils. These are your early shock signs!
2.6 - The Vascular System
Blood Vessel Types
| Vessel | Direction | Wall | Pressure |
|---|---|---|---|
| Arteries | Away from heart | Thick, muscular | High |
| Arterioles | Control blood flow to organs | Muscular | Medium |
| Capillaries | Gas/nutrient exchange | One cell thick | Low |
| Venules | Drain capillaries | Thin | Low |
| Veins | Toward heart | Thin, valves | Very low |
Major Arteries (EMS Must-Know)
| Artery | Location | EMS Use |
|---|---|---|
| Carotid | Neck | Pulse check, stroke assessment |
| Brachial | Upper arm | BP measurement, IV site |
| Radial | Wrist | Pulse check |
| Femoral | Groin | Major hemorrhage, IO site |
| Popliteal | Behind knee | Pulse check for leg injuries |
| Dorsalis Pedis | Top of foot | Distal pulse check |
| Aorta | Chest/abdomen | Largest artery - aortic dissection |
Blood Components
| Component | Function | EMS Relevance |
|---|---|---|
| RBCs (Erythrocytes) | Carry O₂ via hemoglobin | Anemia, blood loss assessment |
| WBCs (Leukocytes) | Fight infection | Sepsis, immune response |
| Platelets (Thrombocytes) | Clotting | Hemorrhage control |
| Plasma | Liquid carrier | Fluid replacement rationale |
A Class III hemorrhage = 30-40% blood loss = 1,500-2,000 mL = hemorrhagic shock!
2.7 - The Integumentary System (Skin)
Skin Assessment = Perfusion Assessment
| Finding | What it tells you |
|---|---|
| Pale | Vasoconstriction, shock, anemia |
| Red (Flushed) | Heat emergency, fever, anaphylaxis, hypertension |
| Cyanotic (Blue) | Hypoxia - get oxygen NOW |
| Jaundice (Yellow) | Liver disease |
| Mottled | Severe shock - very late sign |
| Diaphoretic (Sweaty) | Sympathetic activation = shock, MI, hypoglycemia |
| Cool & Clammy | Shock |
| Warm & Dry | Normal or heat emergency |
| Tenting | Dehydration |
⚠️ Field Pearl: Skin color + temperature + moisture = instant "mini-assessment" of perfusion. Do this every time you touch a patient.
2.8 - Pathophysiology Basics (How Disease Happens)
Cellular Injury & Death
- Hypoxia - most common (no O₂ → cells die)
- Ischemia - no blood flow (e.g., MI, stroke)
- Chemical injury - toxins, drugs
- Infectious - bacteria, viruses
- Trauma - direct cell destruction
Homeostasis - The Body's Balance
- pH: 7.35-7.45
- Temperature: 98.6°F / 37°C
- Blood glucose: 70-110 mg/dL
- Blood pressure: ~120/80 mmHg
Acid-Base Balance (EMS Critical!)
| State | pH | CO₂ | HCO₃ | Cause | EMS Example |
|---|---|---|---|---|---|
| Respiratory Acidosis | ↓ | ↑ | Normal | Hypoventilation | COPD, OD, resp failure |
| Respiratory Alkalosis | ↑ | ↓ | Normal | Hyperventilation | Anxiety, head injury |
| Metabolic Acidosis | ↓ | Normal | ↓ | Lactic acid, DKA | Shock, diabetic coma |
| Metabolic Alkalosis | ↑ | Normal | ↑ | Vomiting, diuretics | Rare in field |
Field Pearl: A patient with Kussmaul breathing (deep, rapid, labored) is compensating for metabolic acidosis (e.g., DKA or late shock). Their body is blowing off CO₂ to raise pH.
🧠 Module 2 - Practice Questions
A: C3, C4, C5 - "C3, 4, 5 keeps the diaphragm alive"
A: Sympathetic nervous system - this is a classic shock presentation
A: Superior/Inferior Vena Cava (SVC/IVC) → Right Atrium
A: Poor perfusion/low cardiac output. EtCO₂ < 10 = very poor prognosis. Rise to >40 = ROSC!
A: Respiratory Alkalosis (blowing off CO₂, pH rises)
A: CO = HR x SV (Heart Rate x Stroke Volume)
✅ Module 2 Summary - High-Yield Points
| System | #1 EMS Takeaway |
|---|---|
| Musculoskeletal | C3-C5 = diaphragm; right mainstem most common intubation error |
| Cardiovascular | CO = HR x SV; Tachycardia in trauma = RED FLAG |
| Respiratory | EtCO₂ 35-45 normal; Kussmaul = metabolic acidosis |
| Nervous | Cushing's Triad = brainstem herniation emergency |
| Vascular | 5L total blood volume; Class III = shock |
| Skin | Pale/cool/diaphoretic = shock until proven otherwise |