

ecg.jpg
Could read this ecg
Loading Image
Here is my systematic read of this 12-lead ECG:
ECG Interpretation
Rate & Rhythm
- Rate: Approximately 75-85 bpm (estimated from R-R intervals)
- Rhythm: Sinus rhythm - P waves are present and appear to precede every QRS complex
- P wave axis: Upright in I and II - confirms normal sinus origin
Intervals
- PR interval: Appears within normal limits (~160-180 ms) - no overt first-degree block, though borderline prolongation possible
- QRS duration: Narrow (<120 ms) - no bundle branch block
- QTc: Difficult to measure precisely from image, but appears within normal range
Axis
- QRS appears predominantly positive in I and aVF - normal axis (roughly 0° to +90°)
P Waves
- Morphology appears normal; no obvious bifid or peaked P waves to suggest atrial enlargement
QRS Complexes
- Septal Q waves present in lateral leads (I, aVL, V5-V6) - normal finding
- R wave progression: R wave appears to increase from V1 to V4/V5 - normal precordial progression
- No pathological Q waves identified (no wide/deep Q in inferior or anterior leads suggesting prior infarction)
ST Segments & T Waves
- ST segment: Appears isoelectric across the precordium and limb leads - no obvious ST elevation or depression
- T waves: Upright in I, II, and precordial leads V3-V6; inverted in aVR (normal); T wave morphology in V1-V2 appears flat/biphasic - this can be normal but warrants clinical correlation
Voltage
- No obvious criteria for left ventricular hypertrophy (LVH), though image resolution limits precise measurement
Summary
Normal sinus rhythm with no acute ST-T changes detected. The tracing shows:
- Normal rate, axis, and intervals
- No pathological Q waves
- No ST elevation or depression
- No bundle branch block
The most notable observation is flat/biphasic T waves in V1-V2, which can be normal but could also represent early anterior repolarization changes or right ventricular strain - correlate clinically.
Important disclaimer: This is an educational ECG interpretation only and does not constitute medical advice or a clinical diagnosis. All ECGs must be interpreted in the context of the patient's clinical presentation by a qualified clinician.
Search for ECG interpretation guidelines and criteria
Reading File
Searching sources...
Finding Sources
Searching PubMed
"electrocardiogram" AND "interpretation" AND "guidelines"
Searching the Web
ECG interpretation guidelines criteria 2024 AHA ACC standardized
Now let me pull the relevant textbook content on ECG interpretation criteria:
Reading File
Finding Sources
Reading File
Finding Sources
Reading File
Finding Sources
Reading File
Reading File
Finding Sources
Finding Sources
Reading File
Reading File
Reading File
Here is a comprehensive, evidence-based guide to ECG interpretation guidelines and criteria, drawn from Goldman-Cecil Medicine, Harrison's Principles of Internal Medicine, and Tintinalli's Emergency Medicine:
ECG Interpretation: Guidelines & Criteria
The Systematic 14-Step Approach
(Harrison's Principles of Internal Medicine, 22nd Ed.)
Every ECG should be analyzed in this order to avoid errors of omission:
- Standardization and calibration (paper speed, gain, lead placement, artifacts)
- Rhythm
- Heart rate
- PR interval / AV conduction
- QRS interval
- QT/QTc interval
- Mean QRS electrical axis
- P waves
- QRS voltages
- Precordial R-wave progression
- Abnormal Q waves
- ST segments
- T waves
- U waves
Always compare with any prior ECG when available.
Normal ECG Intervals
(Goldman-Cecil Medicine, Table 42-1)
| Parameter | Normal Range |
|---|---|
| Heart rate | 50-100 bpm (physiologic normal may be 50-90) |
| P wave duration | < 120 ms (< 0.12 sec) |
| PR interval | 90-200 ms (0.09-0.20 sec) |
| QRS duration | 75-110 ms (0.075-0.11 sec) |
| QTc (males) | 390-450 ms |
| QTc (females) | 390-460 ms |
| QRS axis | -30° to +90° |
QTc Calculation (Bazett's formula):
QTc = QT / √RR (RR in seconds)
Note: Bazett's formula overcorrects at fast heart rates and undercorrects at slow rates. Fridericia's formula (QTc = QT / ∛RR) may be more accurate, particularly in atrial fibrillation.
P Wave Criteria
- Normal duration: < 120 ms
- Upright in leads I, II, and aVF; inverted in aVR
- Broad/bifid P wave ("P mitrale"): suggests left atrial enlargement
- Tall peaked P wave ("P pulmonale", >2.5 mm in II): suggests right atrial enlargement
PR Interval
- Normal: 90-200 ms
- > 200 ms = first-degree AV block (delayed AV conduction)
- Short PR = ventricular preexcitation (WPW), junctional rhythm, or enhanced AV nodal conduction
- Delay usually localized to the AV node, though other sites are possible
QRS Complex
- Normal width: 75-110 ms
- Capital letters (Q, R, S): amplitudes ≥ 5 mm (0.5 mV)
- Lowercase letters (q, r, s): amplitudes < 5 mm (0.5 mV)
- Q waves preceding an R wave are initial negative deflections; S waves follow positive deflections
- Wide QRS (≥ 120 ms) = intraventricular conduction delay / bundle branch block
Bundle Branch Block Criteria
(Goldman-Cecil Medicine, Table 42-3)
| Block | QRS Duration | Axis | Morphology |
|---|---|---|---|
| RBBB | ≥ 120 ms | Normal | rSR' or rsr' in V1-V2; wide S in I and V5-V6 |
| LBBB | ≥ 120 ms | Variable | QS or rS in V1; broad notched R in I, aVL, V5-V6; no septal q in lateral leads |
| LAFB | < 120 ms | -45° to -90° | qR in aVL; rS in II, III, aVF |
| LPFB | < 120 ms | +90° to +180° | rS in I, aVL; qR in III, aVF |
ST Segment - STEMI Criteria by Territory
(Tintinalli's Emergency Medicine, Table 49-4)
| Territory | ST Elevation Leads |
|---|---|
| Anteroseptal | V1, V2 (± V3) |
| Anterior | V1-V4 |
| Anterolateral | V1-V6, I, aVL |
| Lateral | I, aVL |
| Inferior | II, III, aVF |
| Inferolateral | II, III, aVF, V5, V6 |
| Posterior | Tall R in V1-V2 (R/S ≥ 1); ST elevation in right-sided leads |
| Right ventricular | II, III, aVF + ST depression lateral leads; ST elevation in V3R-V6R |
Key threshold (standard): ST elevation ≥ 1 mm in ≥ 2 contiguous limb leads, or ≥ 2 mm in ≥ 2 contiguous precordial leads (men); ≥ 1.5 mm in women in V2-V3.
- Reciprocal ST depression in leads away from the injury zone indicates larger infarct territory and increased mortality risk.
- New LBBB with chest pain was historically treated as STEMI-equivalent, but < 10% of new LBBB cases have AMI - the Sgarbossa criteria are used to identify MI in LBBB.
Chamber Hypertrophy Criteria
(Goldman-Cecil Medicine)
Left Ventricular Hypertrophy (LVH):
- Cornell criterion (preferred): SV3 + RaVL > 2.8 mV (men) or > 2.0 mV (women)
- Sokolow-Lyon criterion: SV1 + RV5 or V6 > 3.5 mV
- Sensitivity only 30-50%; specificity 85-95%
- "Strain pattern": ST depression + T-wave inversion in lateral leads (I, aVL, V5-V6)
Right Ventricular Hypertrophy (RVH):
- Sokolow-Lyon for RVH: RV1 + SV5 or V6 ≥ 1.05 mV
- Sensitivity very poor (10-20%); specificity similar to LVH criteria
- Supporting features: right axis deviation, dominant R in V1, P pulmonale
Low QRS Voltage
- Defined as: peak-to-peak amplitude < 5 mm in all limb leads, or < 10 mm in all precordial leads
- Common causes: pericardial effusion, myocardial infarction, cardiomyopathy, COPD/emphysema, obesity, hypothyroidism
Repolarization / ST-T Abnormalities
- T waves should be concordant with QRS direction
- Early repolarization: ST elevation with an "upward concave" morphology, often a normal variant - but associated with slightly increased risk of idiopathic ventricular fibrillation; absolute risk remains low
- Wellens' T-wave sign: deep symmetrical T-wave inversions in V1-V4 (± I, aVL) = high-grade LAD stenosis
- Posterior MI: prominent tall R waves in V1-V2 without anterior ST elevation
Conditions That Make ECG Interpretation Difficult
(Tintinalli's Emergency Medicine)
- LBBB (masks ischemia patterns)
- Ventricular pacing
- WPW pre-excitation
- LVH with strain
- Hyperkalemia
- Early repolarization pattern (can mimic STEMI)
Key References
- Goldman-Cecil Medicine International Edition, Ch. 42 (ECG Intervals, Hypertrophy, Bundle Branch Blocks)
- Harrison's Principles of Internal Medicine 22E (2025), Ch. 247 (Clinical Interpretation)
- Tintinalli's Emergency Medicine, Ch. 49 (Table 49-4, STEMI criteria)
- AHA/ACCF/HRS Scientific Statement: Recommendations for Standardization and Interpretation of the Electrocardiogram (Parts I-VI) - available via HRS
- Goldberger AL: Goldberger's Clinical Electrocardiography: A Simplified Approach, 10th ed. Elsevier, 2024
Disclaimer: ECG interpretation must always be correlated with the patient's clinical presentation, symptoms, and history by a qualified clinician. No automated or reference-based interpretation replaces bedside clinical judgment.
Explain how to identify acute ischemia vs chronic MI patterns
Reading File
Searching sources...
Finding Sources
Searching PubMed
"acute myocardial ischemia" AND "electrocardiogram" AND "chronic infarction"
Searching the Web
ECG acute ischemia vs chronic MI patterns differentiation hyperacute T waves Q waves 2024
Finding Sources
Finding Sources
Finding Sources
Reading File
Reading File
Reading File
Reading File
Finding Sources
Loading Image
Loading Image
Loading Image
Finding Sources
Here is a thorough, image-illustrated explanation sourced directly from Harrison's Principles of Internal Medicine (22E), Rosen's Emergency Medicine, and Tietz Textbook of Laboratory Medicine:
Acute Ischemia vs. Chronic MI: ECG Patterns
The Core Concept: Why the ECG Changes Over Time
Ischemia exerts time-dependent effects on myocardial cells. Severe acute ischemia lowers the resting membrane potential and shortens action potential duration, creating voltage gradients between normal and ischemic zones - these are reflected as "currents of injury" on the surface ECG. The pattern of ECG changes differs depending on whether ischemia is:
- Transmural (full-thickness, epicardial) - causes ST elevation
- Subendocardial (inner-layer only) - causes ST depression
- Chronic/healed (necrosis and fibrosis) - leaves permanent Q waves
The Sequential ECG Evolution of Acute MI
(Tietz Textbook of Laboratory Medicine, Figure 48.4 - serial tracing)
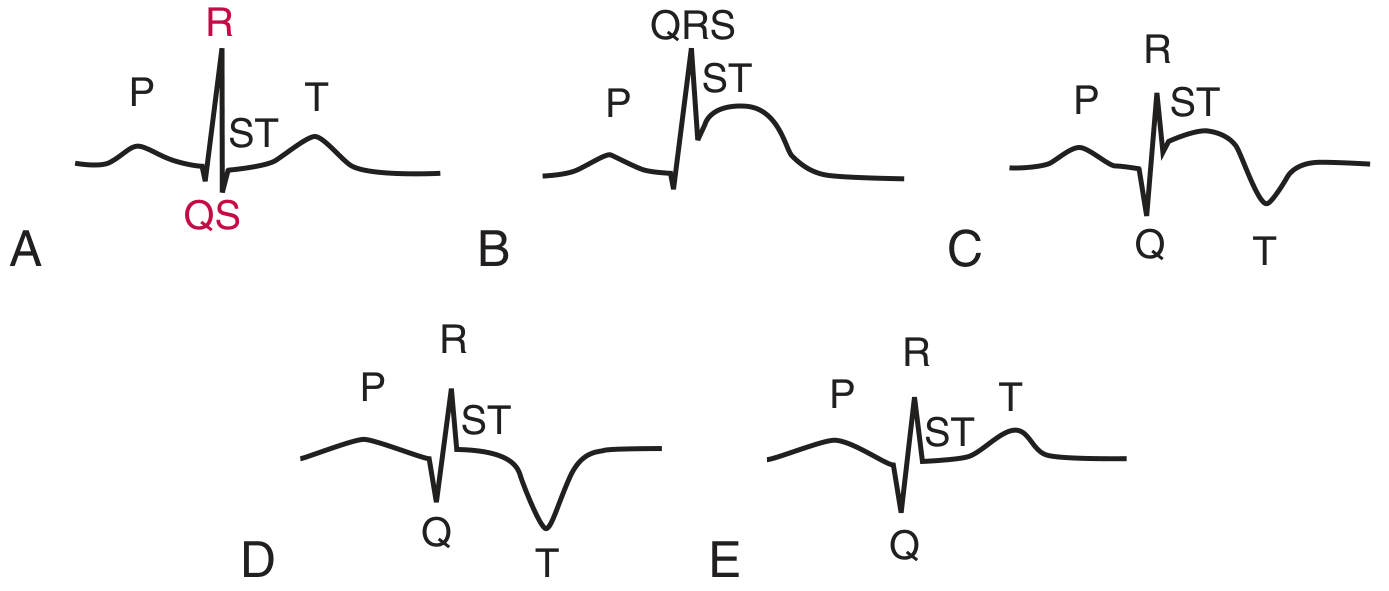
This diagram shows the 5 classic stages:
| Stage | Time | ECG Finding |
|---|---|---|
| A - Baseline | Before event | Normal ECG |
| B - Hyperacute | Minutes - hours | ST elevation (may have hyperacute T waves first) |
| C - Acute | Hours to days | T wave inversion + Q wave emerges |
| D - Subacute | Days to weeks | ST returns toward baseline; Q wave + T inversion persist |
| E - Chronic | Weeks to months | T wave becomes upright again; Q wave may remain permanently |
Stage 1 - Hyperacute Phase (Minutes to ~30 min)
The earliest ECG sign of acute coronary occlusion.
Hyperacute T waves:
- Appear within 5 minutes of coronary occlusion
- Large, broad-based, asymmetric (gradual upstroke, rapid descent)
- Disproportionately tall relative to the preceding QRS complex
- Often described as "bulky" - you could nearly "fit the QRS inside the T wave"
- Transient - typically evolve into overt ST elevation within 30 minutes
- Key distinction from hyperkalemia: hyperkalemic T waves are narrow-based, symmetrical, and sharply peaked; hyperacute T waves are wide-based and asymmetric
(Harrison's Principles of Internal Medicine 22E, p. 1916)
Stage 2 - Acute Phase: ST Elevation (Hours)
The current of injury mechanism:
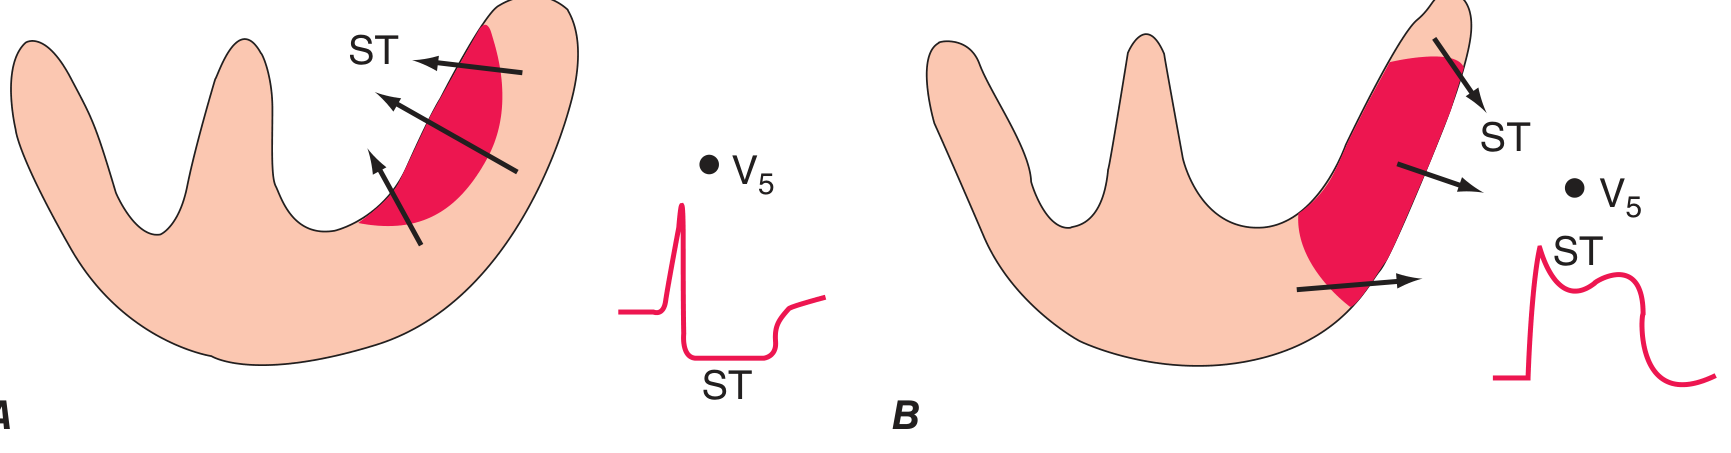
- Transmural ischemia (epicardial involvement): ST vector directed outward → ST elevation in overlying leads
- Subendocardial ischemia: ST vector directed inward toward ventricular cavity → ST depression in overlying leads (with ST elevation in aVR)
Acute STEMI pattern features:
- ST elevation in the territory of the affected artery (see regional criteria from previous session)
- Reciprocal ST depression in contralateral leads (larger infarct, worse prognosis)
- ST elevation is typically convex upward ("tombstone" shape) in fully developed STEMI
- The more ST segments elevated and the higher the elevation, the more extensive the injury
Stage 3 - Developing Q Waves + T Wave Inversion (Hours to Days)
(Harrison's 22E; Rosen's Emergency Medicine)
Pathological Q waves:
- Represent myocardial necrosis - loss of viable depolarizing tissue
- Criteria: duration ≥ 40 ms (≥ 0.04 sec) OR amplitude ≥ 25% of the R wave amplitude in the same lead
- Can appear within the first hour but most commonly develop at 8-12 hours
- Presence of Q waves with ST elevation does NOT preclude reperfusion - patient history of symptom onset is the key guide
T wave inversion:
- As ST elevation begins to resolve, the T wave typically inverts in the same leads
- Following successful reperfusion, T wave inversions may be deep and symmetrical - resembling Wellens' syndrome pattern (this is called "reperfusion T waves")
- Following failed reperfusion: T wave inversions tend to be shallower
Stage 4 - Subacute / Evolving Phase (Days to Weeks)
- ST segment returns toward isoelectric baseline
- Pathological Q waves persist (permanent marker of necrosis)
- T wave inversions persist but may begin to normalize
- R wave amplitude in the infarcted territory is typically reduced or lost ("poor R-wave progression")
Stage 5 - Chronic / Old MI Pattern (Weeks to Months - Permanent)
(Rosen's Emergency Medicine)
Classic chronic MI findings:
- Pathological Q waves - the most enduring marker of old infarction. May be permanent, or may partially resolve (especially with smaller infarcts or after successful reperfusion).
- T waves - may normalize (become upright again) over weeks to months
- Reduced R wave amplitude in the affected leads
- ST segment - usually returns fully to baseline. Persistent ST elevation >4-6 weeks after MI suggests ventricular aneurysm
The Wellens' Pattern - High-Grade LAD Stenosis
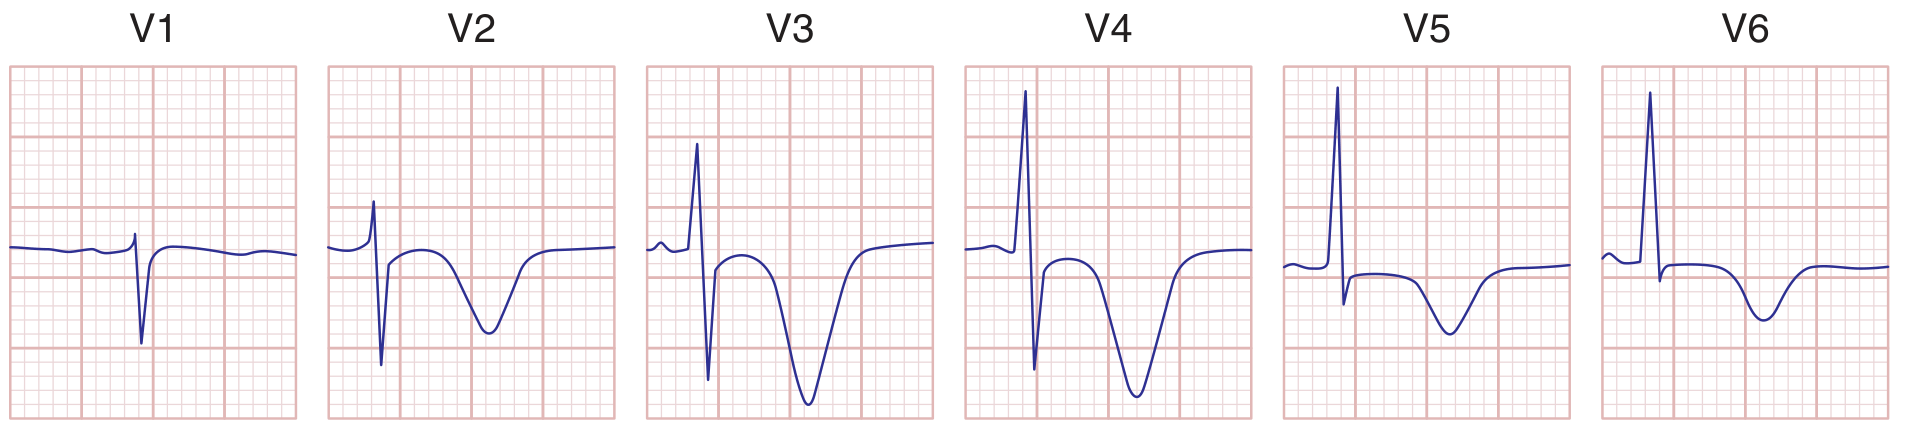
This is a pre-infarction warning pattern - the patient is typically pain-free when the ECG is recorded:
- Type A (25%): Biphasic T waves in V2-V3 (initial positive deflection, terminal negative)
- Type B (75%): Deeply and symmetrically inverted T waves in V2-V3 (± V1-V4, I, aVL)
- No significant Q waves; minimal or no ST elevation
- Represents critical stenosis (not yet complete occlusion) of the proximal LAD
- If misidentified as old ischemia and the patient undergoes stress testing, it can precipitate full anterior STEMI
(Harrison's 22E, Figure 247-12)
Key Differential: Acute vs. Chronic - Summary Table
| Feature | Acute Ischemia | Chronic (Old) MI |
|---|---|---|
| ST segment | Elevated (STEMI) or depressed (NSTEMI) | Isoelectric (return to baseline) |
| T waves | Hyperacute (early) or inverted (evolving) | Usually upright; may be chronically inverted |
| Q waves | Absent or just forming | Permanent pathological Q waves present |
| R waves | Normal or beginning to decrease | Reduced amplitude / poor progression |
| Dynamic change | Changes on serial ECGs (hours) | Stable, unchanged on serial ECGs |
| Symptoms | Active chest pain / ACS symptoms | Often asymptomatic; history of prior MI |
| ST elevation > 4-6 weeks | Abnormal - aneurysm until proved otherwise | Persistent elevation = suspect LV aneurysm |
STEMI Equivalents (Do Not Miss)
Patterns representing acute coronary occlusion that do not show classic ST elevation (per ACC pathway):
- Posterior MI - tall R in V1-V2, ST depression V1-V3 (reciprocal); confirm with posterior leads
- Hyperacute T waves - before ST elevation develops
- de Winter pattern - upsloping ST depression in V1-V6 + tall symmetric T waves; no ST elevation; represents proximal LAD occlusion
- LBBB with modified Sgarbossa criteria - ST elevation > 1 mm concordant with QRS; ST depression ≥ 1 mm in V1-V3; discordant ST elevation > 5 mm
- T wave pseudonormalization - a previously inverted T wave becomes "normal-looking" during an acute ischemic episode
Practical Pitfalls
- Serial ECGs are essential - a single normal or non-diagnostic ECG does not exclude acute MI; repeat at 15-30 min intervals in high-risk patients
- LBBB and paced rhythms mask ischemic changes - use Sgarbossa criteria
- Q waves can disappear over time, especially after successful reperfusion of small infarcts - their absence does not rule out prior MI
- Persistent ST elevation beyond 4-6 weeks after MI suggests left ventricular aneurysm, not ongoing acute ischemia
Sources:
- Harrison's Principles of Internal Medicine 22E (2025), Ch. 247 - Myocardial Ischemia and Infarction
- Rosen's Emergency Medicine, Ch. 64 - Q wave formation, T wave inversion, Wellens' pattern
- Tietz Textbook of Laboratory Medicine 7E, Figure 48.4 - Serial ECG evolution of AMI
- Turkish Journal of Emergency Medicine (2025) - High-risk ECG presentations in ACS beyond STEMI
Disclaimer: This is educational content only. ECG interpretation must always incorporate the full clinical context and be performed by a qualified clinician.
This is a shared conversation. Sign in to Orris to start your own chat.