
Five differences between Obstructive lung disorder and restrictive lung disorder
Obstructive lung disorders involve airflow limitation (narrowed/blocked airways), while restrictive disorders involve reduced lung volume (stiff or compressed lungs). The key distinction lies in which lung function parameters are affected - FEV1/FVC ratio drops in obstruction, while total lung capacity drops in restriction.
Searching sources...
Reading File
Finding Sources
Finding Sources
Reading File
Reading File
Reading File
Now I have excellent textbook content. Let me fetch the PFT comparison image from Ganong's for a visual aid.
Loading Image
Here is a complete, textbook-sourced comparison of obstructive vs. restrictive lung disorders across five key dimensions:
Obstructive vs. Restrictive Lung Disorders: 5 Key Differences
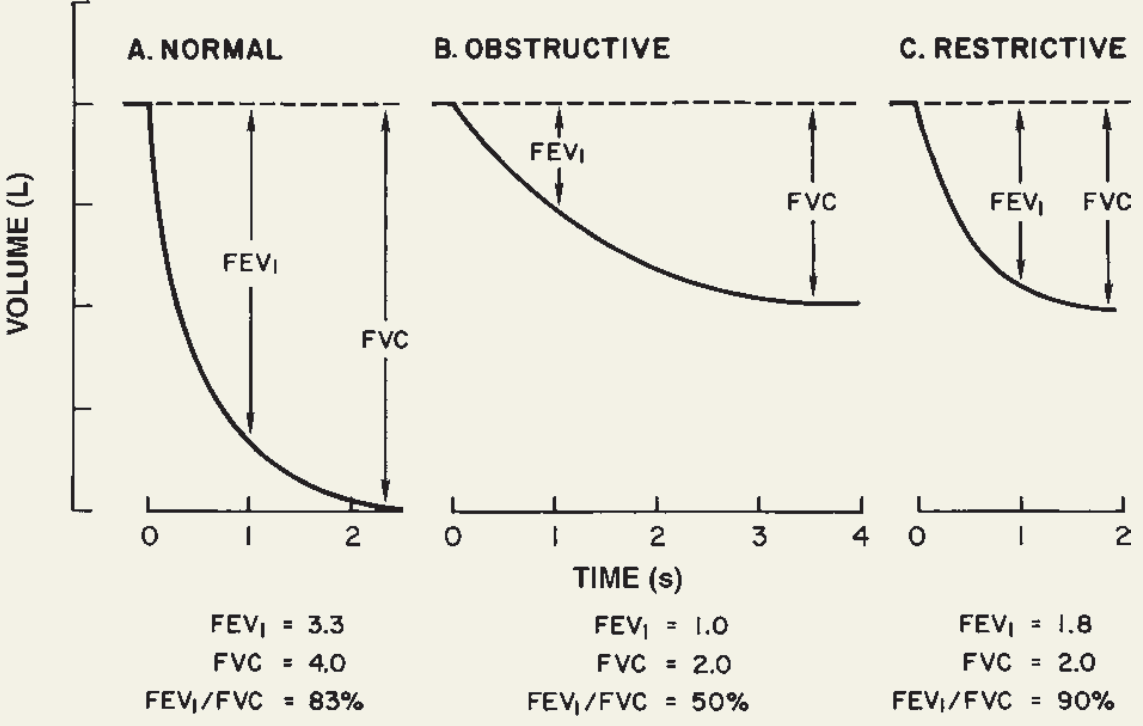
1. Basic Mechanism
| Obstructive | Restrictive | |
|---|---|---|
| Core problem | Increased resistance to airflow due to diffuse airway disease | Reduced expansion of lung parenchyma with decreased total lung capacity |
| Where the problem lies | The airways (at any level of the respiratory tract) | The lung tissue itself or the chest wall |
Robbins explains it plainly: "Obstructive lung diseases are characterized by an increase in resistance to airflow due to diffuse airway disease... By contrast, restrictive diseases are marked by reduced expansion of lung parenchyma and decreased total lung capacity." - Robbins Pathologic Basis of Disease
2. FEV1/FVC Ratio (The Hallmark PFT Finding)
| Obstructive | Restrictive | |
|---|---|---|
| FEV1/FVC ratio | Decreased (< 0.7 / < 70%) | Normal or increased (~90%) |
| Reason | Air cannot be expelled quickly - slow, prolonged expiration | All lung volumes shrink proportionally, so the ratio is preserved |
From Barash's Clinical Anesthesia: "The primary criterion for airflow obstruction is decreased FEV1/FVC ratio... A restrictive defect is a proportional decrease in all lung volumes (VC, FVC, and FEV1), but FEV1/FVC remains normal."
3. Total Lung Capacity (TLC) and Lung Volumes
| Obstructive | Restrictive | |
|---|---|---|
| TLC | Normal or increased (air trapping/hyperinflation) | Decreased (hallmark finding) |
| FRC | Normal or increased | Decreased |
| FVC | Normal or slightly decreased | Markedly decreased |
Reduced TLC is the defining feature of restriction. In obstruction, gas trapping can actually increase TLC and FRC.
4. Causes / Etiology
| Obstructive | Restrictive | |
|---|---|---|
| Common examples | COPD (emphysema + chronic bronchitis), asthma, bronchiectasis, small airways disease | Intrinsic (interstitial fibrosis, pneumoconioses, sarcoidosis) or Extrinsic (severe obesity, kyphoscoliosis, pleural disease, neuromuscular disorders like poliomyelitis) |
| Pathological basis | Airway narrowing, mucus plugging, smooth muscle hyperplasia, airspace destruction | Stiff/fibrotic lung parenchyma OR mechanical restriction of chest expansion |
5. Spirometry Curve Shape and Expiration Pattern
| Obstructive | Restrictive | |
|---|---|---|
| Expiration pattern | Slow, prolonged - the curve takes a long time to reach FVC (>4 seconds) | Rapid initial expiration that quickly levels off; reaches a lower FVC faster |
| FEV1 vs. FVC relationship | FEV1 disproportionately reduced (e.g. FEV1 = 1.0 L, FVC = 2.0 L → ratio = 50%) | Both FEV1 and FVC reduced equally (e.g. FEV1 = 1.8 L, FVC = 2.0 L → ratio = 90%) |
As Ganong's explains: "In obstructive lung disorders, patients tend to show a slow, steady slope to the FVC, resulting in a small FEV1... in the restrictive lung disorder, patient's airflow tends to be fast at first, and then quickly level out."
Summary Table
| Feature | Obstructive | Restrictive |
|---|---|---|
| Mechanism | Airflow resistance (airway disease) | Reduced lung expansion |
| FEV1/FVC ratio | Decreased (< 70%) | Normal (> 70%) |
| TLC | Normal or increased | Decreased |
| FVC | Normal or mildly decreased | Markedly decreased |
| Examples | COPD, asthma, bronchiectasis | IPF, obesity, kyphoscoliosis, sarcoidosis |
Sources:
- Robbins Pathologic Basis of Disease (9780443264528), p. 617
- Barash's Clinical Anesthesia, 9e (9781975199074), p. 1139 - Table 15-2
- Ganong's Review of Medical Physiology, 26th ed. (9781260122404)
Carbohydrates biochemistry notes
Reading File
This is a broad biochemistry topic. Let me search the library simultaneously across multiple carbohydrate subtopics.
Finding Sources
Finding Sources
Finding Sources
Finding Sources
Finding Sources
Finding Sources
Excellent - I found dedicated biochemistry textbooks. Let me now read the key sections from Lippincott Biochemistry and Basic Medical Biochemistry in parallel.
Finding Sources
Reading File
Finding Sources
Reading File
Finding Sources
Reading File
Let me now read the classification/structure section and TCA/glycogen sections from Lippincott:
Reading File
Reading File
Reading File
Reading File
Reading File
Reading File
I now have rich textbook content. Let me fetch a few key images and read the TCA cycle overview section.
Loading Image
Loading Image
Reading File
From Satyanarayana book of biochemistry
Let me check if Satyanarayana's Biochemistry is available in the library.
Finding Sources
Finding Sources
Unfortunately, Satyanarayana's Biochemistry is not available in the textbook library. The biochemistry books currently in the library are:
- Lippincott Illustrated Reviews: Biochemistry, 8th ed - very popular for medical students, covers carbohydrates, metabolism, enzymes, etc. in great detail
- Harper's Illustrated Biochemistry, 32nd ed - another top-tier reference
- Basic Medical Biochemistry: A Clinical Approach, 6e
Since Satyanarayana is not available, I have two options for you:
Option A - I can prepare comprehensive carbohydrate biochemistry notes based on Lippincott and Harper's, which cover the same topics as Satyanarayana (classification, structure, glycolysis, TCA cycle, glycogen metabolism, gluconeogenesis, pentose phosphate pathway, etc.) and are widely used alongside it.
Option B - If you have a PDF/photo of your Satyanarayana carbohydrates chapter, you can upload it here and I'll extract and compile notes directly from it.
Which would you prefer?
A
Reading File
Reading File
Reading File
Finding Sources
Finding Sources
Reading File
Finding Sources
Reading File
Finding Sources
Finding Sources
Reading File
Reading File
Reading File
Reading File
Finding Sources
Reading File
Reading File
Loading Image
Loading Image
Loading Image
Here are your complete Carbohydrates Biochemistry Notes, compiled from Lippincott Illustrated Reviews (8th ed) and Harper's Illustrated Biochemistry (32nd ed) - covering all topics found in Satyanarayana:
CARBOHYDRATES - BIOCHEMISTRY NOTES
Source: Lippincott Illustrated Reviews: Biochemistry, 8e & Harper's Illustrated Biochemistry, 32e
CHAPTER 1: INTRODUCTION & CLASSIFICATION
Definition
Carbohydrates are the most abundant organic molecules in nature. The empiric formula for simple carbohydrates is (CH₂O)n, where n ≥ 3, hence the name "hydrate of carbon."
Functions
- Primary energy source (4 kcal/g)
- Storage form of energy (glycogen in liver and muscle)
- Structural components (cell walls of bacteria, exoskeleton of insects, cellulose in plants)
- Cell membrane components - mediate intercellular communication
- Precursors for amino acids, fatty acids, and nucleotides
CHAPTER 2: CLASSIFICATION & STRUCTURE
A. Based on Number of Carbon Atoms
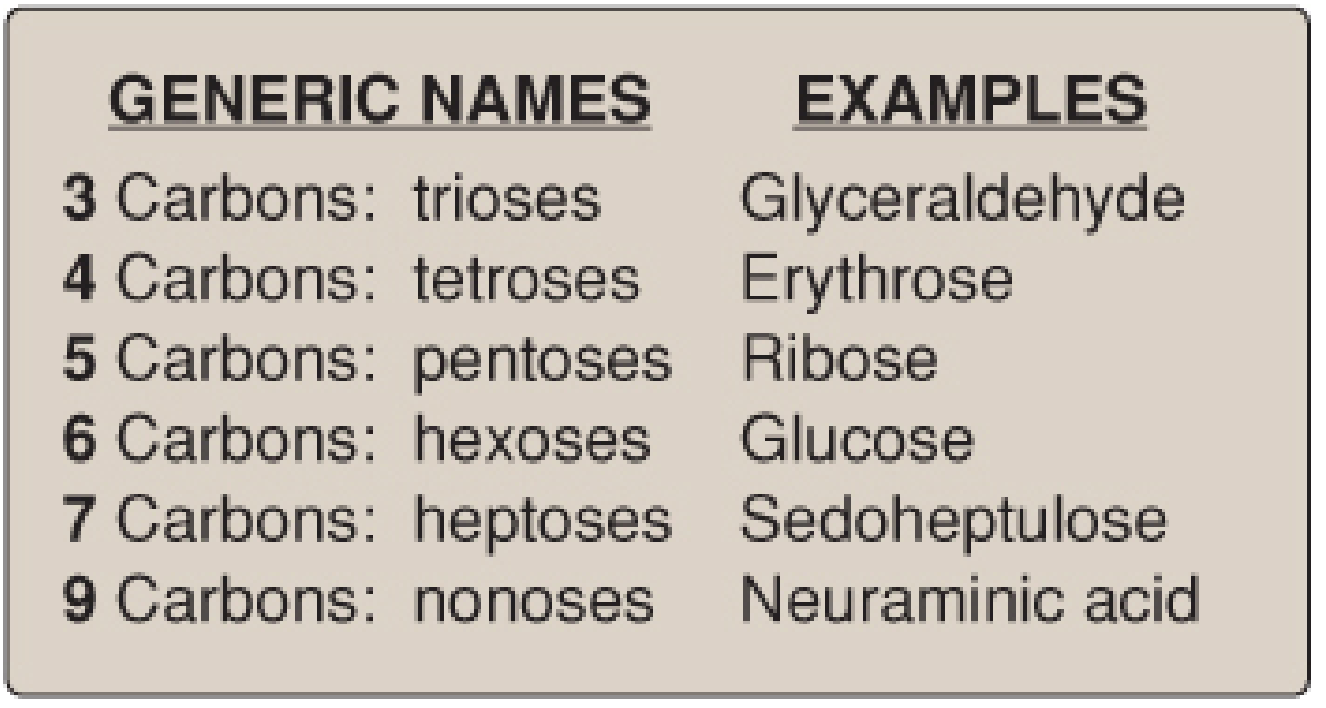
| Carbons | Name | Example |
|---|---|---|
| 3 | Trioses | Glyceraldehyde, Dihydroxyacetone |
| 4 | Tetroses | Erythrose |
| 5 | Pentoses | Ribose, Ribulose |
| 6 | Hexoses | Glucose, Fructose, Galactose |
| 7 | Heptoses | Sedoheptulose |
| 9 | Nonoses | Neuraminic acid |
B. Based on Carbonyl Group (Aldoses vs Ketoses)
- Aldoses - contain an aldehyde group (e.g., glyceraldehyde, glucose)
- Ketoses - contain a keto group (e.g., dihydroxyacetone, fructose)
C. Based on Size (Complexity)
| Type | Subunits | Examples |
|---|---|---|
| Monosaccharides | 1 unit | Glucose, Fructose, Galactose |
| Disaccharides | 2 units | Sucrose, Lactose, Maltose |
| Oligosaccharides | 3-10 units | Raffinose, Stachyose |
| Polysaccharides | >10 units | Starch, Glycogen, Cellulose |
D. Stereoisomerism
- Isomers - same formula, different structures. E.g., glucose, fructose, mannose, galactose all share C₆H₁₂O₆
- Epimers - differ at only ONE carbon (not the carbonyl carbon). E.g.:
- Glucose & galactose = C-4 epimers
- Glucose & mannose = C-2 epimers
- Enantiomers (D/L forms) - mirror images of each other. Nearly all sugars in humans are D-isomers
- Anomers (α/β forms) - differ at carbon 1 (the anomeric carbon). E.g., α-D-glucose vs β-D-glucose
E. Important Disaccharides
| Disaccharide | Components | Bond | Found in |
|---|---|---|---|
| Maltose | Glucose + Glucose | α(1→4) | Starch digestion |
| Lactose | Galactose + Glucose | β(1→4) | Milk |
| Sucrose | Glucose + Fructose | α,β(1→2) | Table sugar |
| Trehalose | Glucose + Glucose | α,α(1→1) | Insects, fungi |
F. Important Polysaccharides
| Polysaccharide | Source | Bonds | Notes |
|---|---|---|---|
| Starch (amylose) | Plants | α(1→4) | Unbranched |
| Starch (amylopectin) | Plants | α(1→4) + α(1→6) | Branched every 24-30 residues |
| Glycogen | Animals | α(1→4) + α(1→6) | Branched every 8-12 residues |
| Cellulose | Plants | β(1→4) | Humans cannot digest |
CHAPTER 3: DIGESTION & ABSORPTION OF CARBOHYDRATES
Digestion
Digestion is catalyzed by glycoside hydrolases (glycosidases). Final products: glucose, galactose, and fructose.
| Site | Enzyme | Substrate | Products |
|---|---|---|---|
| Mouth | Salivary α-amylase | Starch, glycogen | Dextrins, oligosaccharides |
| Stomach | - (acid inactivates amylase) | - | - |
| Small intestine (lumen) | Pancreatic α-amylase | Dextrins | Shorter oligosaccharides |
| Small intestine (brush border) | Sucrase | Sucrose | Glucose + Fructose |
| Lactase | Lactose | Glucose + Galactose | |
| Maltase | Maltose | Glucose + Glucose | |
| Isomaltase (α-dextrinase) | α(1→6) bonds | Glucose |
Key note: Humans lack β-glucosidase, so cellulose cannot be digested.
Absorption
- Glucose and galactose are absorbed by Na⁺-dependent active transport (SGLT-1 cotransporter) - secondary active transport
- Fructose is absorbed by facilitated diffusion via GLUT-5
- All three enter portal blood and are transported to liver
GLUT Transporters (Facilitated Diffusion)
| Transporter | Location | Notes |
|---|---|---|
| GLUT-1 | Most tissues (RBCs, brain) | Basal glucose uptake |
| GLUT-2 | Liver, pancreatic β cells, kidney | High Km - glucose sensor |
| GLUT-3 | Brain neurons | High affinity |
| GLUT-4 | Muscle, adipose | Insulin-stimulated |
| GLUT-5 | Small intestine | Fructose transporter |
CHAPTER 4: GLYCOLYSIS
Glycolysis = breakdown of glucose to pyruvate (aerobic) or lactate (anaerobic). Occurs in the cytosol of ALL cells.
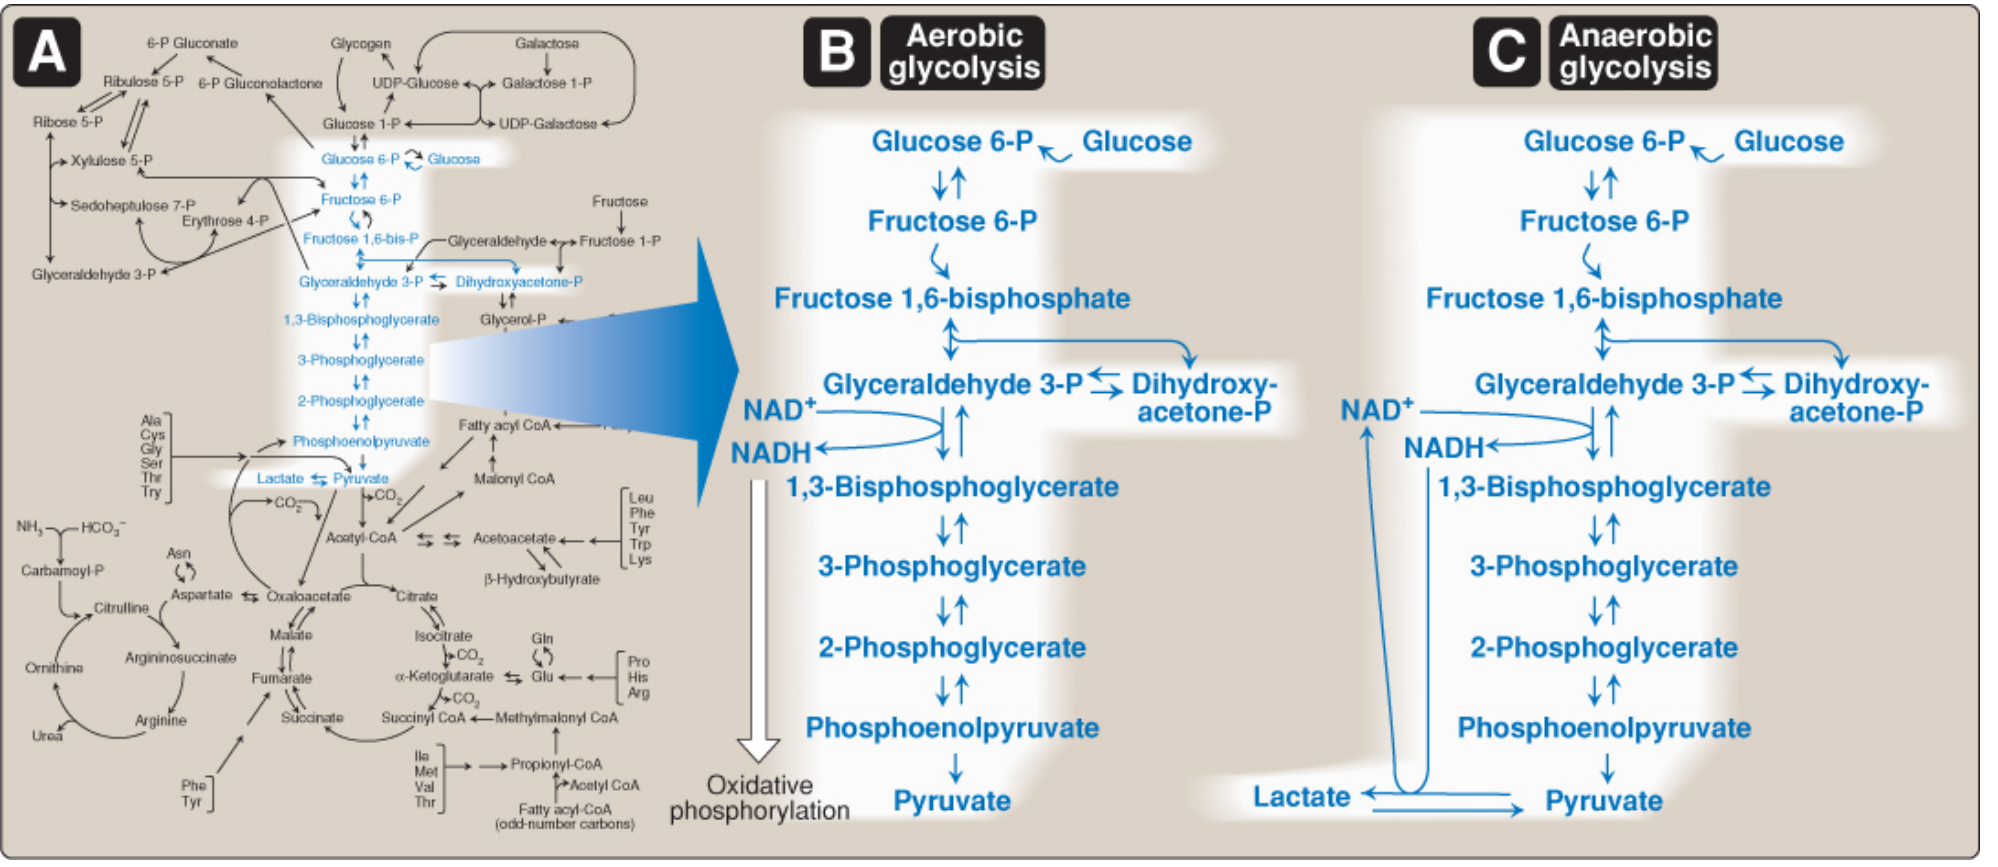
The 10 Steps of Glycolysis
PHASE 1: Energy Investment Phase (Reactions 1-5) - 2 ATP consumed
| Step | Reaction | Enzyme | Notes |
|---|---|---|---|
| 1 | Glucose → Glucose-6-phosphate | Hexokinase (all tissues) / Glucokinase (liver, β cells) | Irreversible; ATP used |
| 2 | Glucose-6-P → Fructose-6-P | Phosphoglucose isomerase | Reversible; aldose→ketose |
| 3 | Fructose-6-P → Fructose-1,6-bisphosphate | Phosphofructokinase-1 (PFK-1) | Rate-limiting step; irreversible |
| 4 | Fructose-1,6-bisP → DHAP + Glyceraldehyde-3-P | Aldolase | Reversible |
| 5 | DHAP → Glyceraldehyde-3-P | Triose phosphate isomerase | Reversible |
PHASE 2: Energy Payoff Phase (Reactions 6-10) - 4 ATP produced
| Step | Reaction | Enzyme | Notes |
|---|---|---|---|
| 6 | G3P → 1,3-bisphosphoglycerate | G3P dehydrogenase | NAD⁺ → NADH |
| 7 | 1,3-BPG → 3-phosphoglycerate | Phosphoglycerate kinase | ATP generated (substrate-level) |
| 8 | 3-PG → 2-phosphoglycerate | Phosphoglycerate mutase | Reversible |
| 9 | 2-PG → Phosphoenolpyruvate (PEP) | Enolase | Reversible |
| 10 | PEP → Pyruvate | Pyruvate kinase | Irreversible; ATP generated |
Three Irreversible (Regulated) Steps:
- Step 1 - Hexokinase/Glucokinase
- Step 3 - PFK-1 (rate-limiting step)
- Step 10 - Pyruvate kinase
Regulation of PFK-1 (Most Important Regulator)
| Activators | Inhibitors |
|---|---|
| AMP, ADP | ATP (high energy) |
| Fructose-2,6-bisphosphate (most potent) | Citrate |
| Pi | Low pH |
Fructose-2,6-bisphosphate is the most potent activator of PFK-1. It is formed by PFK-2, which is activated by insulin and inhibited by glucagon.
Energy Yield from Glycolysis
| Anaerobic | Aerobic | |
|---|---|---|
| Net ATP | 2 ATP | 2 ATP (+ NADH for ETC) |
| NADH produced | 0 (net) | 2 NADH |
| End product | Lactate | Pyruvate → TCA |
Fate of Pyruvate
- Aerobic conditions → Pyruvate dehydrogenase complex → Acetyl-CoA → TCA cycle
- Anaerobic conditions → Lactate dehydrogenase (LDH) → Lactate (regenerates NAD⁺)
- Transamination → Alanine
- Carboxylation → Oxaloacetate (gluconeogenesis)
Hexokinase vs Glucokinase
| Property | Hexokinase (I-III) | Glucokinase (IV) |
|---|---|---|
| Location | Most tissues | Liver, β cells |
| Km for glucose | Low (~0.1 mM) | High (~10 mM) |
| Vmax | Low | High |
| Inhibited by G-6-P? | Yes | No |
| Induced by insulin? | No | Yes |
| Role | Housekeeping | Glucose sensor |
CHAPTER 5: CITRIC ACID (TCA) CYCLE / KREBS CYCLE
Location: Mitochondrial matrix
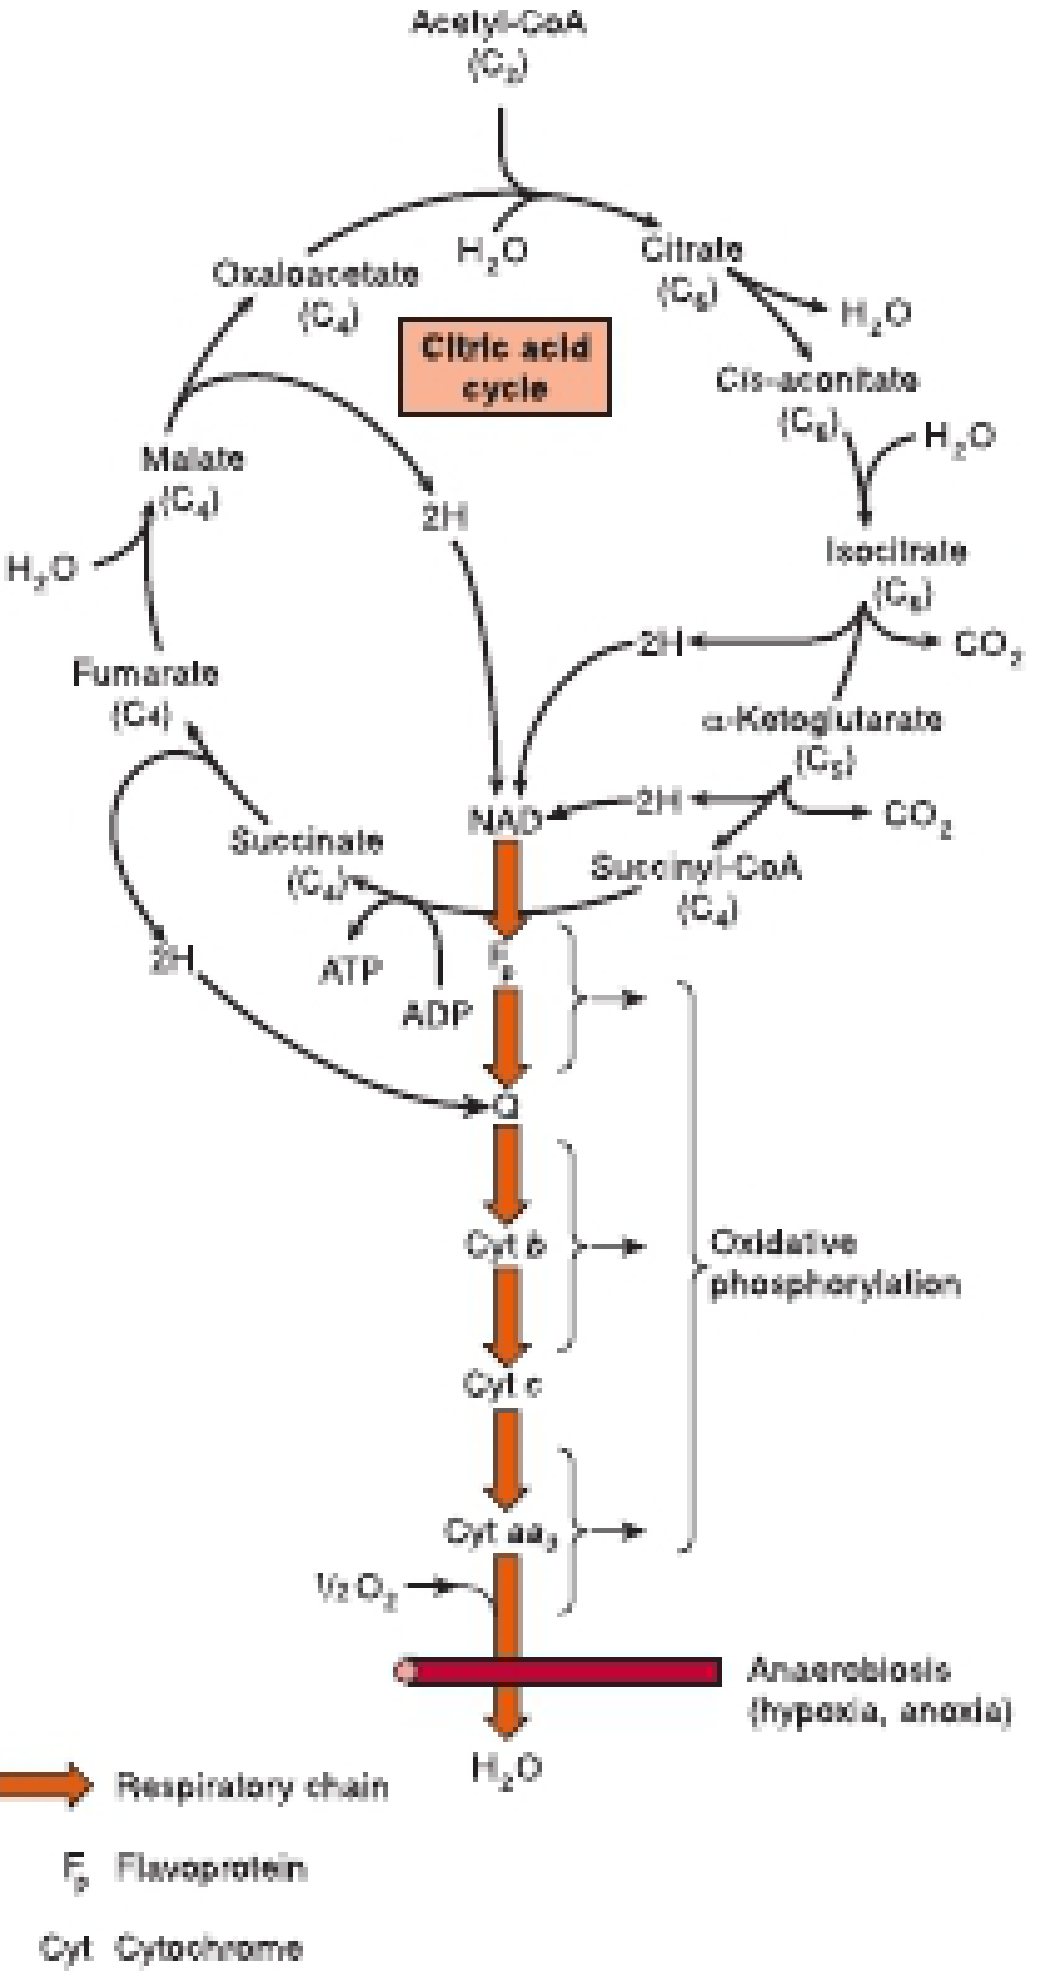
Overview
- Acetyl-CoA (C₂) + Oxaloacetate (C₄) → Citrate (C₆)
- Per turn: 2 CO₂ released, oxaloacetate regenerated
- The cycle is amphibolic - both catabolic and anabolic
Steps of the TCA Cycle (8 Steps)
| Step | Reaction | Enzyme | Cofactor/Product |
|---|---|---|---|
| 1 | Oxaloacetate + Acetyl-CoA → Citrate | Citrate synthase | - |
| 2 | Citrate → Isocitrate (via cis-aconitate) | Aconitase | H₂O |
| 3 | Isocitrate → α-Ketoglutarate | Isocitrate dehydrogenase | NADH, CO₂ |
| 4 | α-Ketoglutarate → Succinyl-CoA | α-KG dehydrogenase | NADH, CO₂ |
| 5 | Succinyl-CoA → Succinate | Succinyl-CoA synthetase | GTP (substrate-level) |
| 6 | Succinate → Fumarate | Succinate dehydrogenase | FADH₂ |
| 7 | Fumarate → Malate | Fumarase | H₂O |
| 8 | Malate → Oxaloacetate | Malate dehydrogenase | NADH |
Energy Yield per Acetyl-CoA (per turn)
- 3 NADH × 2.5 ATP = 7.5 ATP
- 1 FADH₂ × 1.5 ATP = 1.5 ATP
- 1 GTP = 1 ATP
- Total: ~10 ATP per turn (Harper's)
Regulated Steps (Inhibited by high energy)
- Citrate synthase - inhibited by ATP, NADH, succinyl-CoA
- Isocitrate dehydrogenase - inhibited by ATP, NADH; activated by ADP
- α-KG dehydrogenase - inhibited by ATP, NADH, succinyl-CoA
Vitamins Required by TCA Cycle
| Vitamin | Coenzyme | Enzyme |
|---|---|---|
| Thiamine (B₁) | TPP | α-KG dehydrogenase |
| Riboflavin (B₂) | FAD | Succinate dehydrogenase |
| Niacin (B₃) | NAD⁺ | Isocitrate DH, α-KG DH, Malate DH |
| Pantothenic acid (B₅) | Coenzyme A | Succinyl-CoA synthetase |
CHAPTER 6: GLYCOGEN METABOLISM
Glycogen Structure
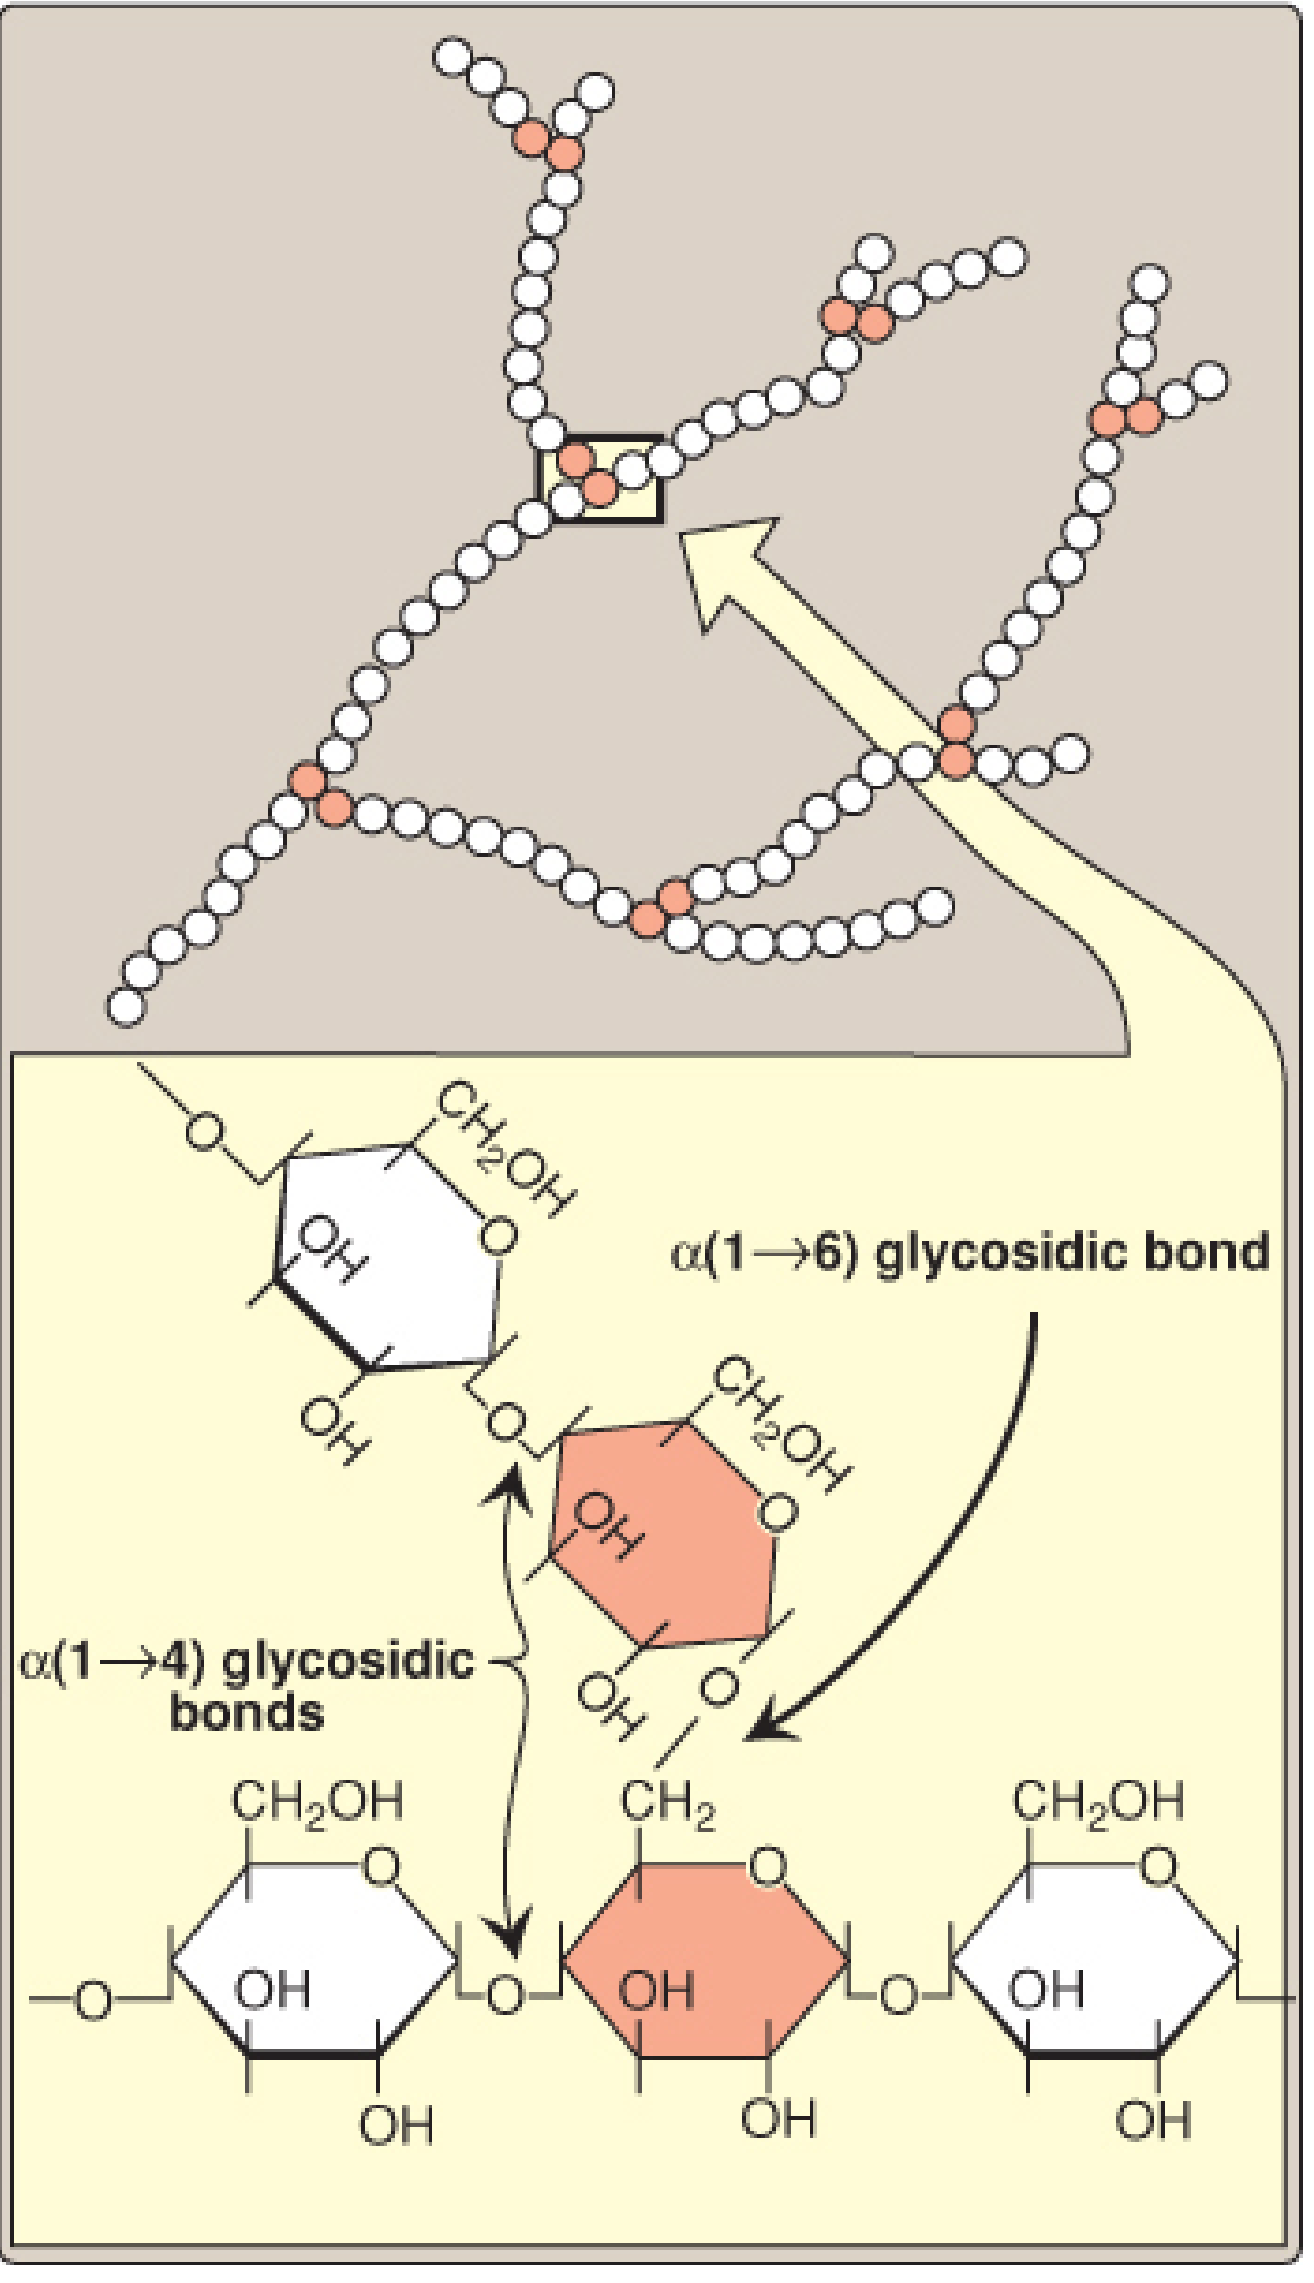
- Branched polysaccharide of α-D-glucose
- α(1→4) glycosidic bonds in linear chains
- α(1→6) bonds at branch points (every 8-12 residues)
- Stored in: Liver (~100g, up to 10% wet weight) and Muscle (~400g, 1-2% wet weight)
Glycogenesis (Glycogen Synthesis)
Location: Cytosol. Energy source: ATP and UTP
- Glucose → Glucose-6-P (Hexokinase/Glucokinase, ATP)
- Glucose-6-P → Glucose-1-P (Phosphoglucomutase)
- Glucose-1-P + UTP → UDP-glucose + PPi (UDP-glucosyl pyrophosphorylase)
- UDP-glucose → added to chain (Glycogen synthase, α[1→4] bonds)
- Branching enzyme transfers 6-7 glucosyl units to form α(1→6) branches
Key enzyme: Glycogen synthase - activated by glucose-6-P and insulin; inhibited by phosphorylation (glucagon/epinephrine)
Glycogenolysis (Glycogen Degradation)
- Glycogen phosphorylase cleaves α(1→4) bonds → Glucose-1-P (requires inorganic phosphate Pi; NOT water)
- Debranching enzyme (has two activities):
- Oligo-α(1→4)→(1→4) glucan transferase (transfers 3 glucose residues)
- α(1→6) glucosidase (cleaves branch point → free glucose)
- Glucose-1-P → Glucose-6-P (Phosphoglucomutase)
- In liver: Glucose-6-P → Glucose (Glucose-6-phosphatase) → released to blood In muscle: NO glucose-6-phosphatase → glucose stays for glycolysis
Regulation of Glycogen Metabolism
| State | Hormone | Effect |
|---|---|---|
| Fed/high glucose | Insulin | Activates glycogen synthase; inhibits phosphorylase → SYNTHESIS |
| Fasting/stress | Glucagon (liver), Epinephrine | Activates phosphorylase via cAMP/PKA cascade → DEGRADATION |
CHAPTER 7: GLUCONEOGENESIS
Definition: Synthesis of glucose from non-carbohydrate precursors.
Location: Mainly liver (~90%), some in kidney
When: After a prolonged fast (>12-24 hours when liver glycogen is depleted)
Substrates (Gluconeogenic Precursors)
- Lactate - from RBCs and exercising muscle (via Cori cycle)
- Glycerol - from adipose tissue lipolysis
- Glucogenic amino acids - all except leucine and lysine
- Propionate - from odd-chain fatty acids
Bypassing the 3 Irreversible Steps of Glycolysis
| Glycolysis (irreversible) | Gluconeogenesis (bypass) | Enzyme |
|---|---|---|
| Glucose → G-6-P | G-6-P → Glucose | Glucose-6-phosphatase (liver only) |
| F-6-P → F-1,6-bisP | F-1,6-bisP → F-6-P | Fructose-1,6-bisphosphatase |
| PEP → Pyruvate | Pyruvate → OAA → PEP | Pyruvate carboxylase + PEPCK |
Pyruvate carboxylase requires biotin (B₇) and is activated by acetyl-CoA. Located in mitochondria. PEPCK (phosphoenolpyruvate carboxykinase) is in cytosol.
Cori Cycle
- Muscle glycolysis → Lactate → Blood → Liver → Gluconeogenesis → Glucose → Blood → Muscle
- Transfers energy burden from muscle to liver
CHAPTER 8: PENTOSE PHOSPHATE PATHWAY (HMP Shunt)
Location: Cytosol
Does NOT produce or consume ATP
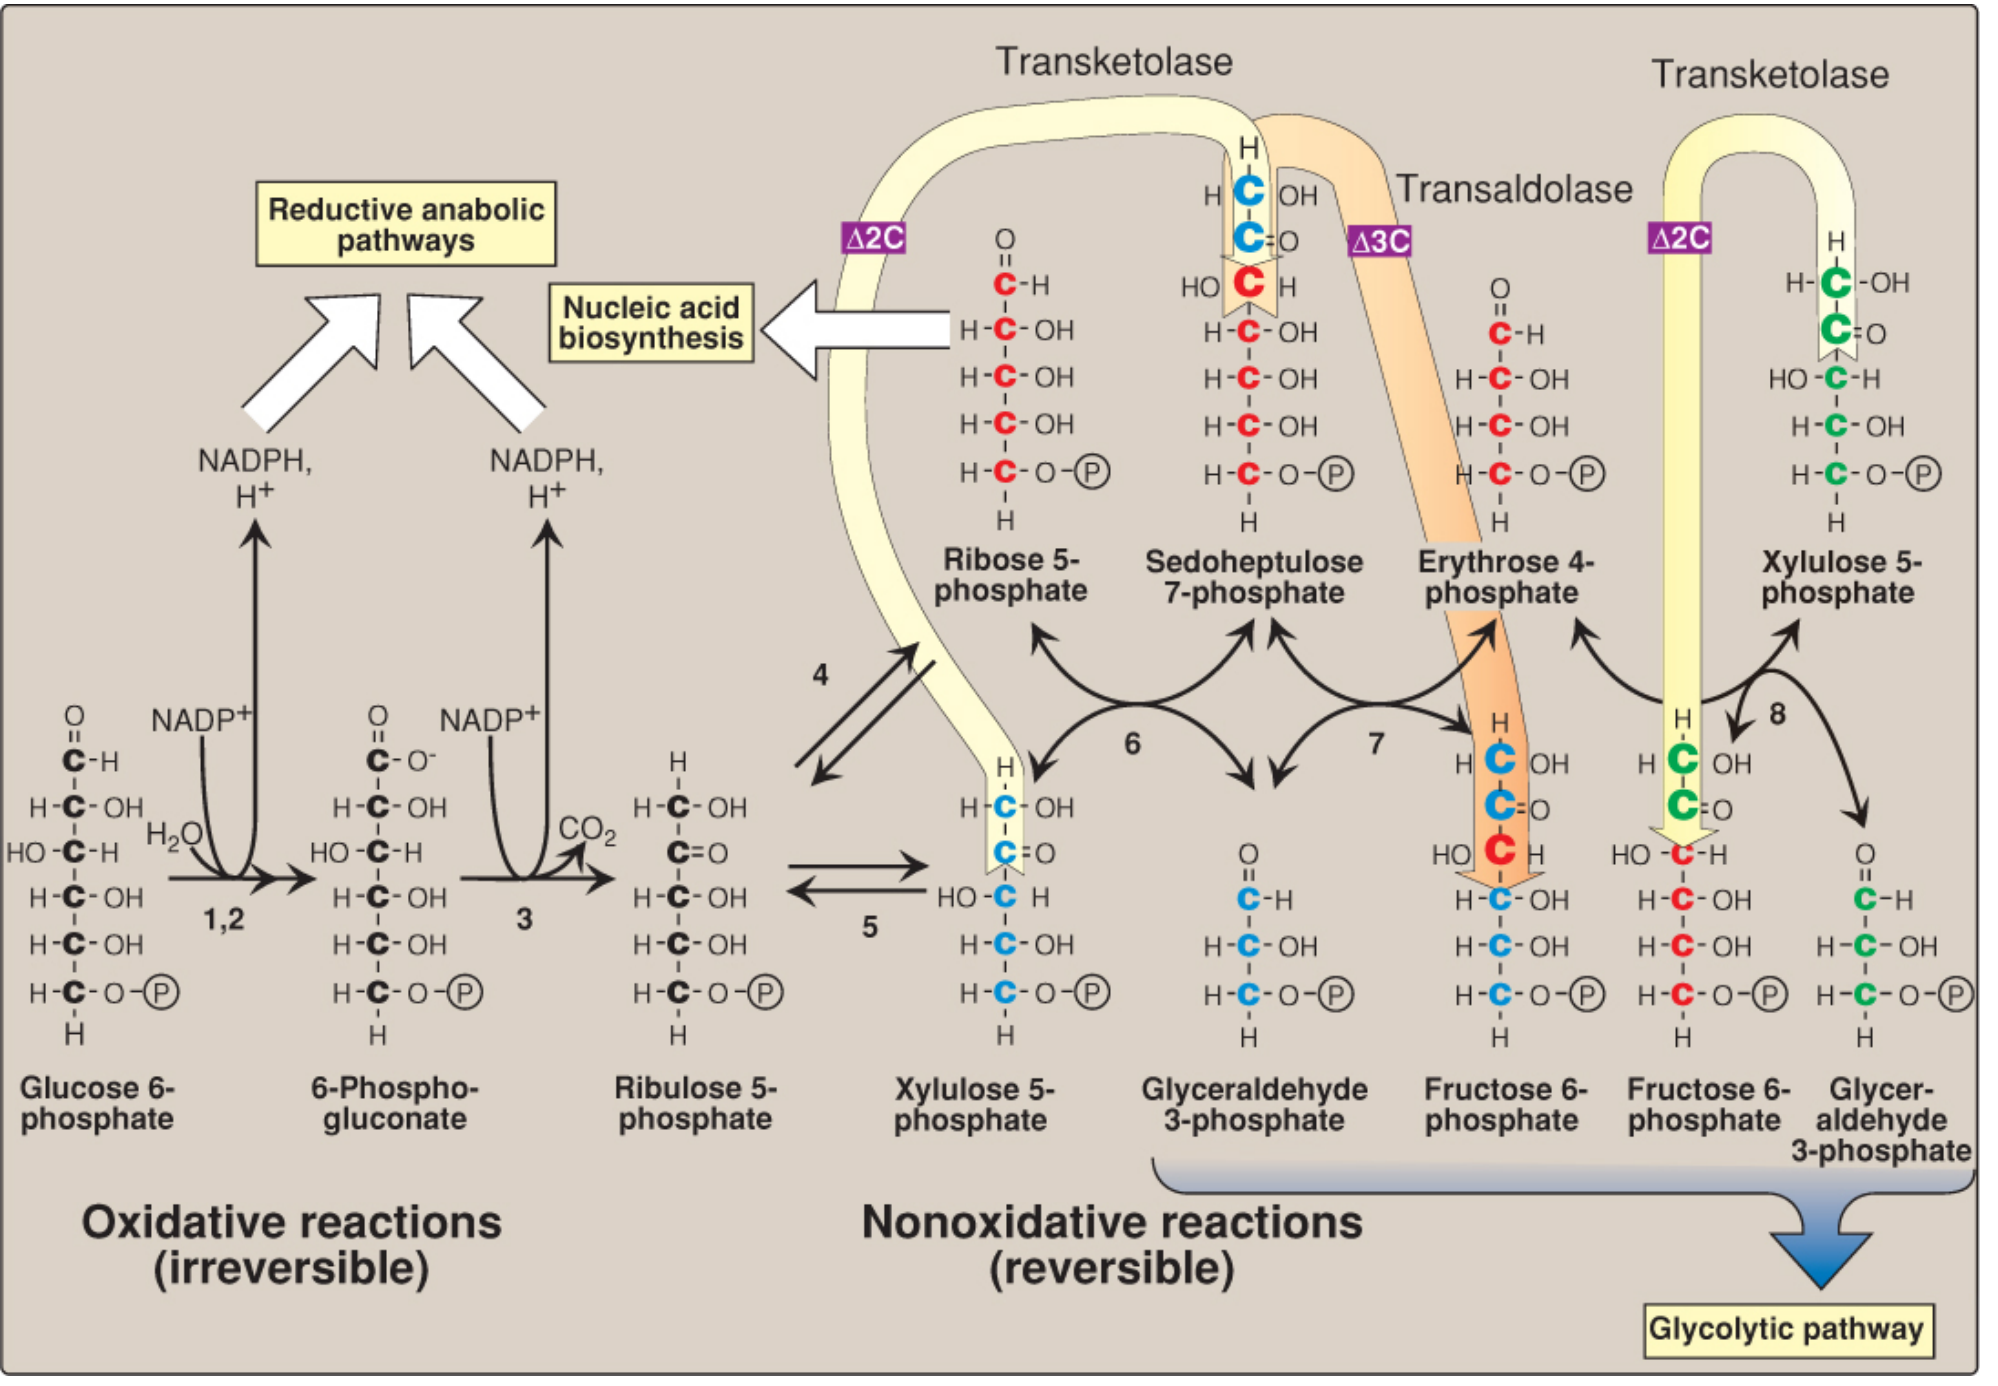
Functions
- Produces NADPH - for reductive biosynthesis (fatty acids, cholesterol, steroid hormones) and protection against oxidative damage
- Produces Ribose-5-phosphate - for nucleotide/nucleic acid synthesis
Phase 1: Oxidative (Irreversible)
Glucose-6-P → 6-phosphogluconate → Ribulose-5-P + 2 NADPH + CO₂
- Rate-limiting enzyme: Glucose-6-phosphate dehydrogenase (G6PD)
- Highly active in: Liver, lactating mammary glands, adrenal cortex, RBCs
Phase 2: Non-oxidative (Reversible)
- Ribulose-5-P ⇌ Ribose-5-P (for nucleotides) or Xylulose-5-P
- Transketolase (requires thiamine/B₁) and Transaldolase interconvert sugars
- Products feed back into glycolysis as Fructose-6-P and Glyceraldehyde-3-P
G6PD Deficiency (Clinical Importance)
- X-linked recessive
- RBCs cannot regenerate NADPH → cannot reduce glutathione
- Oxidant stress (primaquine, infections, fava beans) causes hemolytic anemia
- Common in malaria-endemic regions (provides some protection against malaria)
CHAPTER 9: REGULATION OF BLOOD GLUCOSE
| Blood Glucose Level | Response |
|---|---|
| Normal: 70-110 mg/dL (fasting) | Basal insulin/glucagon balance |
| High glucose (postprandial) | ↑ Insulin → glycolysis, glycogenesis, lipogenesis |
| Low glucose (fasting) | ↑ Glucagon → glycogenolysis, gluconeogenesis, lipolysis |
Hormones Regulating Blood Glucose
| Hormone | Source | Effect on Blood Glucose |
|---|---|---|
| Insulin | Pancreatic β cells | ↓ (hypoglycemic) |
| Glucagon | Pancreatic α cells | ↑ (hyperglycemic) |
| Epinephrine | Adrenal medulla | ↑ (hyperglycemic) |
| Cortisol | Adrenal cortex | ↑ (hyperglycemic) |
| Growth hormone | Anterior pituitary | ↑ (hyperglycemic) |
QUICK SUMMARY TABLE: Energy Yields
| Pathway | Net ATP | Location |
|---|---|---|
| Glycolysis (anaerobic) | 2 ATP | Cytosol |
| Glycolysis (aerobic) | 8 ATP (including NADH) | Cytosol |
| Pyruvate → Acetyl-CoA | ~2.5 ATP/pyruvate | Mitochondria |
| TCA cycle (per Acetyl-CoA) | ~10 ATP | Mitochondria |
| Complete glucose oxidation | ~30-32 ATP | Both |
Sources: Lippincott Illustrated Reviews: Biochemistry, 8th ed (ISBN 9781975155063) | Harper's Illustrated Biochemistry, 32nd ed (ISBN 9781260469943)
This is a shared conversation. Sign in to Orris to start your own chat.