
sources of health information according to park textbook of psm
Sources of Health Information - Park's Textbook of Preventive and Social Medicine
1. Census
- In India: first regular census in 1881, last held in March 2011; governed by the Census Act of 1948; directed by the Census Commissioner of India.
- Provides: total population count, age/sex distribution, social and economic characteristics, living conditions, income - all essential as a frame of reference for planning and research.
- Main drawback: full results are not available quickly - takes years to analyze.
2. Registration of Vital Events
- Governed in India by the Registration of Births and Deaths Act, 1969.
- India also operates the Sample Registration System (SRS) for states where civil registration is deficient - this provides estimates of birth rate, death rate, infant mortality rate, etc.
- Limitation: incomplete and inaccurate registration in many developing countries.
3. Mortality Statistics
- Death certificates
- Vital registration systems
4. Notification of Diseases
- Lists of notifiable diseases vary by country and state.
- At the international level, cholera, plague, and yellow fever are notifiable to WHO under the International Health Regulations (IHR); others (malaria, rabies, influenza, etc.) are subject to international surveillance.
- Limitations: covers only a fraction of total sickness; significant under-reporting; atypical and subclinical cases are missed; accuracy depends on availability of lab facilities.
5. Hospital Records
- Provides data on: geographic sources of patients, age/sex distribution of diseases, duration of stay, diagnosis distribution, cost of hospital care, bed-occupancy rates.
- Main drawbacks:
- Only the "tip of the iceberg" - mild and subclinical cases not captured.
- Admission policy varies by hospital - highly selective.
- Population at risk (denominator) cannot be defined.
- Poor guide to estimating disease frequency in the community.
6. Disease Registers
- Registers exist for: cancer, stroke, myocardial infarction, blindness, congenital defects, congenital rubella, tuberculosis, leprosy.
- Valuable for: duration of illness, case fatality, survival, natural history of chronic disease.
7. Record Linkage
- Useful for: studying disease associations (which may have aetiological significance), twin studies, chronic disease epidemiology, family and genetic studies.
- Limitation: enormous volume of data; currently beyond the reach of many developing countries.
8. Epidemiological Surveillance
- Yields considerable morbidity and mortality data for specific diseases.
9. Other Health Service Records
- Hospital outpatient departments
- Primary Health Centres (PHCs) and subcentres
- Polyclinics
- Private practitioners
- School health services
- Occupational health services
- Maternal and child health (MCH) clinics
10. Health Surveys
| Type | Purpose |
|---|---|
| (a) Evaluating health status | Community diagnosis - distribution of problems over time and space |
| (b) Investigating factors | Environment, occupation, income, aetiology, risk factors |
| (c) Administrative surveys | Use of health services, expenditure, evaluation of medical care |
- Health interview (face-to-face) survey - measures perceived morbidity, disability, beliefs, attitudes; gives population-based data.
- Health examination survey - more valid for morbidity data; expensive, limited scale.
- Health records survey - cheapest but not population-based; reliability questionable.
- Mailed questionnaire survey - simpler, cheaper; high non-response rate.
Generate a visual flowchart showing Park's health information system framework
A clean professional flowchart titled "Park's Health Information System Framework" showing the following structure: At the top: a central box labeled "HEALTH INFORMATION SYSTEM" with subtitle "Routine Health Statistics as its Lifeblood" Below it, an arrow pointing down to a row of 3 boxes showing the administrative levels: - "National Level Planning" - "State Level Planning" - "Hospital Administration" Below that, a large section titled "SOURCES OF HEALTH INFORMATION" with 10 numbered source boxes arranged in two columns: Left column: 1. Census - "Every 10 years | Demographic, social, economic data" 2. Registration of Vital Events - "Continuous | Births, Deaths, Marriages" 3. Mortality Statistics - "Death certificates | ICD coding" 4. Notification of Diseases - "Legal requirement | Notifiable diseases" 5. Hospital Records - "Diagnosis, stay, procedures | Tip of iceberg" Right column: 6. Disease Registers - "Cancer, TB, Leprosy, Stroke | Follow-up data" 7. Record Linkage - "Individual health file | Multi-source assembly" 8. Epidemiological Surveillance - "National control programmes | Malaria, TB, Leprosy" 9. Other Health Service Records - "PHC, OPD, Private practitioners" 10. Health Surveys - "Interview | Examination | Records | Questionnaire" At the bottom: a box labeled "USES OF HEALTH INFORMATION" with 4 outputs: - Health Planning - Monitoring & Evaluation - Research - Early Warning / Outbreak Detection Use a blue and white color scheme with clear arrows connecting boxes, clean sans-serif fonts, and a medical/academic visual style.
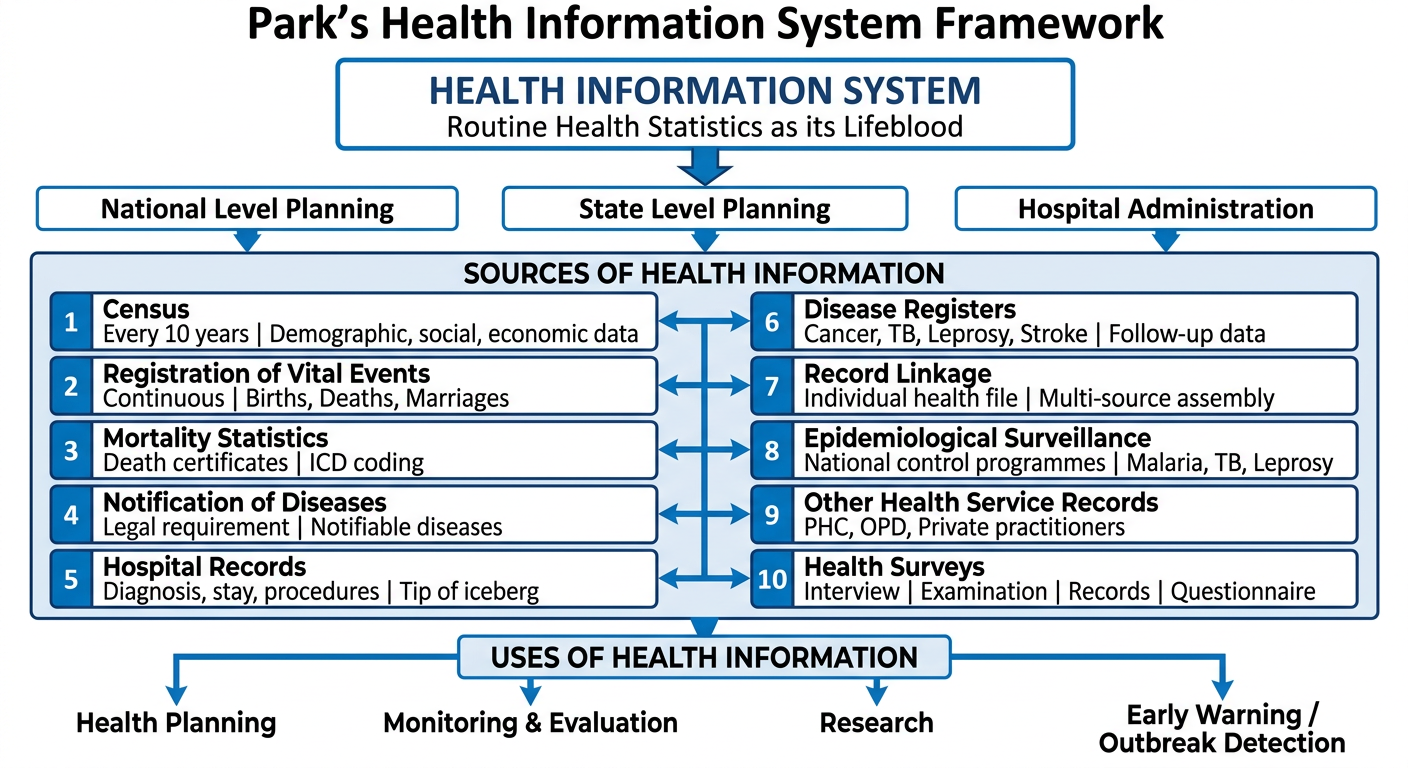
- Top level - the HIS core concept (routine health statistics)
- Middle level - the 3 administrative contexts that determine information needs
- Main body - all 10 sources of health information with key descriptors for each
- Bottom level - the 4 end-uses of the collected information (planning, monitoring, research, early warning)
If a 95% confidence Interval for prevalence of lung cancer among smokers aged > 65 years is 48% to 64%, the chance that the prevalence could be less than 48% is
- Chance prevalence is less than 48% (lower tail) = 2.5%
- Chance prevalence is greater than 64% (upper tail) = 2.5%
Based on this data, all of the following rates can be calculated except: population 2,10,000, 200 new cases detected and 12 cases had died
What CAN be calculated:
| Rate | Formula | Calculation |
|---|---|---|
| Incidence Rate | New cases / Population × 1000 | 200/2,10,000 × 1000 = 0.95 per 1000 |
| Cause-specific Death Rate | Deaths from disease / Population × 1,00,000 | 12/2,10,000 × 1,00,000 = 5.7 per 1,00,000 |
| Case Fatality Rate | Deaths / New cases × 100 | 12/200 × 100 = 6% |
What CANNOT be calculated:
Prevalence = All existing cases (old + new) / Population × 1000
Prevalence ≈ Incidence × Duration of disease