
Yrr 11th mein jo respiration 🫁 wala chapter hai vo nhi aata bilkul bhi neet level tk smjhao
respiratory system anatomy lungs diagram
This medical illustration is a stylized 3D anatomical diagram of the human respiratory system, focusing on the lungs and trachea. The central feature is a pair of symmetrically positioned lungs with a granulated, textured surface that evokes the presence of pulmonary parenchyma and alveoli. Connecting them at the superior midline is the trachea, depicted with visible horizontal ridges representing cartilaginous rings. The image utilizes a cool, high-contrast blue color palette with digital overlays—including binary code patterns and circular UI elements—to establish a clinical and technological aesthetic. This infographic-style visual represents the intersection of pulmonology and advanced diagnostic technology, specifically the application of deep learning algorithms and artificial intelligence in lung cancer imaging and nodule detection. The educational focus is on visualizing thoracic anatomy within the context of computer-aided diagnosis (CAD) and medical informatics.
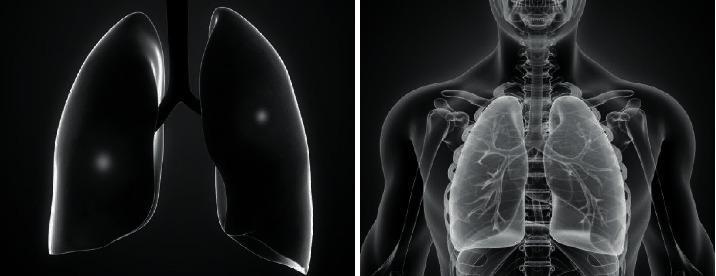
A dual-panel medical illustration titled 'Pathological diagram of severe pneumonia' providing a comparative anatomical view of the human respiratory system. The left panel shows an isolated 3D anatomical model of the lungs and trachea against a black background. The lung surfaces appear smooth and dark, with subtle highlights suggesting three-dimensional volume and lobar structure. The right panel displays the lungs integrated into a full-body sagittal-view silhouette of a human torso. This panel reveals the internal architecture of the respiratory tree, including the branching patterns of the bronchi and bronchioles within the lung parenchyma. The skeletal framework, including the rib cage, clavicles, and vertebral column, is visible as a translucent overlay. This educational visual is designed to demonstrate the relationship between external lung morphology and internal airway distribution, specifically contextualizing the sites of parenchymal inflammation and consolidation typical in severe pneumonia cases for medical students and clinical trainees.
This educational illustration, titled 'Development of the Broncho-Pulmonary Family Tree,' uses the human respiratory anatomy as a metaphorical framework to document medical mentorship. The diagram depicts the trachea, primary bronchi, and the bilateral lung lobes. Within the anatomical boundaries of the lungs, names of clinicians and scientists mentored by Dr. Mary Ellen Avery (a pioneer in neonatal pediatrics and pulmonology) are displayed. These names are accompanied by various academic crests, shields, and institution-specific symbols, representing the diverse locations where her trainees established their careers by 1984. The illustration serves as a historical and biographical infographic within the field of pediatric pulmonology, highlighting the professional lineage and the 'growth' of a specific medical subspecialty through academic mentorship. It emphasizes the importance of educational legacy in the advancement of neonatal respiratory medicine.
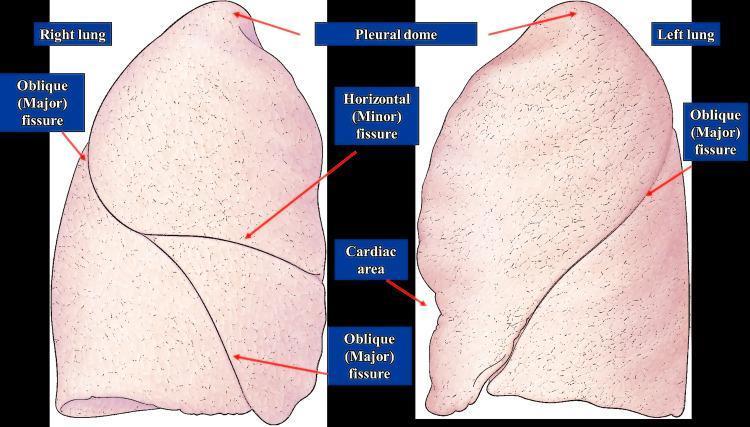
This anatomical diagram provides a lateral and medial perspective of the human right and left lungs, highlighting pulmonary lobar anatomy and surface landmarks. The right lung illustration demonstrates two fissures: the oblique (major) fissure, which runs diagonally, and the horizontal (minor) fissure, which branches anteriorly from the oblique fissure to separate the lung into three lobes (superior, middle, and inferior). The left lung illustration displays a single oblique (major) fissure, dividing it into two lobes (superior and inferior). Key anatomical features labeled include the 'Pleural dome' at the apex of both lungs and the 'Cardiac area'—a distinct indentation on the medial aspect of the left lung where the heart resides. The diagram effectively illustrates the morphological differences between the lungs, specifically the more complex fissural pattern of the right lung compared to the two-lobed structure of the left lung. This visual is designed for medical education regarding respiratory anatomy, thoracic landmarks, and surgical or diagnostic localization.
glycolysis pathway diagram ATP NADH steps
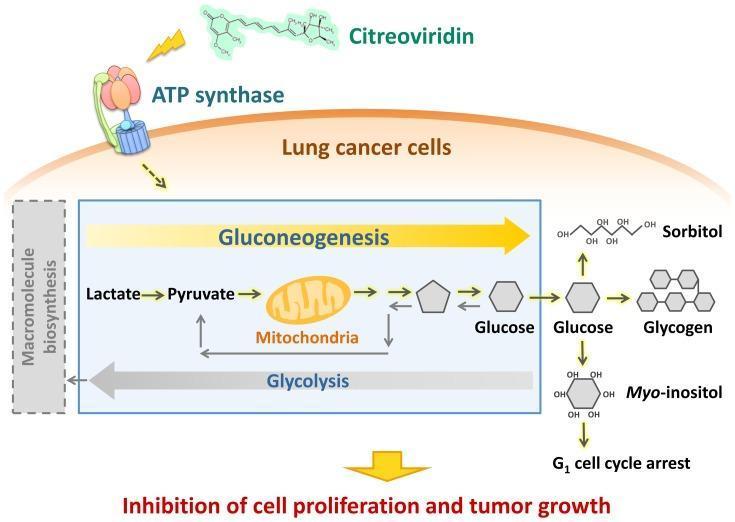
This pathophysiology diagram illustrates the metabolic reprogramming of lung cancer cells following inhibition of ATP synthase by Citreoviridin. The diagram highlights the interplay between gluconeogenesis (yellow arrow) and glycolysis (gray arrow). Gluconeogenesis is shown progressing from lactate and pyruvate through mitochondrial intermediates to produce glucose. This glucose is subsequently converted into downstream metabolites including sorbitol, glycogen, and myo-inositol. The diagram emphasizes that the production of myo-inositol is linked to G1 cell cycle arrest. Conversely, the glycolysis pathway, which normally feeds into lactate/pyruvate for macromolecule biosynthesis, is depicted as being modulated or bypassed. The overall educational focus is the metabolic shift from a proliferative state to one characterized by the inhibition of cell proliferation and tumor growth. Key components identified include ATP synthase, mitochondria, and specific biochemical end-products that influence the cell cycle.
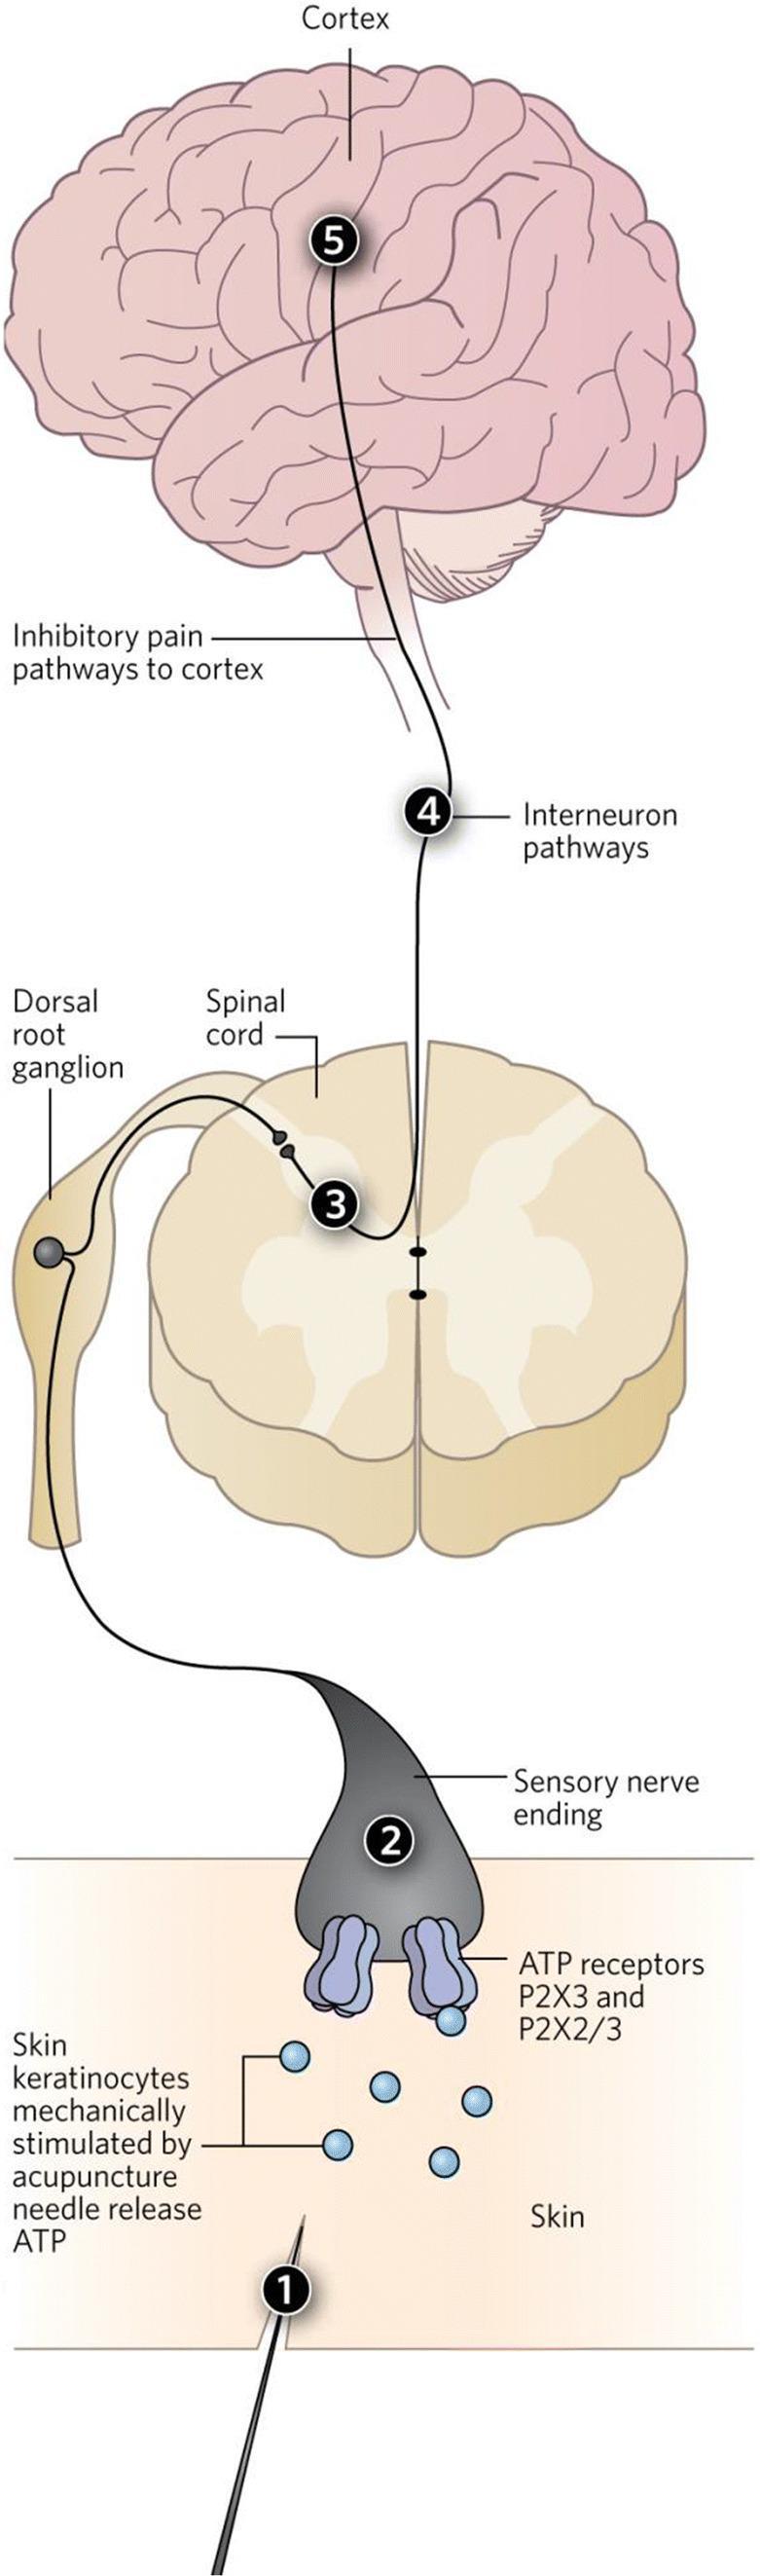
A pathophysiology diagram illustrating the purinergic hypothesis of acupuncture mechanisms, detailing the signal transduction pathway from skin to brain. The process is organized into six numbered steps: (1) An acupuncture needle mechanically stimulates skin keratinocytes to release ATP molecules (depicted as blue circles). (2) These ATP molecules bind to P2X3 and P2X2/3 receptors located on sensory nerve endings. (3) The initiated action potential travels via the dorsal root ganglion to the dorsal horn of the spinal cord. (4) The signal continues through ascending interneuron pathways. (5) The pathway reaches the cerebral cortex, specifically targeting pain centers. (6) Inhibitory pain pathways are shown projecting back to the cortex. Key anatomical structures depicted include the skin layers, peripheral sensory nerves, spinal cord cross-section with gray matter landmarks, and the gross anatomy of the brain and brainstem. This diagram serves as an educational tool for understanding neurobiological theories of pain modulation and the cellular response to mechanical acupuncture stimuli.
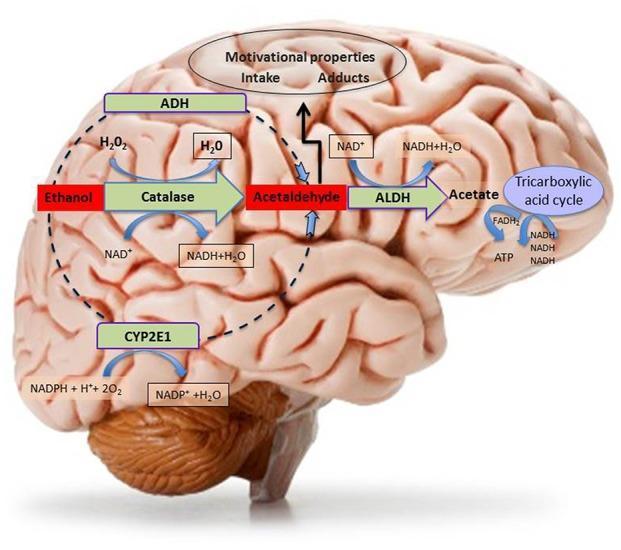
This medical illustration presents a pathophysiology diagram of the central metabolism of ethanol superimposed on a lateral view of the human brain. The diagram outlines three primary oxidative pathways for the conversion of ethanol to acetaldehyde within the CNS: 1) the Catalase pathway, requiring H2O2 and NAD+ co-factors; 2) the CYP2E1 (Cytochrome P450 2E1) pathway, involving NADPH and oxygen; and 3) the Alcohol Dehydrogenase (ADH) pathway. Acetaldehyde is subsequently metabolized into acetate by the enzyme Aldehyde Dehydrogenase (ALDH), a reaction coupled with the conversion of NAD+ to NADH. The resulting acetate enters the Tricarboxylic Acid (TCA) cycle to generate energy (ATP, NADH, FADH2). Additionally, the diagram illustrates the clinical significance of brain-generated acetaldehyde, indicating its role in motivational properties, ethanol intake, and the formation of adducts. This educational resource is designed to explain the biochemical basis of alcohol addiction and neurotoxicity, highlighting the regional metabolic processes that occur within brain tissue.
Krebs cycle TCA citric acid steps diagram
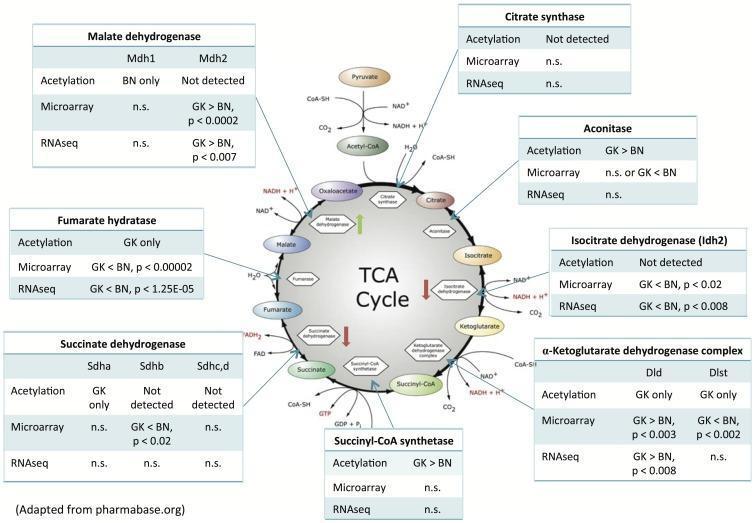
This pathophysiology diagram illustrates the integration of transcriptomic and proteomic data within the Tricarboxylic Acid (TCA) cycle, comparing diabetic Goto-Kakizaki (GK) and Brown Norway (BN) rat livers. The central circular diagram depicts the metabolic intermediates of the Krebs cycle, including Citrate, Isocitrate, Ketoglutarate, Succinyl-CoA, Succinate, Fumarate, Malate, and Oxaloacetate. Surrounding tables provide comparative data for key enzymes: Citrate Synthase, Aconitase, Isocitrate Dehydrogenase (Idh2), alpha-Ketoglutarate Dehydrogenase complex (Dld/Dlst), Succinyl-CoA synthetase, Succinate Dehydrogenase (Sdha/b/c/d), Fumarate Hydratase, and Malate Dehydrogenase (Mdh1/2). Each table details acetylation levels, microarray expression, and RNA sequencing results. Vertical arrows within the cycle indicate the impact of acetylation on enzyme activity: a green upward arrow for Malate Dehydrogenase denotes activation, while red downward arrows for Isocitrate Dehydrogenase and Succinate Dehydrogenase denote inhibition. This medical infographic serves as a model for systems-level analysis of metabolic regulation, specifically highlighting how post-translational modifications and mRNA expression levels differ in a diabetic state versus a control.
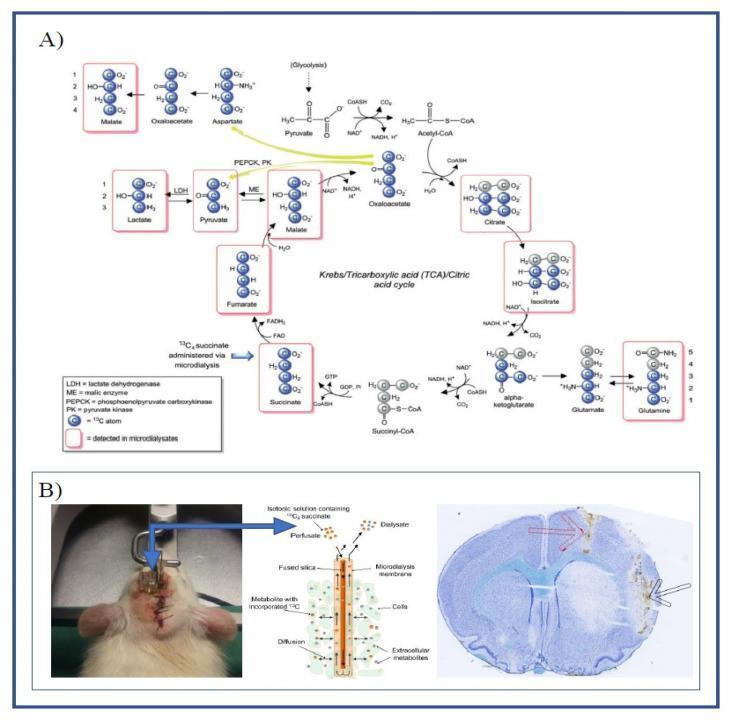
Educational composite detailing metabolic tracing and experimental neurology. Panel A features a Pathophysiology Diagram of the Tricarboxylic Acid (TCA) cycle, specifically illustrating the metabolic fate of 13C4-labeled succinate. Carbon atoms are represented as spheres, with blue-filled circles indicating the 13C label. The diagram tracks the label through cycle intermediates (fumarate, malate, oxaloacetate, citrate, isocitrate, alpha-ketoglutarate) and spin-out pathways leading to lactate, pyruvate, aspartate, glutamate, and glutamine. Red rectangular outlines highlight metabolites detectable via LC-MS analysis. Labeled enzymes include LDH, ME, PEPCK, and PK. Panel B demonstrates the Experimental Setup in a rat model of cerebral ischemia. It includes a Clinical Photograph of guide cannulas implanted in the left hemisphere, a schematic of a microdialysis catheter showing substrate diffusion across a semi-permeable membrane into brain tissue, and a Diagnostic Histology image (Nissl-stained cryosection). The histology shows the striatum with markers indicating the microdialysis catheter (black arrow) and ET-1 infusion site (red arrow), used to study mitochondrial function in vivo.
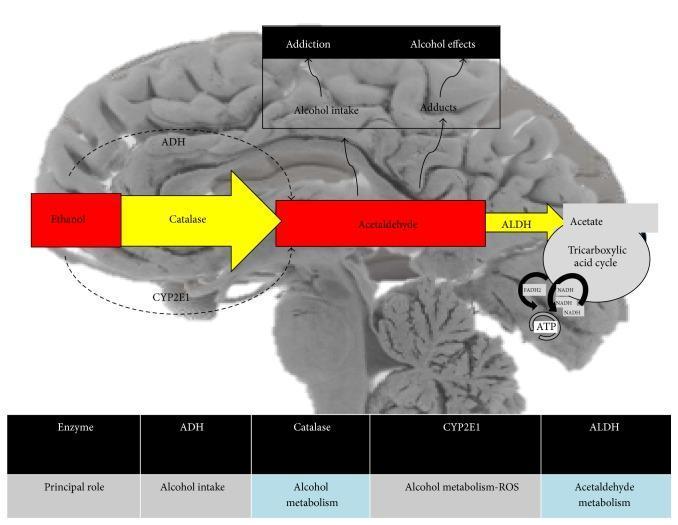
This pathophysiology diagram overlays the metabolic pathway of ethanol on a sagittal cross-section of a human brain. The illustration details the oxidative processes converting ethanol to acetaldehyde and subsequently to acetate. The primary pathway is facilitated by enzymes including Alcohol Dehydrogenase (ADH) and Catalase, represented by large yellow arrows, alongside the Cytochrome P450 2E1 (CYP2E1) system. Acetaldehyde is further processed by Aldehyde Dehydrogenase (ALDH) into acetate, which then enters the Tricarboxylic acid (TCA) cycle (Krebs cycle) to generate energy in the form of ATP, with associated cofactors NADH and FADH2. The diagram also highlights clinical associations with ethanol consumption in the brain, including 'Addiction,' 'Alcohol intake,' 'Alcohol effects,' and the formation of 'Adducts.' A supplementary table at the bottom summarizes the principal roles of the key metabolic enzymes: ADH (alcohol intake), Catalase (alcohol metabolism), CYP2E1 (alcohol metabolism and Reactive Oxygen Species/ROS generation), and ALDH (acetaldehyde metabolism). This educational resource illustrates the biochemical mechanisms of alcohol processing and neurobiological impact.
electron transport chain mitochondria ATP synthesis
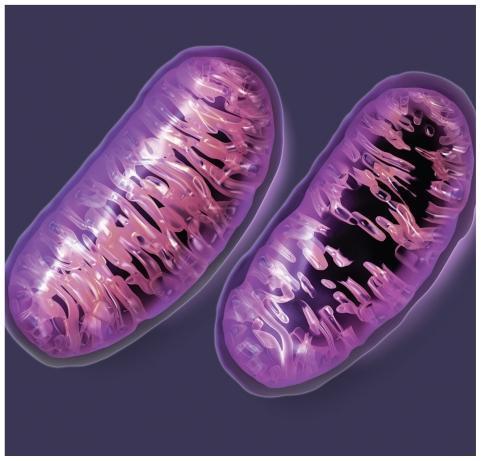
This anatomical diagram depicts the internal structure of two mitochondria, the primary organelles responsible for cellular energy production. The visualization highlights the distinctive double-membrane architecture essential for metabolic function. Each capsule-shaped organelle features a smooth outer membrane and a highly folded inner membrane, forming structures known as cristae. These looping, pink-to-purple-toned folds are shown occupying the majority of the internal matrix space, which is critical for increasing the surface area available for the electron transport chain and ATP synthesis. The illustration serves as an educational model for cellular biology, emphasizing normal mitochondrial morphology. It provides a visual baseline for understanding mitochondrial dysfunction, which is implicated in numerous conditions including metabolic disorders, neurodegenerative diseases like Alzheimer's and Parkinson's, and cardiovascular disease. The dark background and highlighting focus attention on the complex internal compartmentalization necessary for efficient oxygen and glucose conversion into cellular energy.
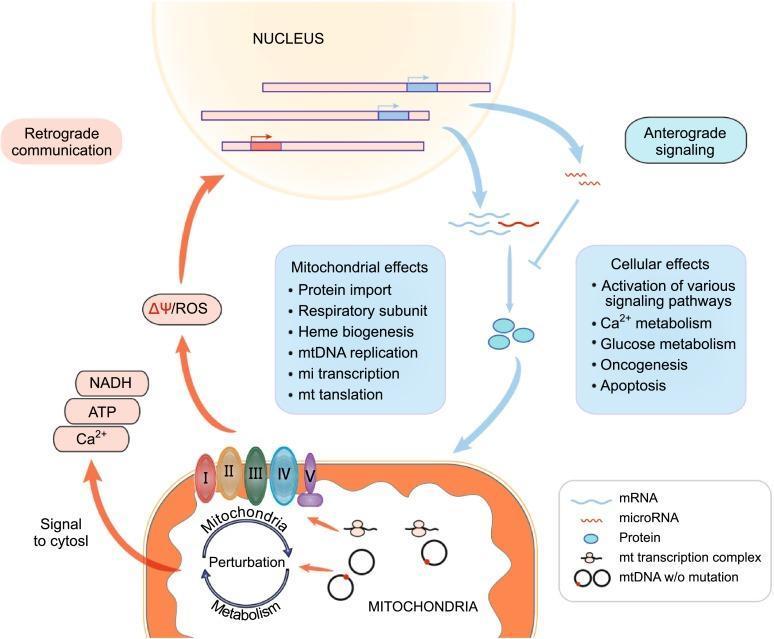
This pathophysiology diagram illustrates the bidirectional communication pathways between the mitochondria and the nucleus, known as anterograde and retrograde signaling. The mitochondria are depicted with their inner membrane housing the electron transport chain (complexes I-V) and internal circular mtDNA (with and without mutations) and transcription complexes. Retrograde communication is shown via red arrows, initiated by 'Metabolism Perturbation' and the release of 'Signal to Cytosol' molecules including NADH, ATP, Ca2+, and ΔΨ/ROS, which travel to the nucleus to influence gene expression. Anterograde signaling is represented by blue arrows, where nuclear gene products (mRNA, microRNA, and proteins) travel to the mitochondria or general cytosol. The diagram lists 'Mitochondrial effects' such as protein import, respiratory subunit regulation, and mtDNA replication, alongside 'Cellular effects' including metabolism modulation, oncogenesis, and apoptosis. This visual summary captures how mitochondrial dysfunction and oxidative stress trigger nuclear responses to maintain cellular homeostasis or drive pathological processes.
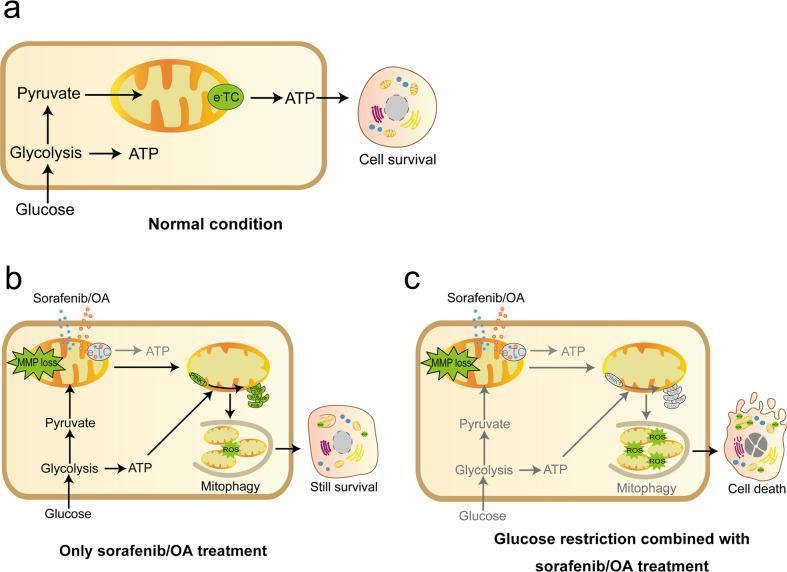
This pathophysiology diagram illustrates the metabolic mechanisms and survival outcomes of hepatocellular carcinoma (HCC) cells under three different experimental conditions. Panel A (Normal condition) shows healthy cellular metabolism where glucose enters the cell, undergoing glycolysis to produce ATP and pyruvate. Pyruvate enters the mitochondria, powering the electron transport chain (eTC) for further ATP generation, resulting in cell survival. Panel B (Only sorafenib/OA treatment) depicts the effect of electron transport chain inhibitors (sorafenib or oligomycin/antimycin). This treatment causes mitochondrial membrane potential (MMP) loss and impairs mitochondrial ATP production. However, glycolysis remains active, generating sufficient ATP to support PINK1-mediated mitophagy. Mitophagy eliminates damaged mitochondria and prevents reactive oxygen species (ROS) accumulation, allowing continued cell survival. Panel C (Glucose restriction combined with sorafenib/OA treatment) demonstrates the synergistic effect of inhibiting both energy pathways. Glucose restriction abolishes glycolysis-derived ATP, which in turn prevents the activation of mitophagy despite mitochondrial damage. This leads to excessive ROS accumulation, extensive mitochondrial failure, and clinical cell death. This diagram highlights the importance of targeting dual metabolic pathways in HCC therapy.
alveolar gas exchange oxygen diffusion capillary
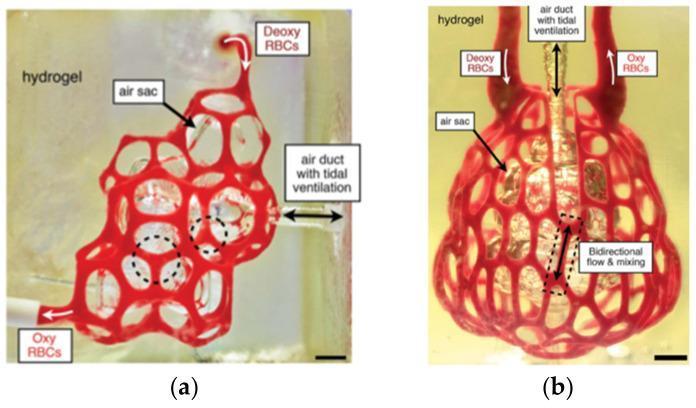
This figure presents two clinical research photographs of 3D bioprinted hydrogel models designed for pulmonary research. Image (a) depicts a printed alveolar model mimicking human air sacs and the surrounding vascular network. The model is perfused with red blood cells (RBCs), showing oxygenated RBCs (Oxy RBCs) entering the capillary-like network at the bottom and deoxygenated RBCs (Deoxy RBCs) exiting at the top. An air duct with tidal ventilation is laterally connected to the internal air sac. Dotted circles indicate points of RBC vessel compression by the inflated airway. Image (b) shows a printed distal lung subunit with a vertically oriented air duct. The complex vascular architecture surrounds a central air sac, with arrows indicating the directional flow of oxygenated and deoxygenated RBCs. A labeled region in the lower portion highlights bidirectional flow and mixing, illustrating the dynamic gas exchange environment. These PEGDA-assisted models serve as functional biomaterial platforms for studying respiratory pathophysiology and oxygen diffusion in complex vascular geometries. Scale bars represent 1 mm.
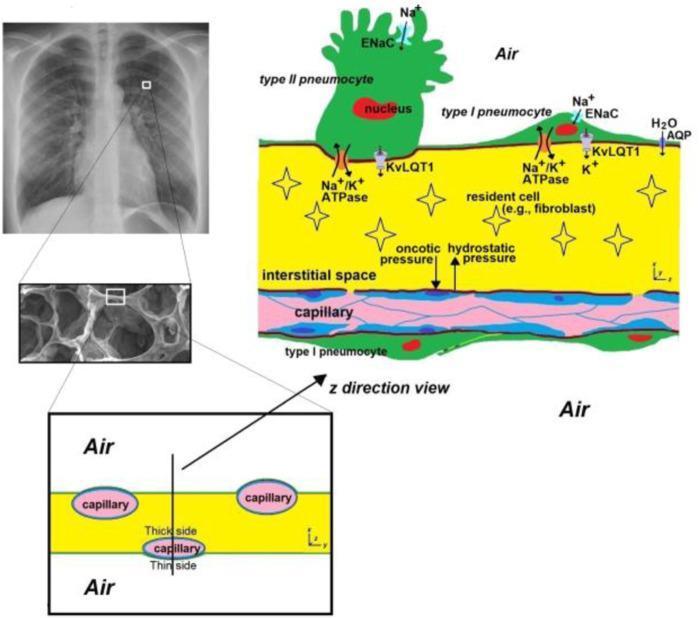
This composite educational graphic details the microanatomy of the human alveolar septa, combining a posterior-anterior chest radiograph, a microscopic view of lung parenchyma, and detailed pathophysiology schematics. The primary diagram illustrates the alveolar-capillary barrier, distinguishing between the 'thin side' optimized for gas exchange (where the epithelium and endothelium share a basal lamina) and the 'thick side' containing the interstitial space, extracellular matrix, and resident cells like fibroblasts. Key cellular components are depicted: cuboidal Type II pneumocytes with surfactant-secreting potential and thin, squamous Type I pneumocytes. The schematic identifies essential membrane proteins involved in fluid regulation and ion transport, including ENaC (sodium channels), Na+/K+ ATPase pumps, KvLQT1 (potassium channels), and AQP (aquaporins). Vectors demonstrate Starling forces, specifically oncotic and hydrostatic pressures, acting across the capillary wall. This visual is designed for advanced medical education in respiratory physiology, focusing on the structural heterogeneity of the alveolar wall and the mechanisms of fluid homeostasis and gas diffusion.
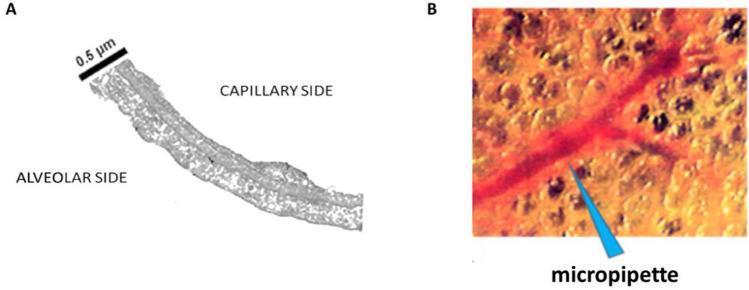
This figure illustrates the functional anatomy and experimental study of the pulmonary gas exchange interface. Panel A is a high-magnification electron micrograph cross-section of the thin portion of the human air-blood barrier. It demonstrates the structural juxtaposition of the 'Alveolar Side' and 'Capillary Side,' separated by an ultrathin fused basement membrane. A scale bar indicates a thickness of approximately 0.5 ̇μm, highlighting the specialized morphology required for efficient passive gas diffusion. Panel B presents an in vivo trans-pleural diagnostic image showing the pulmonary microvascular network. The microvessels appear as a branching red vascular structure embedded within the brownish-orange alveolar parenchymal tissue. A blue arrow identifies a micropipette positioned to puncture the peri-microvascular interstitial space, an experimental technique used to measure pulmonary interstitial pressure (Pi). Collectively, these panels demonstrate the delicate balance of the Starling forces and the structural vulnerability of the respiratory membrane in conditions like pulmonary edema.
Hlo ye nhi fefde wala exchange of gaese , breathing wala
breathing mechanism inspiration expiration diaphragm intercostal muscles
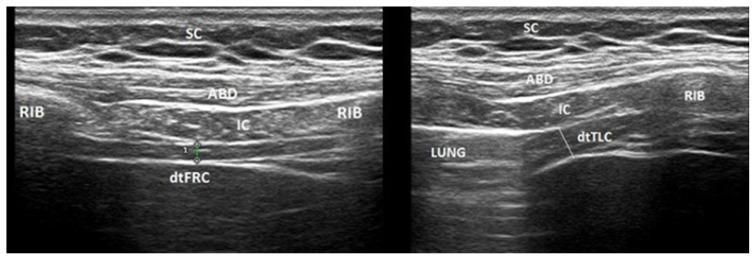
This diagnostic B-mode ultrasound side-by-side comparison illustrates the assessment of diaphragmatic thickness and contractility in a human subject. The images show a longitudinal view of the zone of apposition, typically between the 8th and 9th intercostal spaces. Layers from superficial to deep include subcutaneous tissue (SC), abdominal muscles (ABD), and intercostal muscles (IC) situated between the ribs (RIB), which present with characteristic hyperechoic surfaces and posterior acoustic shadowing. The diaphragm is visualized as a distinct three-layered structure: a hypoechoic muscular core bordered by two hyperechoic lines representing the pleural and peritoneal fascia. The left image demonstrates the diaphragm at Functional Residual Capacity (dt FRC) during end-expiration. The right image shows the diaphragm at Total Lung Capacity (dt TLC) during maximal inspiration, where the muscle appears significantly thicker due to contraction. In the inspiration view, the hyperechoic lung signal is visible as it descends into the costophrenic angle. This imaging technique is utilized in pulmonary and rehabilitation medicine to evaluate diaphragmatic function, atrophy, or paralysis.
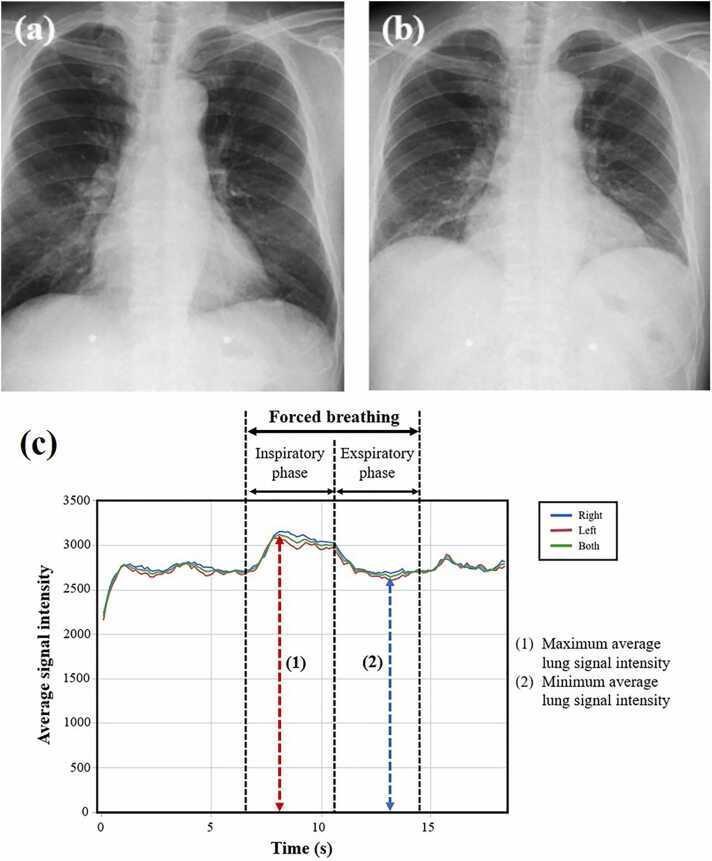
This composite educational material demonstrates Dynamic Digital Radiography (DDR) findings in a 75-year-old male with mild COPD. (a) Posterior-anterior (PA) chest radiograph during forced inspiration shows increased lung volume, wider intercostal spaces, and a depressed diaphragm, corresponding to maximum lung signal intensity (SImax = 3113.7). (b) PA chest radiograph during forced expiration shows decreased lung volume and elevated diaphragm position, corresponding to minimum signal intensity (SImin = 2635.0). (c) A temporal graph plots average lung signal intensity over 20 seconds of breathing. The 'Forced breathing' segment is subdivided into an 'Inspiratory phase'—where signal intensity rises to a peak at approximately 8 seconds (1)—and an 'Expiratory phase'—where intensity falls to a trough at approximately 14 seconds (2). Separate lines track the right, left, and combined lung intensities. This visual illustrates how DDR quantifies ventilatory function by tracking changes in radiographic density (signal intensity) as air volume fluctuates, providing a dynamic assessment of obstructive lung disease.
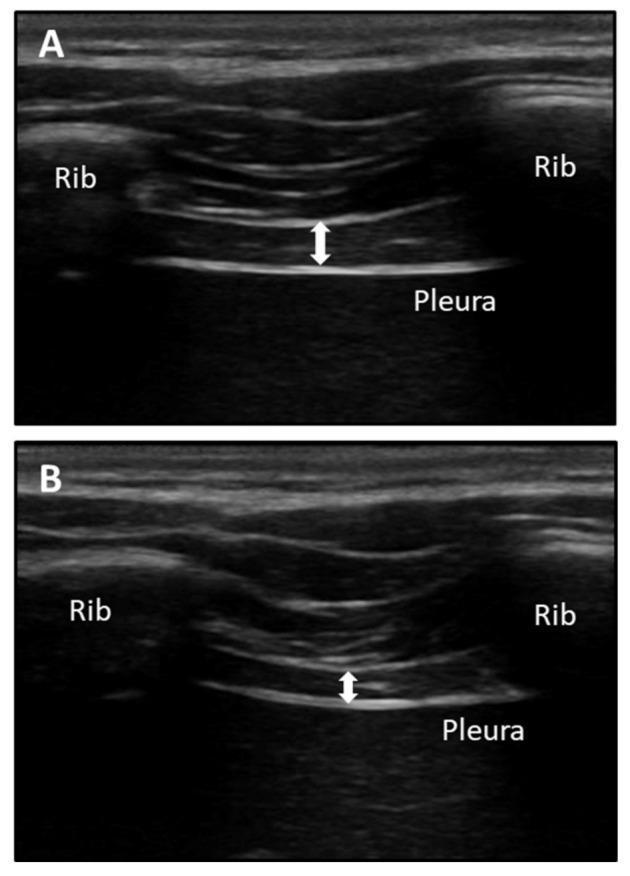
This diagnostic B-mode ultrasound comparison demonstrates the assessment of diaphragm thickness through the last intercostal space (mid-axillary line between the 11th and 12th ribs). Image A displays the diaphragm at maximum inspiration (Tins), while Image B shows it at maximum expiration (Texp). Anatomical landmarks include the hyperechoic ribs on either side of the intercostal window and the bright, hyperechoic linear interface representing the pleura at the deep margin. The diaphragm muscle is visualized between the superficial perimuscular connective tissue and the deep pleura, characterized by mixed echogenicity with hypoechoic muscular tissue and hyperechoic fascial boundaries. White double-headed arrows indicate the specific measurement zone for diaphragm thickness. The comparison illustrates the physiological thickening of the muscle during inspiration (A) compared to its thinner state during expiration (B). This technique is relevant in physical therapy and critical care for evaluating respiratory muscle function and diaphragm atrophy or excursion.
lung volumes capacities spirometry tidal volume vital capacity diagram NEET
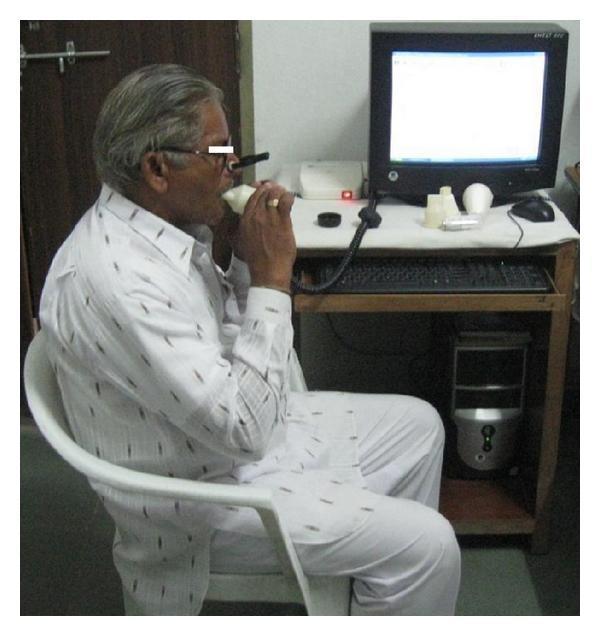
A clinical photograph illustrating a patient performing a Pulmonary Function Test (PFT) via spirometry in a clinical or research setting. The image depicts an older adult male seated upright, wearing a nose clip to ensure mouth-only breathing. He is actively interacting with a handheld spirometer, holding the disposable mouthpiece with both hands to maintain a tight seal. The device is connected via a data cable to a computer system, which includes a monitor displaying an active interface, likely for real-time visualization of flow-volume loops and spirograms. On the desk, several replacement white cylindrical mouthpieces and the hardware interface are visible. This visual serves as an educational example of the standardized setup for measuring lung volumes and ventilation capacities, such as Forced Vital Capacity (FVC) and Forced Expiratory Volume in 1 second (FEV1), highlighting the necessary equipment and proper patient positioning during the procedure.
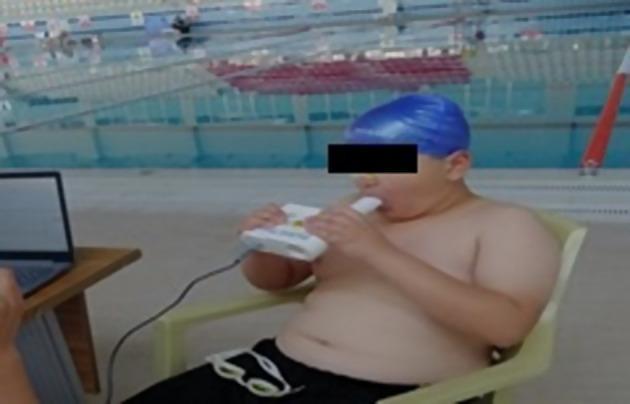
This clinical photograph illustrates the performance of a pulmonary function test, specifically Forced Vital Capacity (FVC) measurement, in an aquatic sports setting. A young male subject, wearing a blue swimming cap and dark shorts, is seated while performing spirometry. He is using a handheld digital spirometer (Pocket Spiro USB-100), gripping the white device with both hands. The subject’s lips are tightly sealed around a disposable cylindrical mouthpiece, and a nose clip is applied to ensure isolated oral expiration. A data cable connects the spirometer to a laptop on a nearby table, indicating real-time data acquisition and flow-volume loop analysis. The background shows a swimming pool environment, suggesting clinical research into the respiratory physiology of swimmers or the impact of aquatic training on lung volumes. This image serves as an educational example of portable spirometry application and proper patient positioning for diagnostic respiratory maneuvers outside a traditional lab setting.
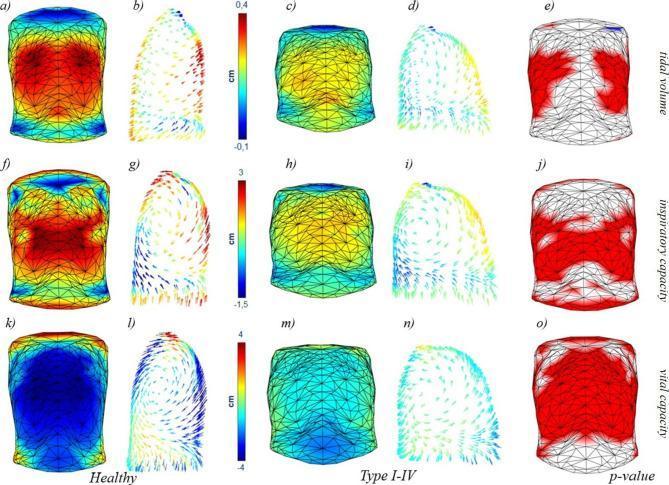
This medical comparison chart utilizes 3D optoelectronic plethysmography data to visualize chest wall dynamics in healthy subjects and patients with Osteogenesis Imperfecta (OI) Types I-IV. The figure is organized into three rows representing different respiratory maneuvers: Tidal Volume (VT), Inspiratory Capacity (IC), and Vital Capacity (VC). Columns display three-dimensional colormaps of surface displacement, arrow plots of motion vectors, and statistical p-value maps. The colormaps (a, f, k for healthy; c, h, m for OI) use a warm-to-cool scale to quantify displacement in centimeters, where red indicates expansion and blue indicates inward movement or less displacement. Healthy subjects demonstrate robust, symmetrical ribcage expansion during inspiration, whereas OI patients exhibit reduced magnitude and altered displacement patterns, particularly in the lower thorax. The arrow plots (b, g, l for healthy; d, i, n for OI) depict the direction and magnitude of trunk motion, highlighting the more vertical and less outward chest wall trajectory in OI patients. Statistical maps (e, j, o) use red to signify regions where healthy subjects have significantly greater average displacement compared to OI Type I-IV patients (p < 0.05), emphasizing widespread respiratory mechanics impairment in the clinical group across all lung volumes.
🫁 Class 11 - Chapter 17: Breathing and Exchange of Gases
NEET ke liye Complete Notes (Hindi + English)
📌 TOPIC 1: Human Respiratory System - Parts
Naak → Pharynx → Larynx → Trachea → Bronchi → Bronchioles → Alveoli
| Part | Kaam |
|---|---|
| Nasal cavity | Air filter, warm & moisten karta hai |
| Larynx | Voice box - vocal cords hote hain |
| Trachea | C-shaped cartilage rings hote hain (16-20), collapse nahi hone deta |
| Bronchi | 2 - Left aur Right (Right thoda seedha aur bada hota hai) |
| Alveoli | ~300 million - actual gas exchange yahan hota hai |
NEET Trick: Right bronchus LEFT se zyada wide aur short hota hai - isliye foreign objects right mein zyada jaate hain!
📌 TOPIC 2: Breathing Mechanism (Sabse Important!)
🔵 INSPIRATION (Saans andar lena) - ACTIVE PROCESS
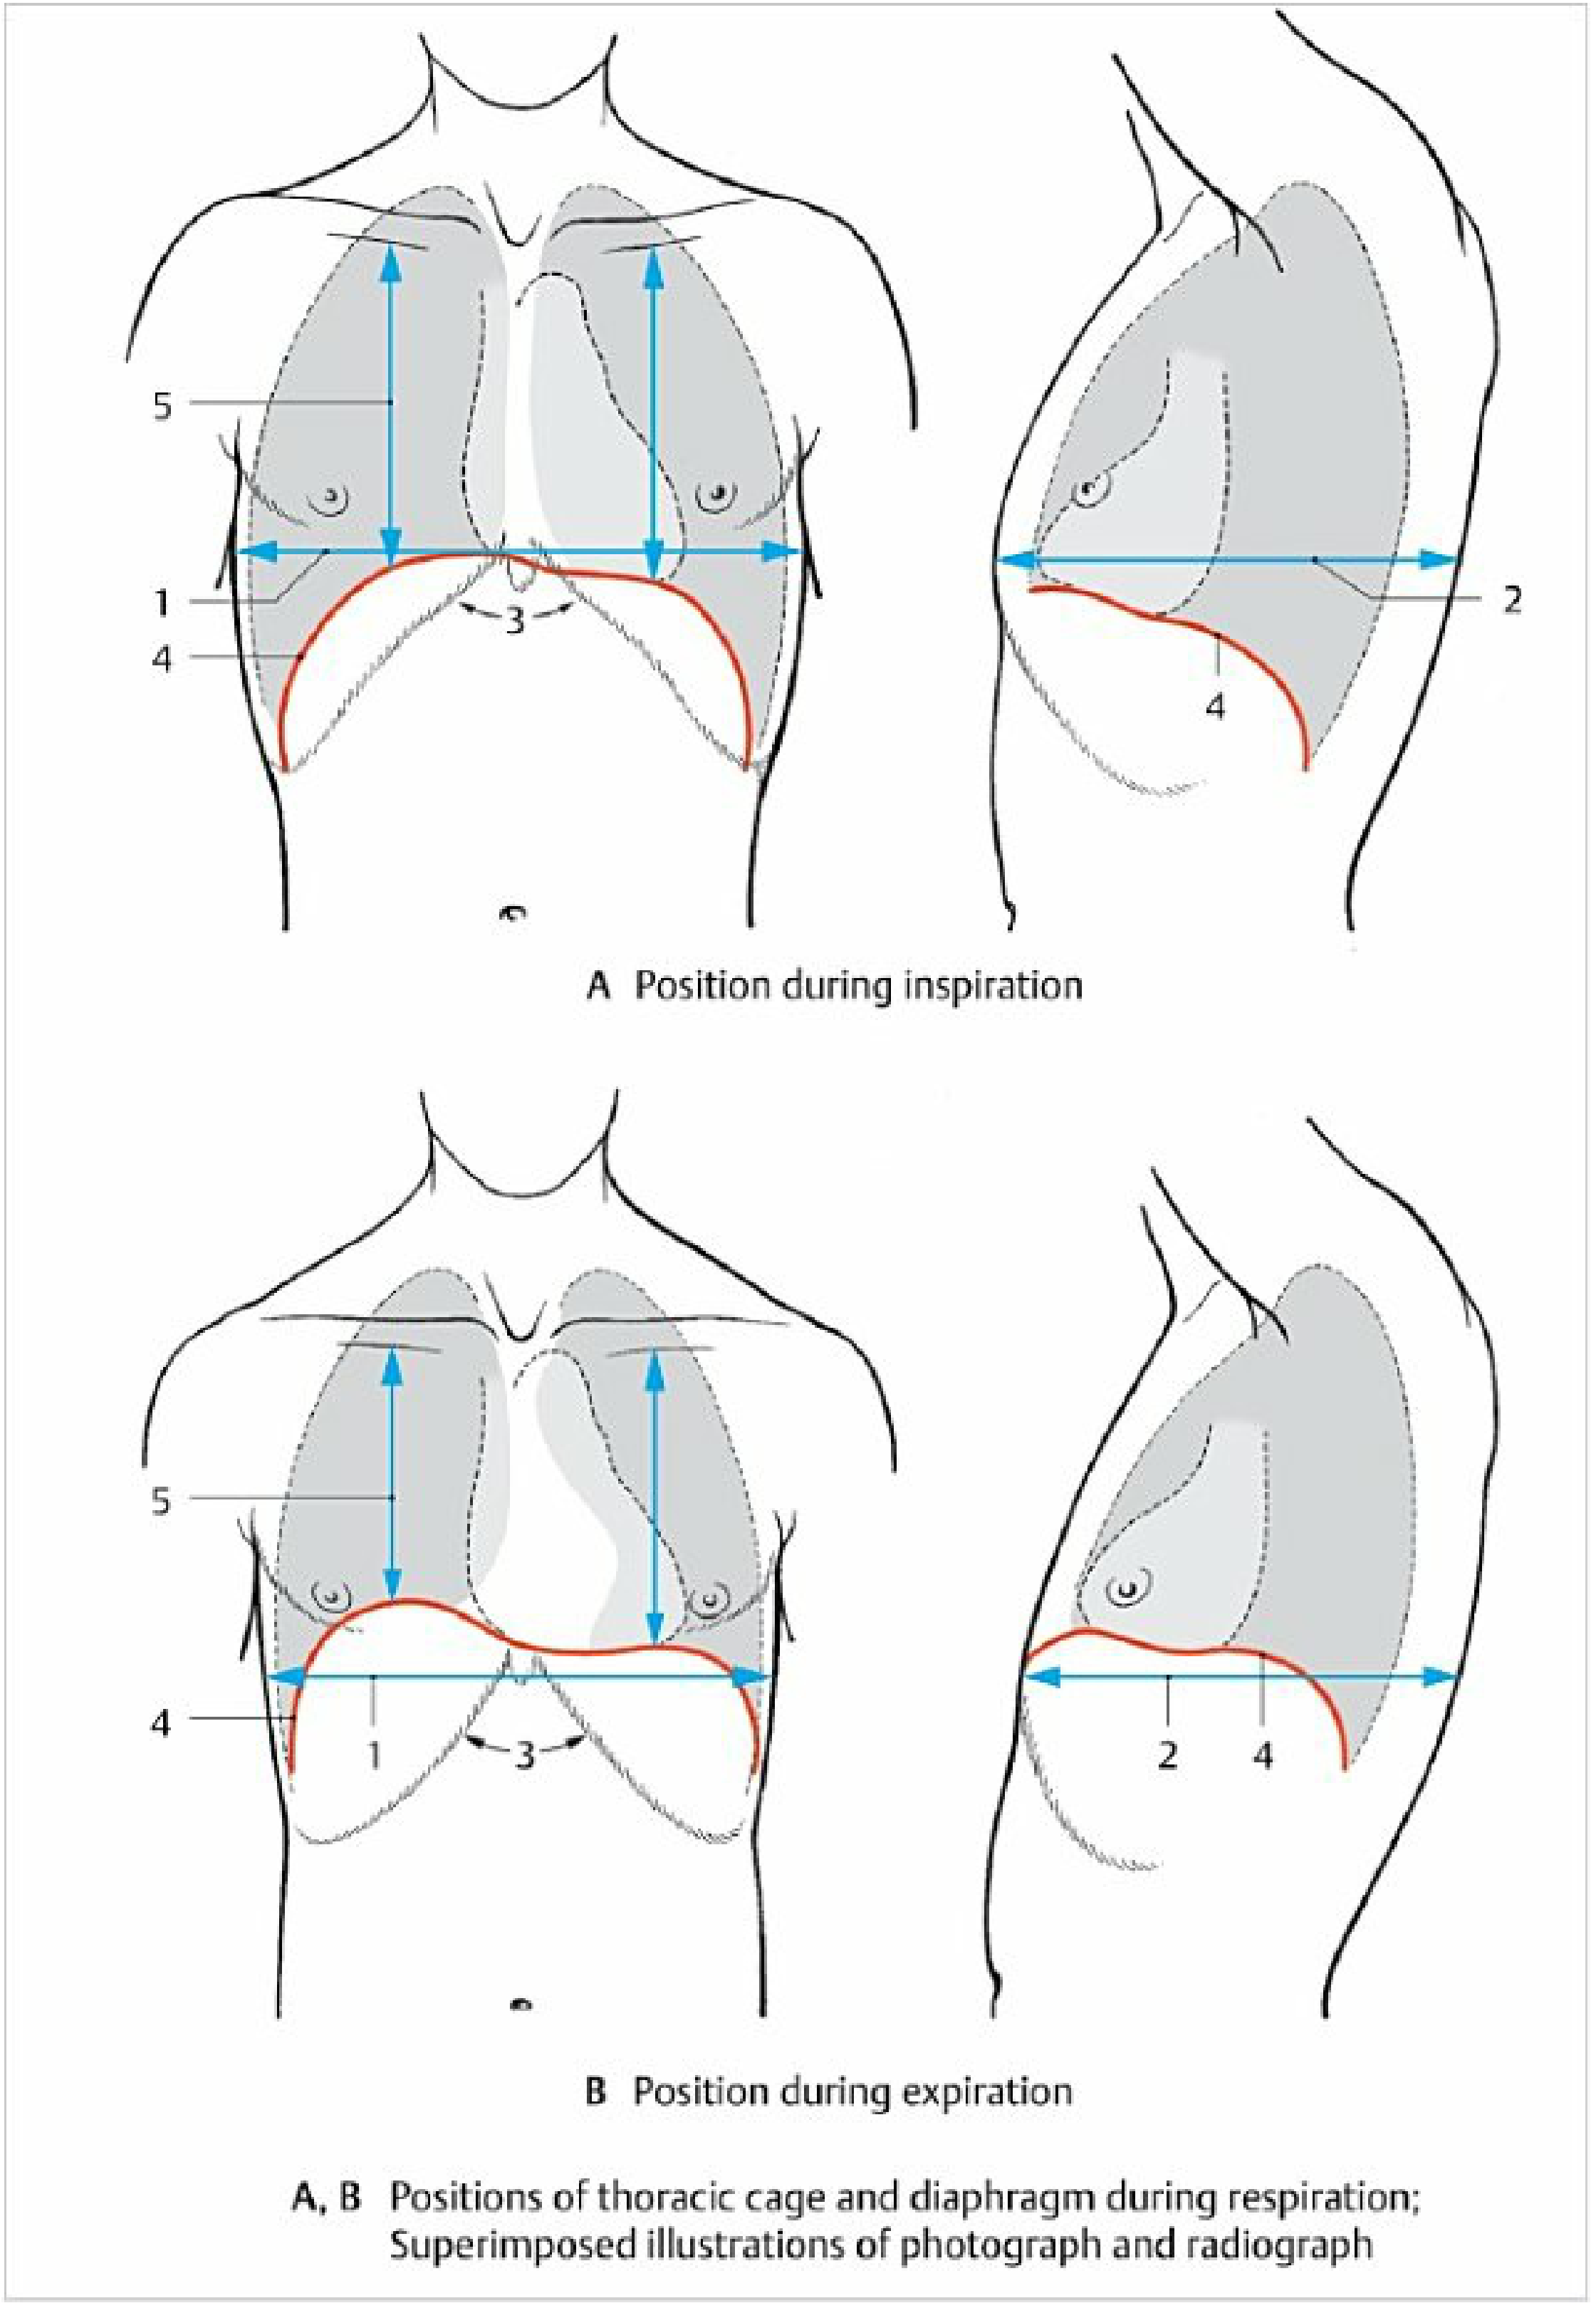
- Diaphragm contract karta hai → Flat ho jaata hai → Thoracic cavity ka vertical diameter ↑
- External intercostal muscles contract karte hain → Ribs upar-bahar jaati hain → Thoracic cavity ka horizontal + anteroposterior diameter ↑
- Thoracic volume ↑ → Intrapleural pressure (-5 cmH₂O se -8 cmH₂O ho jaata hai)
- Lung stretch hote hain → Intrapulmonary pressure atmospheric se neeche girta hai
- Pressure difference ban jaata hai → Bahar se hawa andar aati hai
🔴 EXPIRATION (Saans bahar nikalna) - PASSIVE PROCESS (normally)
- Diaphragm aur external intercostal muscles relax karte hain
- Elastic recoil se lungs chhote hote hain
- Intrapulmonary pressure atmospheric se upar ho jaata hai
- Hawa bahar nikal jaati hai
NEET Point: Normal expiration PASSIVE hoti hai (koi muscle energy nahi lagti). Forced expiration mein internal intercostal muscles aur abdominal muscles use hote hain!
📌 TOPIC 3: Lung Volumes & Capacities ⭐⭐⭐ (Bohot Questions Aate Hain!)
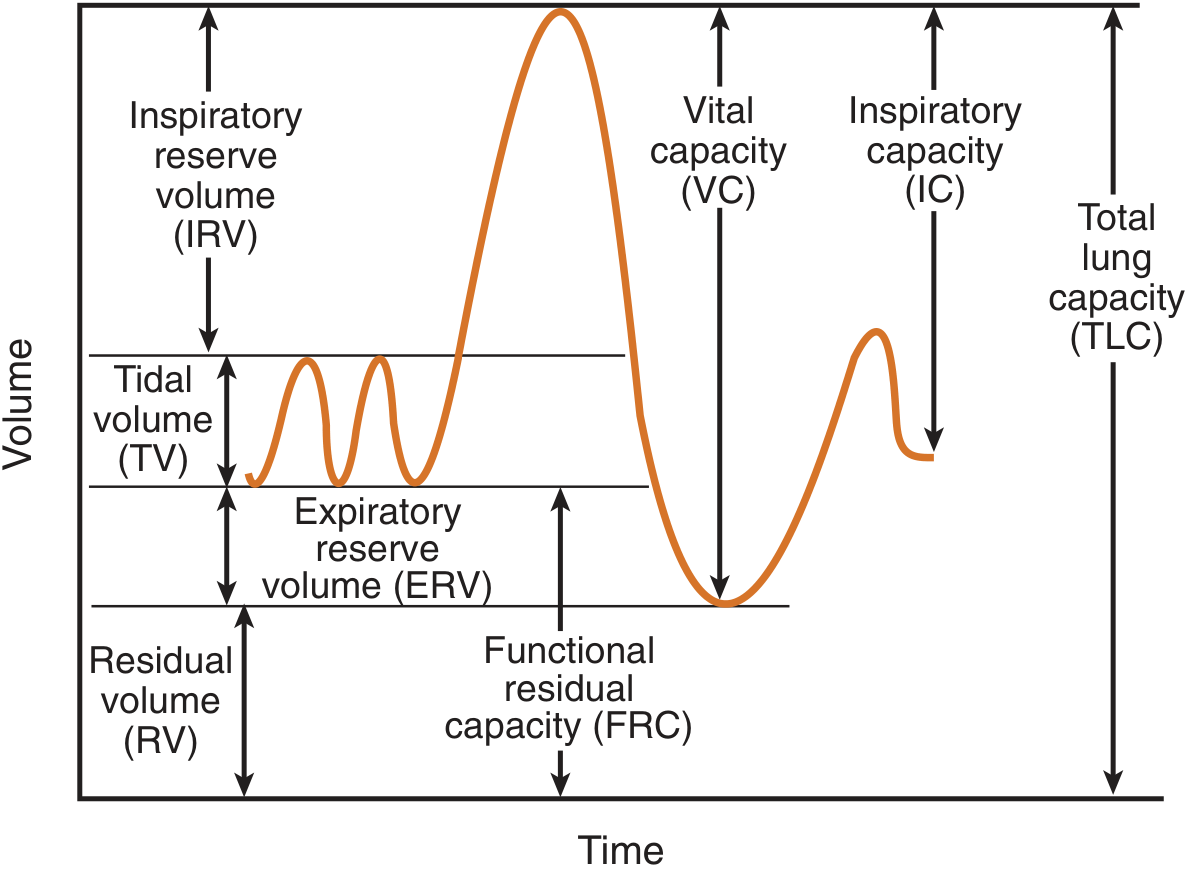
Volumes (4 volumes - overlap nahi karte):
| Volume | Full Name | Normal Value | Kya Hai |
|---|---|---|---|
| TV | Tidal Volume | 500 mL | Normal ek saans mein andar-bahar hawa |
| IRV | Inspiratory Reserve Volume | 2500-3000 mL | TV ke baad aur kuch andar le sako |
| ERV | Expiratory Reserve Volume | 1000-1200 mL | Normal expiration ke baad aur nikal sako |
| RV | Residual Volume | 1100-1200 mL | Lungs mein hamesha bacha rehta hai |
⚠️ RV spirometer se measure NAHI hota! Helium dilution ya body plethysmograph se measure karte hain.
Capacities (2 ya zyada volumes ka sum):
| Capacity | Formula | Value | Trick |
|---|---|---|---|
| IC (Inspiratory Capacity) | TV + IRV | ~3500 mL | Kitna andar le sakte hain |
| FRC (Functional Residual Capacity) | ERV + RV | ~2400 mL | Normal expiration ke baad lungs mein kitna |
| VC (Vital Capacity) | IRV + TV + ERV | ~4600-4800 mL | Max bahar nikaalne ki capacity |
| TLC (Total Lung Capacity) | VC + RV | ~5800-6000 mL | Lungs mein total max volume |
🧠 NEET Memory Trick:
TLC = TV + IRV + ERV + RV
VC  = TV + IRV + ERV   (RV nahi!)
FRC =           ERV + RV  (Expiration ke baad bacha)
IC  = TV + IRV          (Inspiration ki capacity)
📌 TOPIC 4: Breathing Rate & Minute Volume
| Term | Value |
|---|---|
| Normal breathing rate | 12-16 breaths/min |
| Tidal Volume | 500 mL |
| Minute Volume | TV × Rate = 500 × 12 = 6000 mL/min = 6 L/min |
📌 TOPIC 5: Exchange of Gases (Diffusion)
Alveoli mein gas exchange kyon efficient hota hai?
- ~300 million alveoli hote hain
- Total surface area ~70-80 sq meters (ek tennis court!)
- Alveolar wall bahut thin hoti hai
- Type I pneumocytes - thin wall for diffusion
- Type II pneumocytes - surfactant banate hain (surface tension kam karta hai, alveoli collapse nahi hote)
Partial Pressure Gradient (Diffusion ka driver):
| Gas | Alveolar Air | Deoxygenated Blood (entering) | Result |
|---|---|---|---|
| O₂ | 104 mmHg | 40 mmHg | O₂ blood mein jaata hai ↓ |
| CO₂ | 40 mmHg | 45 mmHg | CO₂ alveoli mein aata hai ↑ |
NEET Trick: CO₂ ki diffusion capacity O₂ se 20-25x zyada hoti hai (zyada soluble hai) - isliye CO₂ exchange ka koi problem nahi hota normally!
📌 TOPIC 6: Transport of Gases in Blood ⭐
Oxygen Transport:
- 97% - Hemoglobin se bound = Oxyhemoglobin (HbO₂)
- 3% - Plasma mein dissolved
Hb + O₂ ⇌ HbO₂
- 1 Hb molecule = 4 O₂ carry kar sakta hai (4 heme groups)
- Normal Hb = 12-16 g/dL
CO₂ Transport:
| Method | % |
|---|---|
| Bicarbonate ions (HCO₃⁻) as | 70% ← Sabse zyada! |
| Carbaminohemoglobin (HbCO₂) | 23% |
| Dissolved in plasma | 7% |
📌 TOPIC 7: Respiratory Disorders (NEET mein aate hain!)
| Disorder | Kya hota hai | Key Point |
|---|---|---|
| Asthma | Bronchioles mein spasm | Wheezing, reversible |
| Emphysema | Alveolar walls destroy | Smoking se, barrel chest |
| Pneumonia | Alveoli mein fluid/pus | Streptococcus pneumoniae |
| Bronchitis | Bronchi mein inflammation | Mucus zyada, persistent cough |
| Occupational Respiratory Diseases | Dust inhalation | Silicosis, Asbestosis |
⭐ NEET PYQ-Type Important Points:
- Breathing = PHYSICAL process | Respiration = BIOCHEMICAL process (cellular)
- Diaphragm ka contraction → Inspiration (ACTIVE)
- Normal expiration → PASSIVE (no muscle energy)
- RV spirometer se measure nahi hota
- VC = TLC - RV
- CO₂ transport mostly as bicarbonate (70%)
- Surfactant - Type II pneumocytes banate hain - DPPC (Dipalmitoylphosphatidylcholine)
- O₂ dissociation curve - Sigmoidal shape (Hb cooperativity ke wajah se)
- Bohr effect - CO₂ ↑ ya pH ↓ → Hb ka O₂ affinity ↓ (O₂ release hota hai tissues mein)
- Eupnea = normal breathing | Apnea = breathing stop | Dyspnea = difficult breathing