
10 common heart disease with Images with ecg paper from all lead step by step withing 1 min
Reading File
Now let me search the medical library and web in parallel for ECG images of common heart diseases.
Finding Sources
Searching the Web
10 common heart diseases ECG findings all leads images guide
Finding Sources
Loading Image
Finding Sources
Searching the Web
12 lead ECG examples STEMI atrial fibrillation heart block ventricular tachycardia images labeled
Loading Image
Finding Sources
Searching the Web
ECG site:ecglibrary.com OR site:litfl.com common cardiac conditions all 12 leads labeled diagram
Loading Image
Reading Web Page
https://litfl.com/ecg-library
Loading Image
Searching the Web
ECG 12 lead STEMI inferior anterior lateral atrial fibrillation heart block WPW pericarditis labeled images litfl
Loading Image
Loading Image
Searching the Web
site:litfl.com ECG atrial fibrillation ventricular tachycardia complete heart block WPW 12 lead image
Loading Image
Loading Image
Now I have excellent ECG images. Let me compile the comprehensive guide with all 10 conditions, ECG images, and detailed lead-by-lead findings.
10 Common Heart Diseases - ECG Guide (All 12 Leads)
ECG Anatomy & Lead Reference
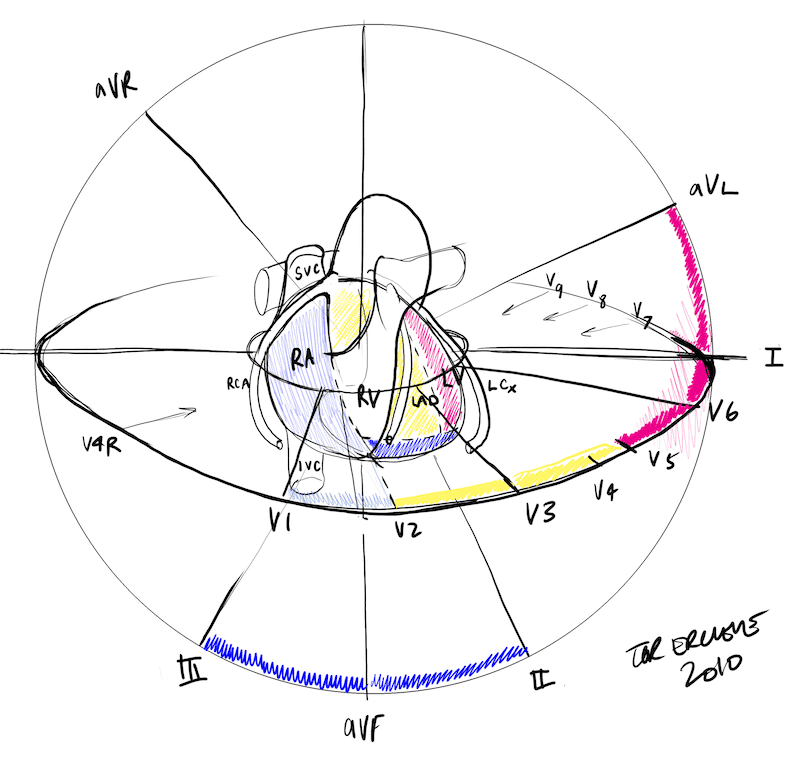
This master diagram shows which leads correspond to which coronary artery territory - essential for localizing infarctions.
1. Normal Sinus Rhythm (Baseline Reference)
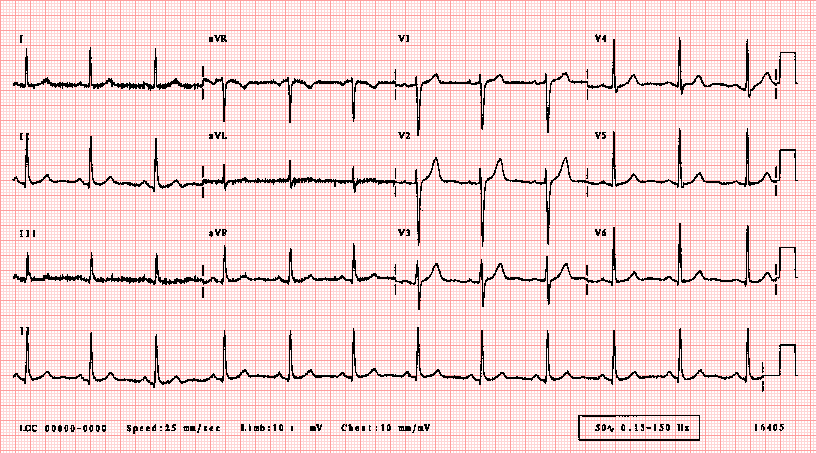
Rate: 60-100 bpm | Rhythm: Regular
| Lead Group | Findings |
|---|---|
| I, II, III | Upright P waves before every QRS |
| aVR | Negative P wave (normal) |
| aVL, aVF | Small upright P waves |
| V1-V2 | Small r wave, deep S wave |
| V3-V6 | Progressive R wave growth (R wave progression) |
| PR interval | 120-200 ms (3-5 small squares) |
| QRS | <120 ms (narrow) |
| QT | <440 ms in men, <460 ms in women |
2. Inferior STEMI (ST-Elevation Myocardial Infarction)
Culprit vessel: Right Coronary Artery (RCA) in ~80% of cases

Lead-by-lead step-by-step:
| Lead | Finding |
|---|---|
| II, III, aVF | ST elevation ≥1mm (diagnostic territory) - the classic inferior leads |
| I, aVL | Reciprocal ST depression - mirror image of III; aVL is exact inverse of lead III |
| V1-V3 | May show ST depression (posterior extension); check V4R for RV involvement |
| V4R | ST elevation ≥1mm = right ventricular MI (occurs in 40% of inferior STEMI) |
| V5-V6 | ST elevation here means extensive disease and worse prognosis |
| aVR | Typically ST depression |
Key rule: ST elevation in III > II suggests RCA occlusion. aVL reciprocal change is the most sensitive sign.
3. Anterior STEMI
Culprit vessel: Left Anterior Descending artery (LAD)
Lead-by-lead findings:
| Lead | Finding |
|---|---|
| V1-V4 | ST elevation (V2-V3 most prominent; criteria: ≥2mm in men, ≥1.5mm in women) |
| V5-V6, I, aVL | May show lateral ST elevation if ostial/proximal LAD occlusion |
| II, III, aVF | Reciprocal ST depression (if large anterior/proximal occlusion) |
| aVR | ST elevation in aVR + diffuse depression = left main coronary artery (LMCA) occlusion |
| V1-V2 | "Tombstone" pattern (massive STE) = proximal LAD, worst prognosis |
Hyperacute T waves (tall, bulky, asymmetric) appear within minutes - earliest ECG sign.
4. Atrial Fibrillation (AF)
The most common sustained arrhythmia
Lead-by-lead findings:
| Lead | Finding |
|---|---|
| All leads | Irregularly irregular R-R intervals - no two complexes the same distance apart |
| II, V1 | Absent P waves - replaced by chaotic fibrillatory "f" waves (350-600/min) |
| V1 | Fibrillatory waves may be most visible here (coarse vs. fine AF) |
| All leads | QRS complexes are usually narrow (unless aberrant conduction or pre-existing BBB) |
| Rate | Uncontrolled: 100-180 bpm; Controlled: 60-100 bpm |
Rate: Irregularly irregular with no discernible P waves is the diagnostic pattern. Coarse AF shows visible f-waves; fine AF may appear as flat baseline.
5. Complete Heart Block (3rd Degree AV Block)
AV node completely fails to conduct - atria and ventricles beat independently
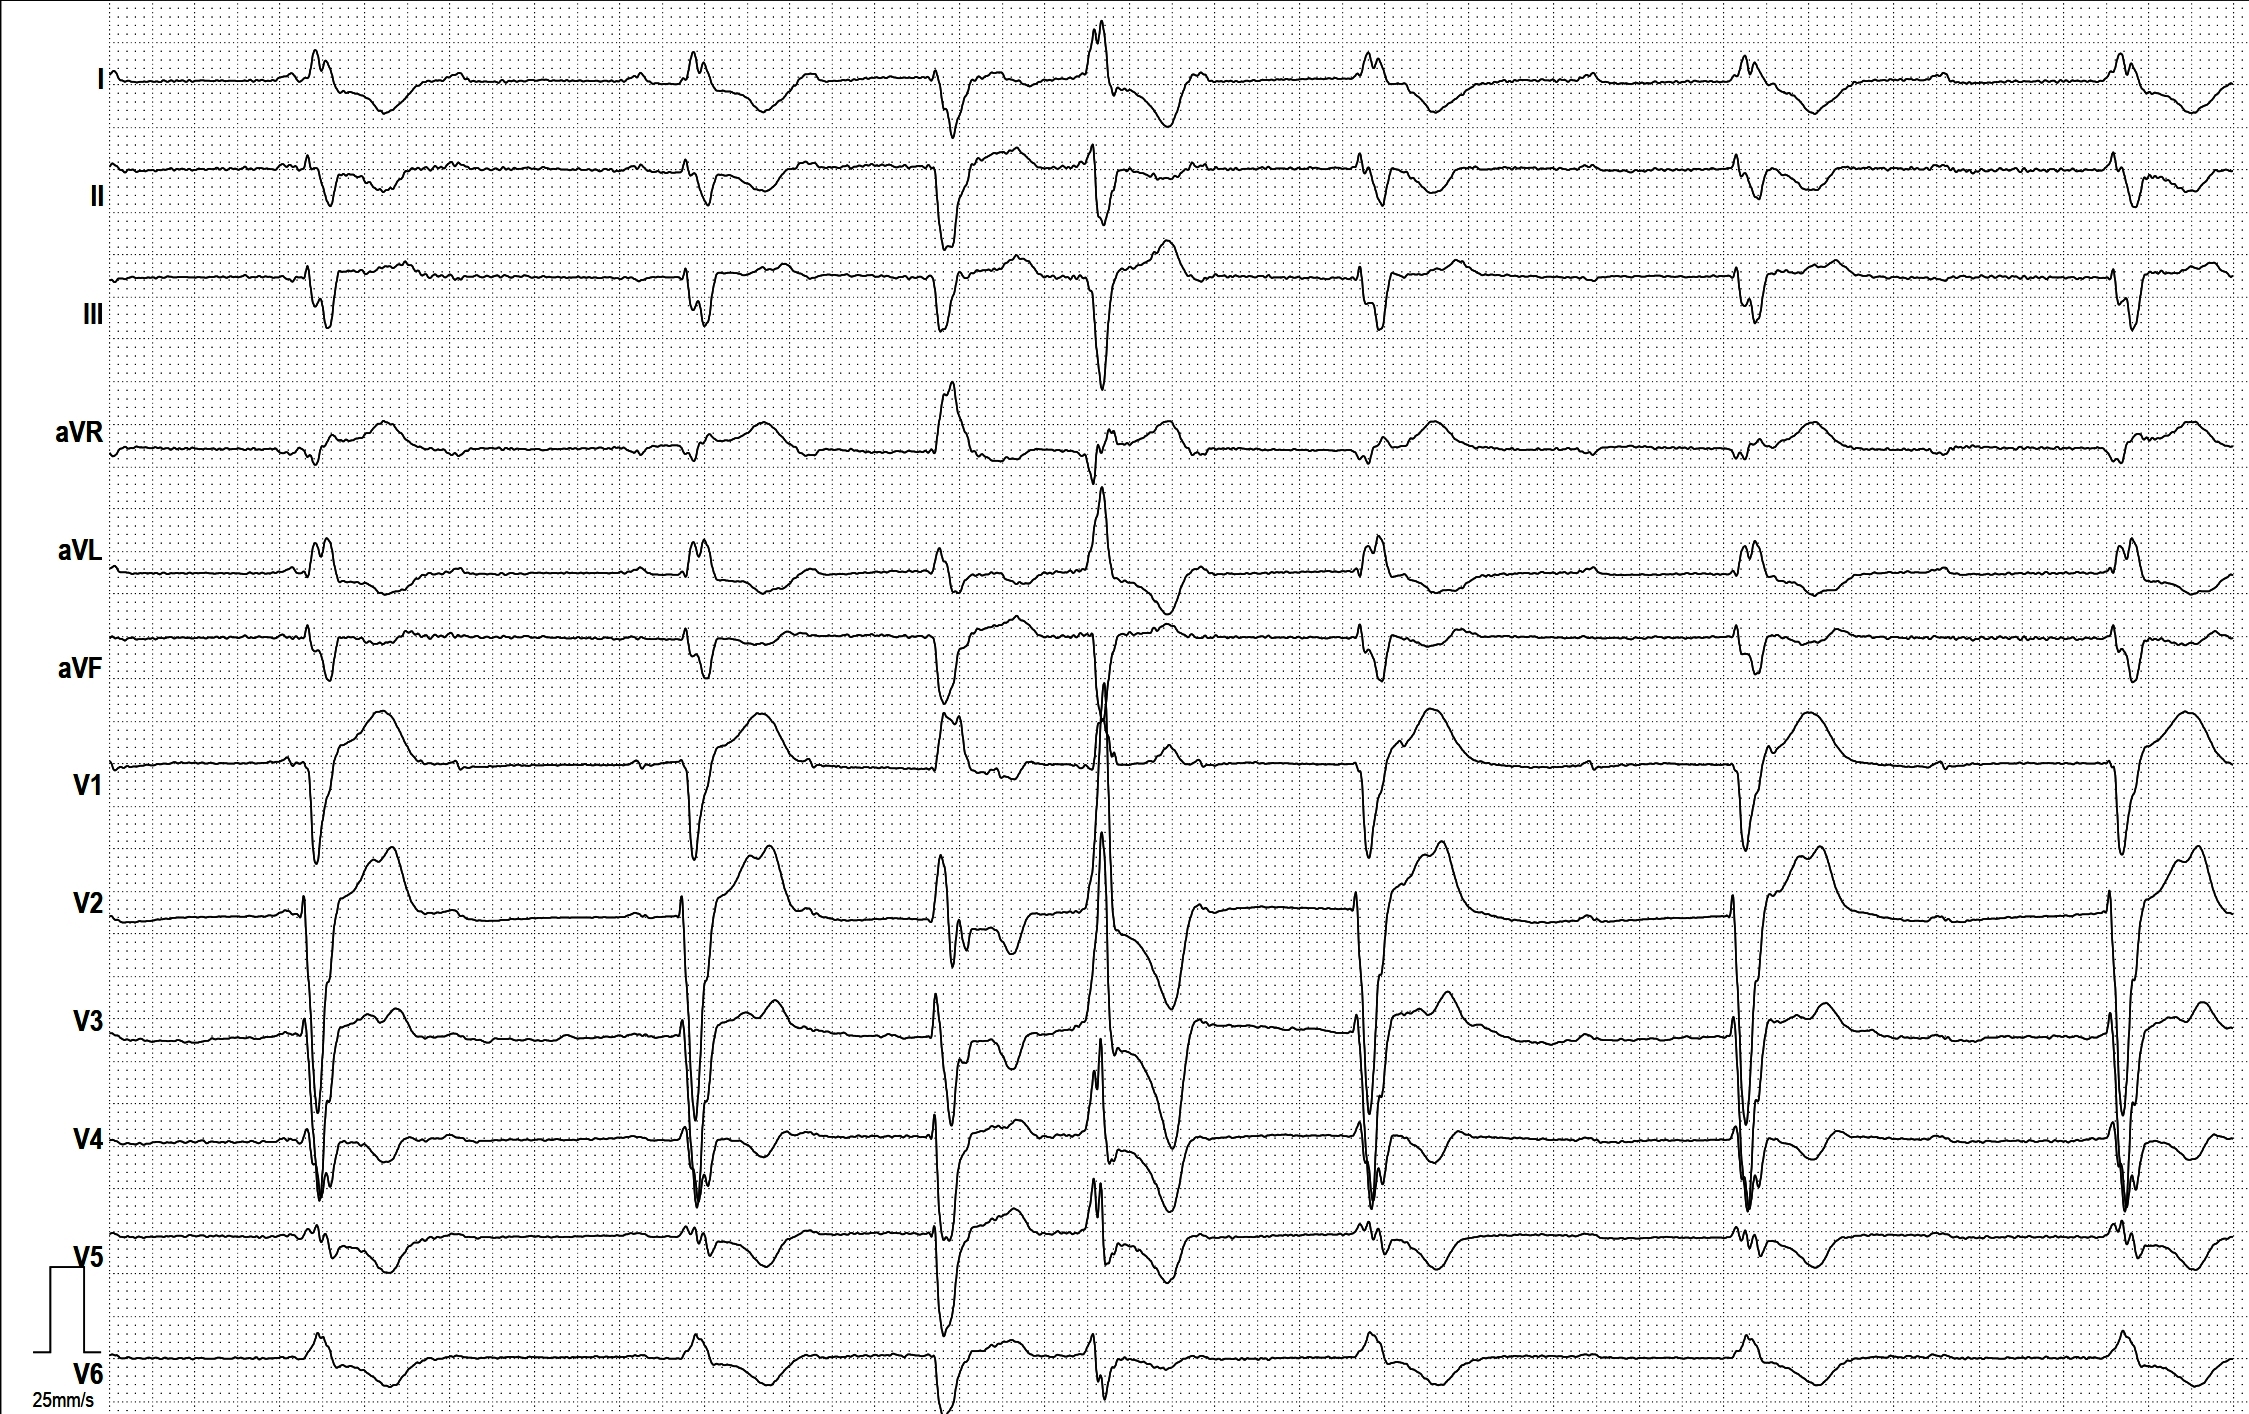
Lead-by-lead findings:
| Lead | Finding |
|---|---|
| All leads | P waves present at normal sinus rate (60-100/min) but with NO relationship to QRS |
| II (rhythm strip) | Best to see P-P regularity and R-R regularity - both regular but independent |
| V1-V6 | Wide, bizarre QRS if ventricular escape (>120ms); narrow if junctional escape |
| II, III, aVF | Escape rate: junctional (40-60 bpm, narrow QRS) vs. ventricular (20-40 bpm, wide QRS) |
| Rate | Atrial rate 60-100, ventricular escape rate 20-60 |
Key: P waves "march through" QRS complexes with no fixed PR interval - classic AV dissociation.
6. Wolff-Parkinson-White (WPW) Syndrome
Accessory pathway (Bundle of Kent) bypasses the AV node
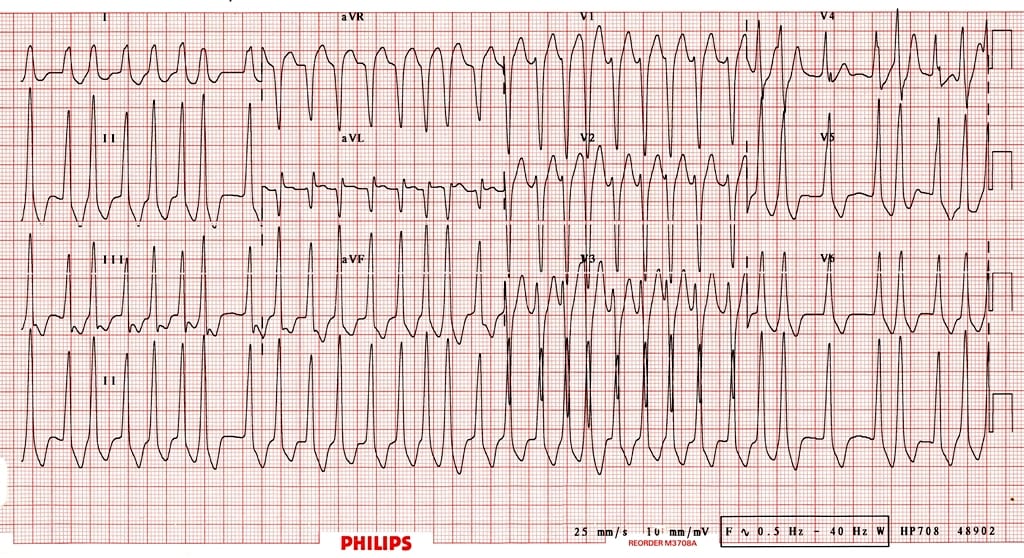
Lead-by-lead findings (sinus rhythm WPW):
| Lead | Finding |
|---|---|
| All leads | Short PR interval <120ms (pre-excitation bypasses AV node delay) |
| I, V5-V6 | Delta wave - slurred upstroke at start of QRS (slow accessory pathway conduction) |
| V1 | Positive delta = Type A WPW (left-sided pathway); Negative delta = Type B (right-sided) |
| V2-V6 | Broad QRS (>120ms) due to fusion of normal + accessory conduction |
| V1-V3 | Pseudo-R wave or pseudo-Q wave mimicking MI |
In WPW + AF (as shown above): irregular, pre-excited wide complex tachycardia - potentially life-threatening (can degenerate to VF). Never give AV nodal blocking agents.
7. Ventricular Tachycardia (VT)
Regular broad-complex tachycardia arising from ventricular ectopic focus
Lead-by-lead findings:
| Lead | Finding |
|---|---|
| All leads | Wide QRS (>120ms) at rate 100-250 bpm, regular rhythm |
| II (rhythm strip) | AV dissociation: P waves visible but unrelated to QRS (pathognomonic of VT) |
| V1 | LBBB morphology (positive) or RBBB morphology depending on origin site |
| V1-V6 | Concordance (all QRS pointing same direction) strongly suggests VT |
| Capture/fusion beats | Random narrow QRS or hybrid complex during VT - diagnostic of VT |
| Axis | Often extreme left axis deviation ("northwest axis") |
Brugada criteria and Vereckei algorithm use these lead-specific patterns to distinguish VT from SVT with aberrancy.
8. Pericarditis
Saddle-shaped diffuse ST elevation without reciprocal changes (except aVR)
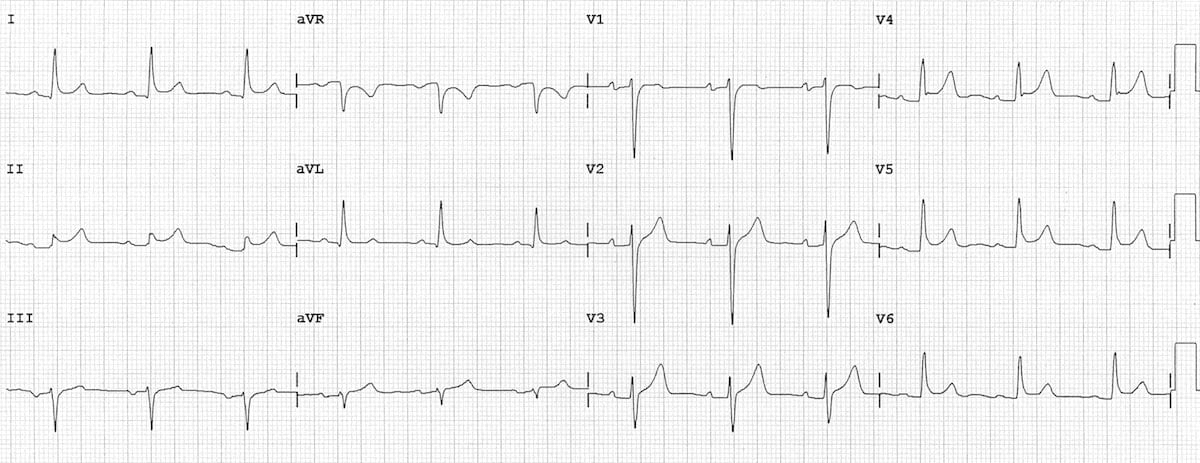
Lead-by-lead findings (Stage 1 - Acute):
| Lead | Finding |
|---|---|
| I, II, aVF, V2-V6 | Diffuse ST elevation - saddle-shaped (concave upward), nearly all leads |
| aVR (and V1) | Reciprocal ST depression + PR elevation |
| All leads | PR depression - the most specific sign for pericarditis |
| aVR | PR elevation (unique - opposite of all other leads) |
| No | Reciprocal changes in inferior/lateral leads (distinguishes from STEMI) |
4-Stage ECG evolution:
- Stage 1 (hours-days): Diffuse STE + PR depression
- Stage 2 (days): ST normalizes, T waves flatten
- Stage 3 (weeks): T wave inversions
- Stage 4 (weeks-months): ECG normalizes
ST/PR ratio >0.25 in lead II is 94% sensitive for pericarditis.
9. Left Bundle Branch Block (LBBB)
Delayed conduction through the left bundle - important marker of structural disease
Lead-by-lead findings:
| Lead | Finding |
|---|---|
| V1 | Deep, broad S wave (QS or rS pattern) - "W" shape in V1 |
| V5-V6, I, aVL | Broad, notched R wave (>120ms) - "M" shape in lateral leads |
| V1-V4 | No septal Q waves (normally Q in V5-V6, I, aVL are absent in LBBB) |
| V5-V6, I | Discordant ST-T changes - ST and T point opposite to QRS |
| II, III, aVF | May have broad S wave |
| QRS | Must be ≥120ms to qualify as complete LBBB |
New LBBB + chest pain = STEMI equivalent until proven otherwise. Use Sgarbossa criteria (concordant ST elevation ≥1mm, or discordant ST elevation ≥25% of QRS depth) to detect STEMI in LBBB.
10. Pulmonary Embolism (PE)
Classic ECG shows right heart strain pattern - often subtle
Lead-by-lead findings:
| Lead | Finding |
|---|---|
| V1-V3 | ST depression + T wave inversion (right heart strain) |
| V1 | New RBBB pattern (rSR') in large PE |
| II (rhythm strip) | Sinus tachycardia (most common ECG finding in PE) |
| III, aVF | S1Q3T3 pattern - S wave in I, Q wave in III, inverted T in III |
| I | New S wave (right axis shift) |
| II, III, aVF | P pulmonale (peaked P waves >2.5mm if severe) |
| aVR | May show ST elevation |
S1Q3T3 is classic but only present in ~20% of PE cases. Sinus tachycardia is the most sensitive but non-specific sign. New RBBB + T inversion V1-V4 in a hypoxic patient is highly suggestive.
ECG Special Patterns Quick Reference

The image above shows advanced STEMI-equivalent (OMI) patterns across leads including Wellens syndrome, De Winter T-waves, posterior OMI, and Modified Sgarbossa criteria.
Quick Lead Localization Summary Table
| Territory | Leads | Artery |
|---|---|---|
| Inferior | II, III, aVF | RCA (80%), LCx (20%) |
| Anterior | V1-V4 | LAD |
| Lateral | I, aVL, V5-V6 | LCx / diagonal LAD |
| Posterior | V1-V2 (reciprocal depression) | RCA or LCx |
| Right Ventricle | V4R | Proximal RCA |
| Septal | V1-V2 | LAD (septal branch) |
Step-by-Step ECG Reading Protocol (Every 12-lead)
- Rate - 300/R-R intervals in large squares
- Rhythm - Regular or irregular? P before every QRS?
- Axis - Lead I and aVF: both positive = normal axis
- P wave - Present, upright in II, morphology
- PR interval - 120-200ms (3-5 small squares)
- QRS duration - <120ms (narrow) vs. wide
- ST segment - Elevation or depression vs. TP baseline
- T waves - Upright in I, II, V2-V6; inverted in aVR (normal)
- QT interval - Correct for rate (QTc); abnormal if >440ms men / >460ms women
- Compare to prior ECG - Changes over time are often more informative than any single trace
Sources: LITFL ECG Library - Life in the Fast Lane, ECGlibrary.com, and ECG anatomy diagram via LITFL/Visible Body. All ECG images are from open-access educational resources.
Ecg paper e mark kore kore bujhaw
Loading Image
Searching the Web
ECG paper grid explanation labeled P wave QRS T wave PR interval small large squares mm marked diagram
Loading Image
Loading Image
Loading Image
Loading Image
Loading Image
এখন সব ছবি আছে। বিস্তারিত বাংলায় মার্ক করে বুঝাচ্ছি।
ECG Paper - মার্ক করে সম্পূর্ণ ব্যাখ্যা (বাংলায়)
ধাপ ১: ECG কাগজের গ্রিড বোঝো
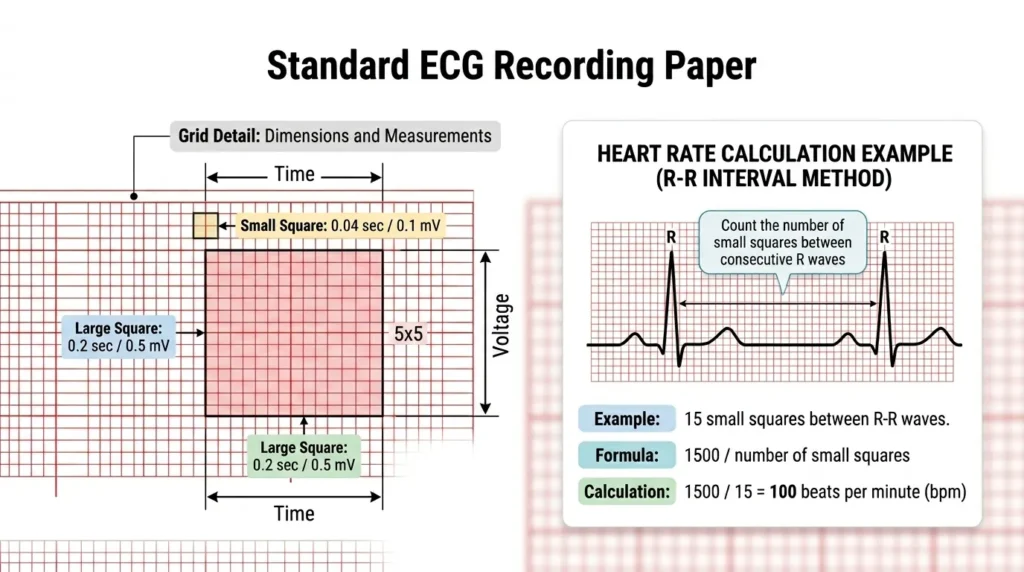
ECG কাগজে দুই ধরনের ঘর (square) আছে:
┌─────────────────────────────────────────────┐
│ ছোট ঘর (Small Square) │
│ ➡ চওড়া = 1 mm = 0.04 সেকেন্ড (সময়) │
│ ➡ উচ্চতা = 1 mm = 0.1 mV (ভোল্টেজ) │
│ │
│ বড় ঘর (Large Square) = ৫টি ছোট ঘর │
│ ➡ চওড়া = 5 mm = 0.20 সেকেন্ড (সময়) │
│ ➡ উচ্চতা = 5 mm = 0.5 mV (ভোল্টেজ) │
│ │
│ ১ সেকেন্ড = ৫টি বড় ঘর │
│ ১০ সেকেন্ড = পুরো ECG strip (৫০টি বড় ঘর) │
└─────────────────────────────────────────────┘
সহজ মনে রাখার উপায়:
- আড়াআড়ি (Horizontal) = সময় (Time) মাপে
- উপর-নিচ (Vertical) = ভোল্টেজ/উচ্চতা মাপে
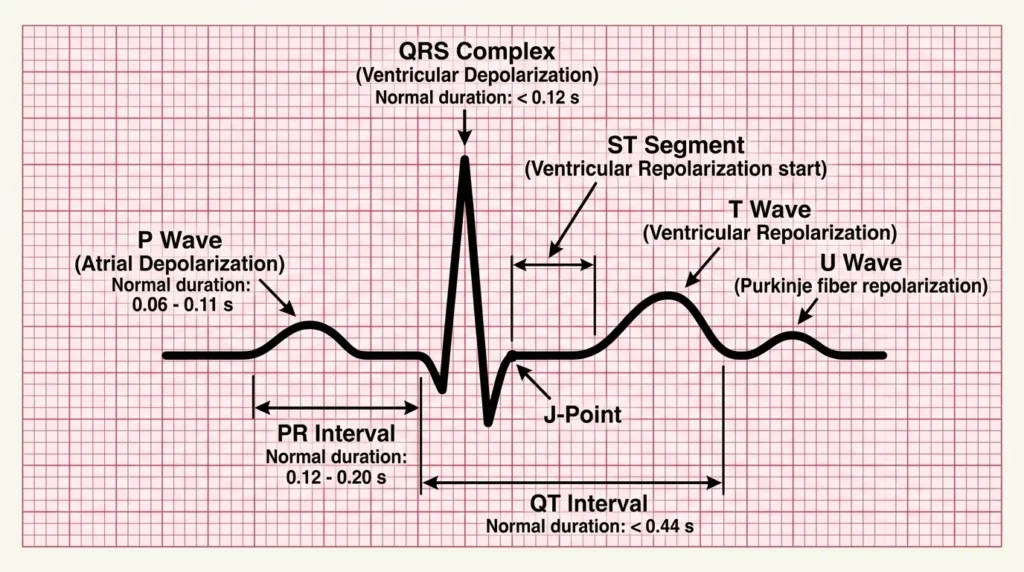
ধাপ ২: ECG-র প্রতিটি Wave চিহ্নিত করো
ধাপ ৩: প্রতিটি Interval ও Segment রঙ করে দেখো
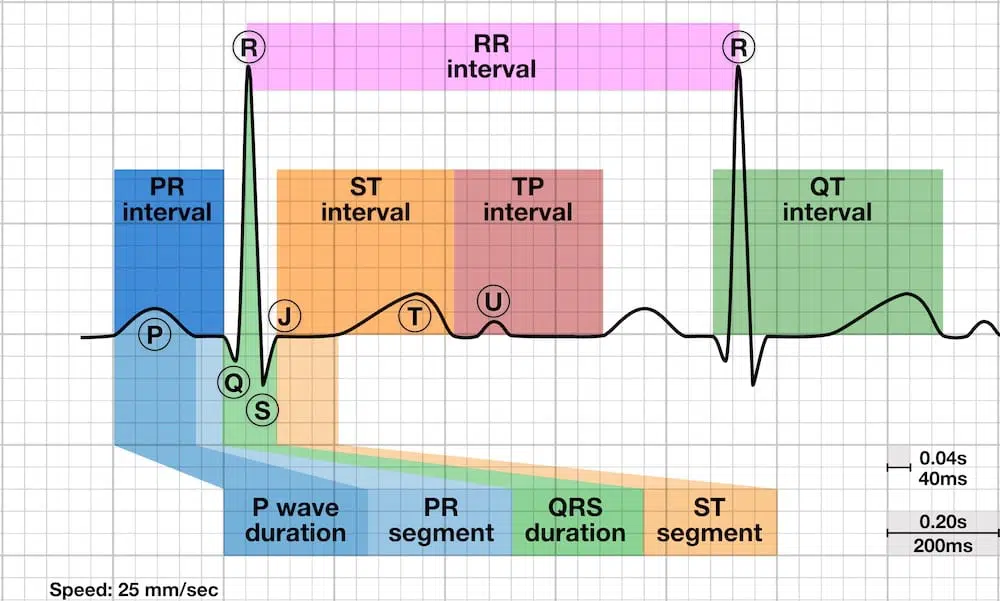
ধাপ ৪: ECG Paper-এ সময় মার্ক করে দেখানো

প্রতিটি Wave - মার্ক করে বিস্তারিত
🔵 P Wave (নীল রঙে চিহ্নিত করো)
___
/ \ ← এই ছোট গোলাকার ঢেউ = P Wave
__/ \__
| বিষয় | মান |
|---|---|
| অর্থ | Atrium (উপরের কক্ষ) সংকুচিত হচ্ছে |
| স্বাভাবিক উচ্চতা | ≤ 2.5 mm (২.৫টি ছোট ঘর) |
| স্বাভাবিক চওড়া | ≤ 0.12 sec (৩টি ছোট ঘর) |
| কোথায় সোজা | Lead II তে সবচেয়ে স্পষ্ট |
| অস্বাভাবিক হলে | Atrial enlargement বা Atrial fibrillation |
🟡 PR Interval (হলুদ রঙে চিহ্নিত করো)
___
/ \___________
__/ ← P শুরু থেকে QRS শুরু পর্যন্ত = PR Interval
|
[QRS]
| বিষয় | মান |
|---|---|
| অর্থ | SA Node → AV Node → Bundle of His পর্যন্ত সময় |
| স্বাভাবিক | 0.12 - 0.20 sec = ৩ থেকে ৫টি ছোট ঘর |
| ছোট হলে (<0.12s) | WPW Syndrome (অতিরিক্ত pathway আছে) |
| বড় হলে (>0.20s) | Heart Block (1st Degree AV Block) |
🔴 QRS Complex (লাল রঙে চিহ্নিত করো)
R
|
Q ___|___ S
___/ \/ \/ \___
↑
Q wave (ছোট নিচের ঢেউ)
| অংশ | মানে |
|---|---|
| Q wave | Septum এর depolarization (ছোট নিচের ঢেউ) |
| R wave | Ventricle এর উপরদিকের ঢেউ (সবচেয়ে উঁচু) |
| S wave | R এর পরে নিচের ঢেউ |
| স্বাভাবিক চওড়া | < 0.12 sec = ৩টির কম ছোট ঘর |
| চওড়া হলে (≥0.12s) | Bundle Branch Block (LBBB বা RBBB) |
| Pathological Q | চওড়া >0.04s বা গভীর >25% R = পুরনো MI |
🟠 ST Segment (কমলা রঙে চিহ্নিত করো)
R
|
Q S |_____T wave শুরু
___/ \/ \|
↑
এই সমতল অংশ = ST Segment
(J-Point থেকে T wave শুরু পর্যন্ত)
| বিষয় | মান |
|---|---|
| অর্থ | Ventricle depolarized কিন্তু repolarize হয়নি |
| স্বাভাবিক | Isoelectric line বরাবর সমতল |
| Elevation (উঁচু) | STEMI, Pericarditis |
| Depression (নিচু) | Ischemia, NSTEMI, Digoxin effect |
| পরিমাপ | J-Point থেকে 0.04s পরে দেখো |
🟢 T Wave (সবুজ রঙে চিহ্নিত করো)
___
/ \
________________/ \____
↑
T Wave = Ventricular Repolarization
| বিষয় | মান |
|---|---|
| অর্থ | Ventricle আবার rest state-এ ফিরছে |
| স্বাভাবিক উচ্চতা | ≤ 5mm limb leads, ≤ 10mm precordial leads |
| স্বাভাবিক দিক | I, II, V3-V6 তে Upright (সোজা) |
| উল্টো (Inverted) | Ischemia, PE, RVH, Wellens Syndrome |
| অনেক উঁচু (Peaked) | Hyperkalemia, Hyperacute MI |
🟣 QT Interval (বেগুনি রঙে চিহ্নিত করো)
___
/ \___________ ___
__/ \___/ \____
↑ ↑
Q শুরু T wave শেষ
←────── QT Interval ────────→
| বিষয় | মান |
|---|---|
| অর্থ | পুরো ventricular depolarization + repolarization |
| স্বাভাবিক | পুরুষ: ≤ 440ms (≤ 11 ছোট ঘর), মহিলা: ≤ 460ms |
| Rate দিয়ে correct করো | QTc = QT ÷ √(RR interval) |
| লম্বা হলে | Torsades de Pointes (dangerous VT), Drugs, Hypocalcemia |
| ছোট হলে | Hypercalcemia, Digoxin |
⚪ U Wave (সাদা/ধূসর)
___ _
/ \/ \
________________/ \___
↑
U Wave (ছোট, T wave-এর পরে)
- অর্থ: Purkinje fiber repolarization
- স্বাভাবিক: ছোট, T wave-এর মতো একই দিকে
- বড় U wave: Hypokalemia (রক্তে Potassium কম)
ধাপ ৫: Heart Rate হিসাব করো (ECG Paper দিয়ে)
পদ্ধতি ১ - বড় ঘর গণনা (Regular Rhythm)
দুটো R wave-এর মাঝে বড় ঘর গুনো, তারপর:
300 ÷ বড় ঘর সংখ্যা = Heart Rate
উদাহরণ:
2 বড় ঘর = 300÷2 = 150 bpm
3 বড় ঘর = 300÷3 = 100 bpm ← Normal upper limit
4 বড় ঘর = 300÷4 = 75 bpm ← Normal
5 বড় ঘর = 300÷5 = 60 bpm ← Normal lower limit
6 বড় ঘর = 300÷6 = 50 bpm ← Bradycardia
পদ্ধতি ২ - ছোট ঘর গণনা (বেশি নির্ভুল)
1500 ÷ (R-R interval-এ ছোট ঘর সংখ্যা) = Heart Rate
উদাহরণ: 20 ছোট ঘর → 1500 ÷ 20 = 75 bpm
পদ্ধতি ৩ - Irregular Rhythm (AF ইত্যাদি)
১০ সেকেন্ড strip-এ QRS সংখ্যা গুনো × 6 = Heart Rate/min
সারসংক্ষেপ টেবিল - স্বাভাবিক মান (মুখস্থ করো)
| Wave/Interval | ছোট ঘর সংখ্যা | সেকেন্ড/mV |
|---|---|---|
| P wave চওড়া | ≤ 3 ঘর | ≤ 0.12 sec |
| P wave উচ্চতা | ≤ 2.5 ঘর | ≤ 2.5 mm |
| PR Interval | 3-5 ঘর | 0.12-0.20 sec |
| QRS চওড়া | < 3 ঘর | < 0.12 sec |
| QT Interval | < 11 ঘর | < 0.44 sec |
| ST Segment | isoelectric (সমতল) | 0 mm change |
| 1 mV calibration | 10 ঘর উঁচু | 10 mm = 1 mV |
সহজ মনে রাখার Trick (PQRSTU)
P = Propagation (Atrium সংকোচন)
Q = Question (Pathological হলে MI)
R = Real beat (সবচেয়ে উঁচু ঢেউ)
S = Slowing down (R এর পরে)
T = Time to rest (Ventricle বিশ্রাম)
U = Unexpected small wave (Hypokalemia দেখো)
ECG paper-এ যেকোনো ঢেউ দেখলে প্রথমে জিজ্ঞেস করো:
- এটা কোন Wave (P, Q, R, S, T)?
- এটা স্বাভাবিকের চেয়ে বড়/ছোট/উল্টো কিনা?
- আড়াআড়ি (চওড়া = সময়) ঠিক আছে কি?
- উপর-নিচ (উচ্চতা = voltage) ঠিক আছে কি?
This is a shared conversation. Sign in to Orris to start your own chat.