
kindly provide how to interpreted ecg in emergency department , please provide details about that.
Reading File
ECG interpretation in the emergency department (ED) follows a systematic approach: check rate, rhythm, axis, intervals (PR, QRS, QT), then analyze P waves, QRS morphology, and ST/T wave changes. Key priorities include identifying STEMI, life-threatening arrhythmias, and conduction blocks quickly. Now let me pull detailed content from the medical library.
Searching sources...
Finding Sources
Finding Sources
Searching PubMed
ECG interpretation emergency department systematic approach
Finding Sources
Finding Sources
Reading File
Reading File
Finding Sources
Finding Sources
Reading File
Finding Sources
Finding Sources
Reading File
Reading File
Reading File
Reading File
Reading File
Loading Image
Loading Image
Finding Sources
I now have comprehensive content from Tintinalli's Emergency Medicine, Harrison's Principles, and Kaplan & Sadock's. Let me compile the full detailed answer.
ECG Interpretation in the Emergency Department
A systematic, stepwise approach is the standard for every ECG read in the ED. Errors in ECG interpretation are most often errors of omission - things you failed to look for, not things you misidentified. Always correlate with the patient's age, sex, and clinical presentation, and compare with any prior ECGs.
Step 1: Technical Checklist Before You Read Anything
Before interpreting wave morphology, confirm:
- Calibration: Standard is 10 mm = 1 mV amplitude, paper speed 25 mm/sec
- Lead placement: Incorrect lead placement (e.g. limb lead reversal) is a common artifact that mimics pathology
- Artifact: Tremor, movement, or poor contact can mimic arrhythmias
Step 2: Heart Rate
Normal: 60-100 bpm
Two methods exist:
Rate-by-squares method (for regular rhythms):
- Count large boxes between two consecutive R waves
- Divide 300 by that number
- 1 large box = 300 bpm, 2 = 150, 3 = 100, 4 = 75, 5 = 60, 6 = 50
QRS-count method (for irregular rhythms such as atrial fibrillation):
- Count the total number of QRS complexes on a standard 10-second ECG strip
- Multiply by 6 (since 10 sec × 6 = 1 minute)
| Finding | Threshold | Common Causes |
|---|---|---|
| Bradycardia | < 60 bpm | Medications (beta-blockers, CCBs, lithium), hypothyroidism, AV block, increased vagal tone, sinus node disease |
| Tachycardia | > 100 bpm | Pain, fever, hypovolemia, PE, anticholinergic drugs, sympathomimetics |
- Kaplan & Sadock's Comprehensive Textbook of Psychiatry, p. 6824
- Tintinalli's Emergency Medicine, Chapter 49
Step 3: Rhythm
Ask three questions:
- Is there a P wave before every QRS?
- Is there a QRS after every P wave?
- Are the P-P and R-R intervals regular?
Normal sinus rhythm: P wave precedes every QRS; P is upright in leads I, II; regular rate 60-100 bpm.
Classify the rhythm by two features:
| QRS Width | Rhythm Type |
|---|---|
| Narrow (< 100 ms / 2.5 small boxes) | Supraventricular origin - follows the normal His-Purkinje system |
| Wide (≥ 100 ms) | Ventricular origin OR conduction delay (bundle branch block, aberrant conduction) |
Narrow complex tachycardias include sinus tachycardia, atrial fibrillation/flutter, SVT (AVNRT, AVRT), MAT.
Wide complex tachycardias include ventricular tachycardia (VT), SVT with aberrancy, pre-excitation syndromes (WPW).
Key rule in the ED: If a patient is hemodynamically unstable with a wide complex tachycardia, treat as VT until proven otherwise.
Step 4: Cardiac Axis
The axis represents the net vector of ventricular depolarization across the myocardium.
Normal axis: -30° to +90°
Quick 2-lead method - check Lead I (0°) and aVF (+90°):
| Lead I | aVF | Axis |
|---|---|---|
| Positive | Positive | Normal (-30° to +90°) |
| Positive | Negative | Left axis deviation (LAD) |
| Negative | Positive | Right axis deviation (RAD) |
| Negative | Negative | Extreme / "northwest" axis (rare) |
Clinical significance:
-
LAD: Left ventricular hypertrophy, left anterior fascicular block, inferior MI, LBBB
-
RAD: Right ventricular hypertrophy, left posterior fascicular block, lateral MI, PE (acute cor pulmonale), RBBB, dextrocardia
-
Kaplan & Sadock's, p. 6825
Step 5: Intervals
The ECG paper grid: each small box = 0.04 sec, each large box = 0.20 sec.
PR Interval
- Normal: 0.12-0.20 sec (3-5 small boxes)
- Short PR (< 0.12 sec): Pre-excitation (WPW), accelerated AV nodal conduction, junctional rhythm
- Long PR (> 0.20 sec): First-degree AV block
- Progressive lengthening then dropped QRS: Second-degree AV block (Mobitz I / Wenckebach)
- Constant long PR with dropped QRS: Mobitz II (more dangerous - prone to complete block)
- No relationship between P and QRS: Third-degree (complete) AV block - requires pacing
QRS Duration
- Normal: < 0.12 sec (< 3 small boxes)
- Wide QRS (≥ 0.12 sec) = bundle branch block or ventricular origin
Differentiating BBB:
| Feature | RBBB | LBBB |
|---|---|---|
| V1 morphology | RSR' ("rabbit ears" / M-pattern) | QS or rS (broad negative) |
| V6 morphology | Wide S wave | Broad monophasic R wave |
| Clinical concern | RBBB may be normal variant; new RBBB can indicate PE or RV strain | New LBBB - evaluate for ACS, cardiomyopathy |
QT / QTc Interval
- Measured from start of QRS to end of T wave
- Correct for heart rate using Bazett's formula: QTc = QT ÷ √(R-R interval in seconds)
- Normal QTc: < 440 ms in men, < 460 ms in women
- Prolonged QTc is a risk for Torsades de Pointes (TdP) - a polymorphic VT
- Common ED causes of QT prolongation: electrolyte disturbances (hypokalemia, hypomagnesemia, hypocalcemia), antipsychotics, antiarrhythmics (amiodarone, sotalol), antibiotics (fluoroquinolones, macrolides), tricyclic antidepressants, hypothyroidism
Note: A wide QRS (bundle branch block or ventricular pacing) artificially prolongs the measured QT. In these cases, the AHA/ACC/HRS recommends correcting for QRS duration or using the JT interval instead.
- Kaplan & Sadock's, p. 6825-6826
Step 6: P Waves
- Normal P wave: Upright in I, II; inverted in aVR; biphasic in V1 (initial positive, terminal negative deflection)
- Peaked, tall P in II (> 2.5 mm): Right atrial enlargement ("P pulmonale") - seen in COPD, PE, pulmonary hypertension
- Broad, notched P (> 0.12 sec in II) or prominent negative component in V1: Left atrial enlargement ("P mitrale") - seen in mitral stenosis, LV failure
- No P waves: Atrial fibrillation (irregularly irregular), sinus arrest
- Sawtooth P waves at ~300 bpm: Atrial flutter (typically 2:1, 3:1, or 4:1 block)
- Retrograde P after QRS: Junctional rhythm
Step 7: QRS Voltage and Morphology
Voltage criteria for Left Ventricular Hypertrophy (LVH):
- Sokolow-Lyon: S in V1 + R in V5 or V6 > 35 mm
- Cornell: R in aVL + S in V3 > 28 mm (men) or > 20 mm (women)
Low voltage:
- QRS amplitude < 5 mm in all limb leads or < 10 mm in all precordial leads
- Causes: pericardial effusion, cardiac tamponade, hypothyroidism, COPD/emphysema, obesity
Pathological Q waves (> 0.04 sec wide or > 1/4 height of the R wave in same lead):
- Indicate prior transmural myocardial infarction
- Location tells you the territory affected (see STEMI table below)
Precordial R-wave progression:
- R wave should progressively increase from V1 to V5-V6
- Loss of R-wave progression (poor R-wave progression) may indicate anterior MI or LVH
Step 8: ST Segments
The ST segment represents the isoelectric phase between ventricular depolarization and repolarization. Measured at the J point (junction of QRS and ST).
ST Elevation - STEMI Criteria
Per Tintinalli's Emergency Medicine (Table 49-4):
| Territory | Leads with ST Elevation | Likely Vessel |
|---|---|---|
| Anteroseptal | V1, V2, (V3) | Proximal LAD |
| Anterior | V1-V4 | LAD |
| Anterolateral | V1-V6, I, aVL | Proximal LAD or LCx |
| Lateral | I, aVL | LCx or diagonal branch |
| Inferior | II, III, aVF | RCA (80%) or LCx (20%) |
| Inferolateral | II, III, aVF + V5, V6 | RCA or LCx |
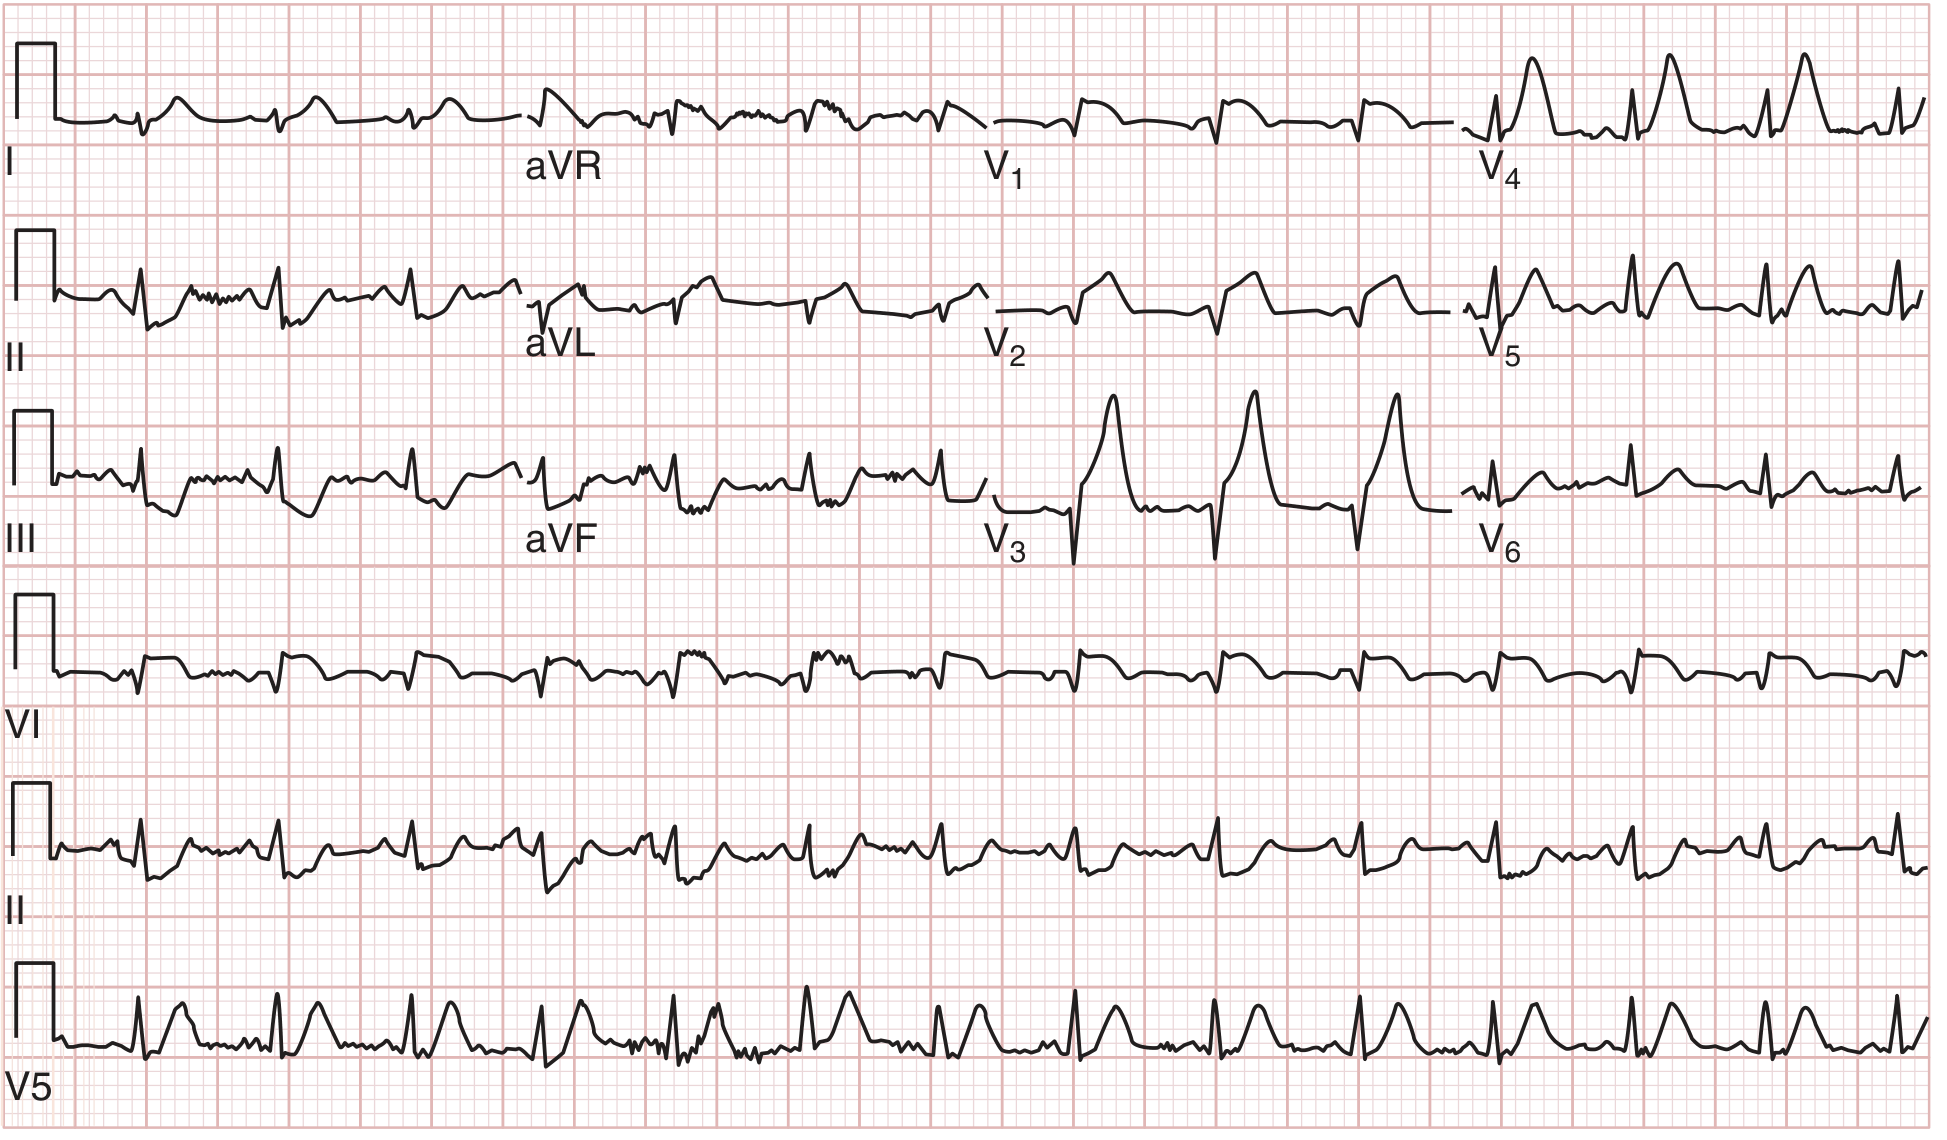
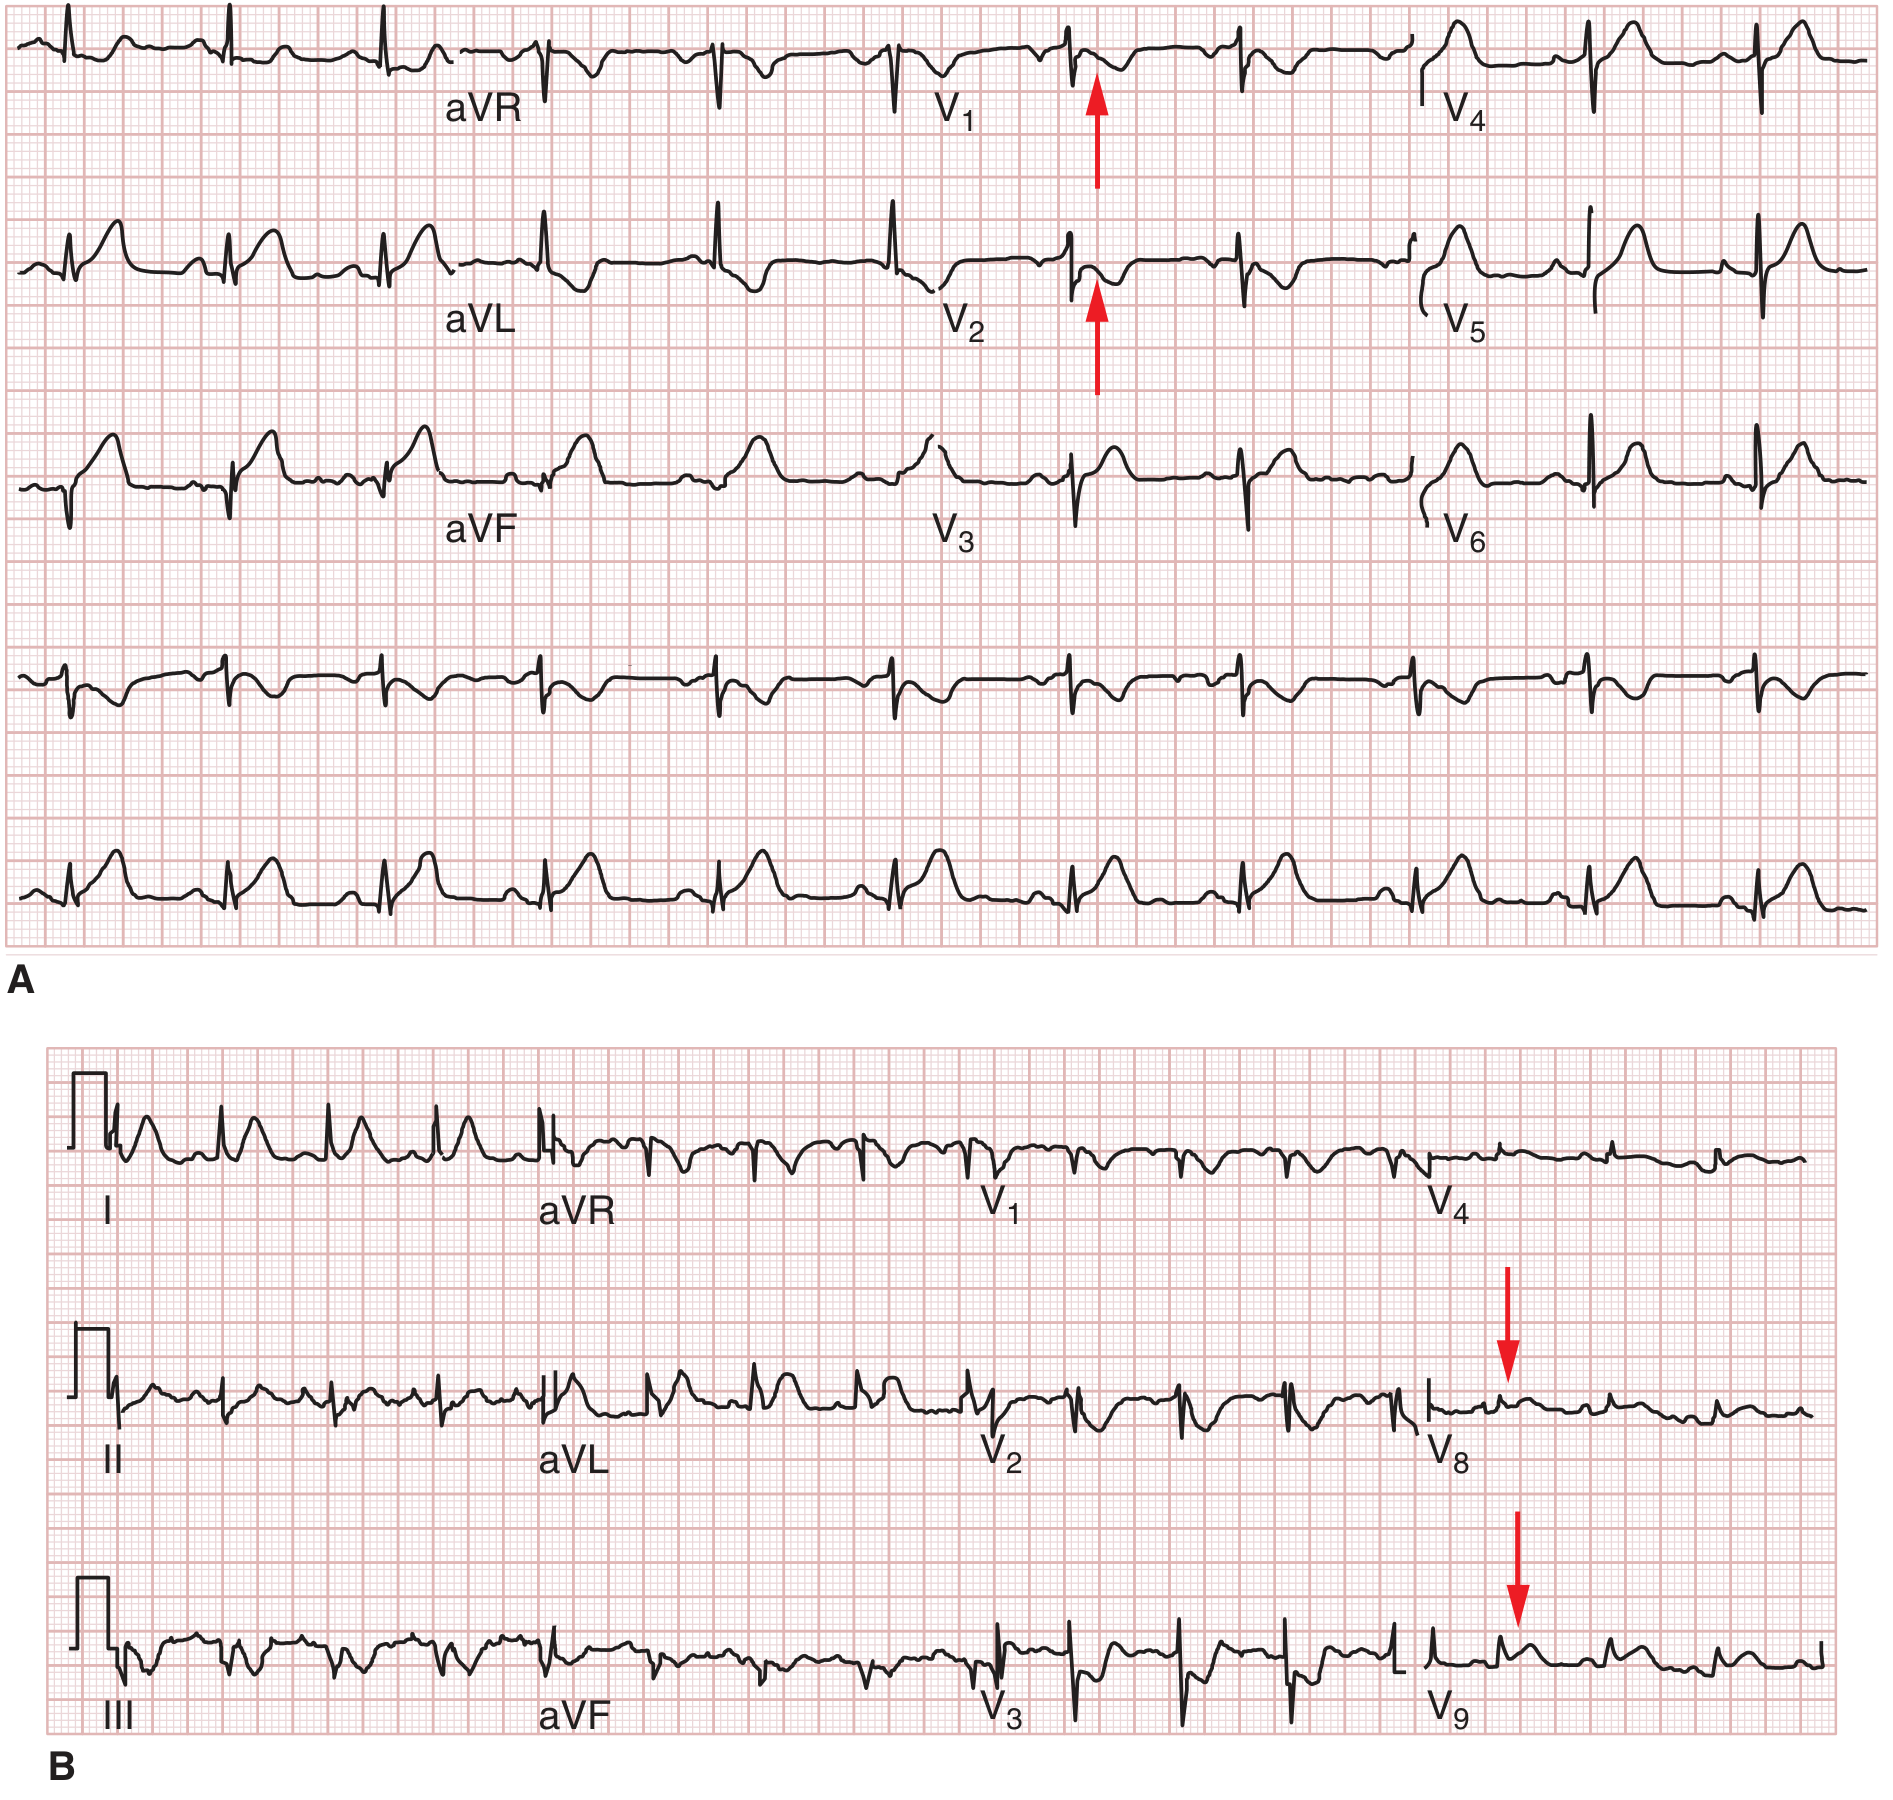
| True posterior | Tall R waves in V1-V2, R/S ≥ 1 | RCA or LCx |
| Right ventricular | II, III, aVF + ST elevation in V3R-V6R | Proximal RCA |
Reciprocal changes (ST depression in leads opposite to the injury zone) indicate a larger infarct, greater severity of CAD, and increased mortality risk.
Inferior MI: Always obtain a right-sided ECG (V4R) to rule out right ventricular infarction (important because nitrates and diuretics are relatively contraindicated if RV infarct is present).
Posterior MI: Check for tall R waves and ST depression in V1-V2 (mirror image); confirm with posterior leads V7-V9 showing ST elevation.
Conditions Mimicking STEMI (False Positives)
The following can produce ST elevation without acute MI. Always correlate clinically:
| Condition | Key Differentiator |
|---|---|
| Early repolarization | Concave upward ST elevation; notch at J point; young healthy patient |
| Pericarditis | Diffuse saddle-shaped ST elevation; PR depression (especially in II); pleuritic chest pain |
| LVH | ST elevation in V1-V3 with reciprocal changes; voltage criteria met |
| Ventricular aneurysm | Persistent ST elevation in prior MI territory; Q waves present |
| LBBB (new or old) | ST elevation in V1-V3 by nature of block; use Sgarbossa criteria |
| Takotsubo cardiomyopathy | Diffuse ST elevation; post-stress; predominantly female; apical ballooning on echo |
| Hyperkalemia | Peaked T waves + ST changes; broad QRS; sine wave pattern |
| Hypothermia | Osborn (J) wave at QRS-ST junction |
| Myocarditis | Diffuse ST elevation; may be young patient with viral prodrome |
- Tintinalli's Emergency Medicine, Table 49-6
ST Depression
Indicates subendocardial ischemia or reciprocal change. Common causes:
- Active ischemia/NSTEMI
- Reciprocal to STEMI in opposite wall
- Digoxin effect (downsloping, "reverse tick" pattern in V5-V6)
- Hypokalemia
- Cor pulmonale / right heart strain
Step 9: T Waves
- Normal: Upright in I, II, V3-V6; inverted in aVR; variable in III, aVL, V1
- Repolarization is an active (ATP-dependent) process, so T waves are especially sensitive to ischemia and metabolic disturbance
T-wave changes of clinical importance:
| Finding | Differential Diagnosis |
|---|---|
| Hyperacute T waves (tall, peaked, asymmetric) | First ECG sign of STEMI (precedes ST elevation); also hyperkalemia |
| T-wave inversion | Ischemia/NSTEMI, Wellens' syndrome, PE (V1-V4), intracranial hemorrhage, myocarditis, pericarditis, RBBB, post-tachycardia pattern, mitral valve prolapse |
| Wellens' syndrome | Deep symmetric T-wave inversion OR biphasic T in V2-V3 in a pain-free patient after angina - indicates critical LAD stenosis, high risk of anterior STEMI |
| Peaked T waves (symmetrical) | Hyperkalemia (early sign) |
| Flattened T waves | Hypokalemia, hyper/hypocalcemia, normal variant, drug effect |
Wellens' warning: 15% of unstable angina patients show Wellens' sign. These patients must receive urgent interventional management because of the high risk of imminent anterior MI.
- Tintinalli's Emergency Medicine, p. 3328
Step 10: U Waves
- A small positive deflection after the T wave, best seen in V2-V3
- Prominent U waves: Hypokalemia (classic finding), bradycardia, certain drugs (quinidine)
- Negative U waves: Suggest LVH or ischemia (pathological)
Step 11: Common ED-Specific Patterns to Recognize
Life-Threatening Arrhythmias
| Pattern | Key ECG Feature | Immediate Action |
|---|---|---|
| VF | No organized QRS; chaotic undulation | Defibrillate immediately |
| Pulseless VT | Wide complex tachycardia, regular | Cardioversion |
| Complete (3rd degree) AV block | P waves and QRS with no relationship; slow escape rate | Atranscutaneous pacing |
| Torsades de Pointes | Twisting of QRS axis around isoelectric line; long QTc | Magnesium IV; stop offending drugs |
| WPW + AF | Irregularly irregular wide complex tachycardia (delta waves) | Procainamide; avoid AV nodal blockers (can cause VF) |
Other Important Patterns
| Pattern | Key ECG Features |
|---|---|
| Pulmonary embolism | Sinus tachycardia (most common); S1Q3T3 (S in I, Q and T inversion in III); new RBBB; T inversions V1-V4 |
| Cardiac tamponade | Sinus tachycardia + low voltage + electrical alternans (QRS amplitude changes beat to beat) |
| Hyperkalemia | Peaked T waves → widened QRS → PR prolongation → sine wave → VF/PEA |
| Brugada syndrome | Coved ST elevation in V1-V2 with pseudo-RBBB morphology; risk of sudden cardiac death |
| Digoxin toxicity | "Reverse tick" ST depression + slowed AV conduction + bidirectional VT |
Key Pearls for the ED
- Always compare with old ECGs - a "normal" QRS width is not normal if the patient previously had a narrow QRS.
- New LBBB is not automatically a STEMI equivalent - < 10% of patients with new LBBB have AMI. Use the Sgarbossa criteria (concordant ST elevation ≥ 1 mm in leads with positive QRS, or concordant ST depression ≥ 1 mm in V1-V3, or discordant ST elevation ≥ 5 mm) to identify STEMI within LBBB.
- Repeat ECGs - a normal initial ECG does not exclude ACS. In high-risk patients with persistent symptoms and non-diagnostic first ECG, serial ECGs can detect evolving changes.
- Right-sided and posterior leads should be obtained in every inferior STEMI to detect RV infarction and posterior wall extension.
- Reciprocal changes confirm STEMI - their presence increases the likelihood of true transmural infarction and indicates a larger injury area.
- Never rely on a computer interpretation alone - automated ECG systems have significant limitations in arrhythmia diagnosis and require mandatory clinician review.
- Harrison's Principles of Internal Medicine 22E, p. 1919
- Tintinalli's Emergency Medicine, Chapter 49
- Kaplan & Sadock's Comprehensive Textbook of Psychiatry, p. 6824-6826
Summary: The 14-Parameter Systematic Checklist (Harrison's)
- Calibration and technical quality
- Rhythm
- Heart rate
- PR interval / AV conduction
- QRS duration
- QT / QTc interval
- Mean QRS electrical axis
- P wave morphology
- QRS voltages
- Precordial R-wave progression
- Abnormal Q waves
- ST segments
- T waves
- U waves
Following this order on every ECG ensures no critical finding is missed in the time-pressured ED environment.
This is a shared conversation. Sign in to Orris to start your own chat.