
Diabetic keto acidosis treatment Harrison protocol
diabetic ketoacidosis DKA treatment protocol management flowchart
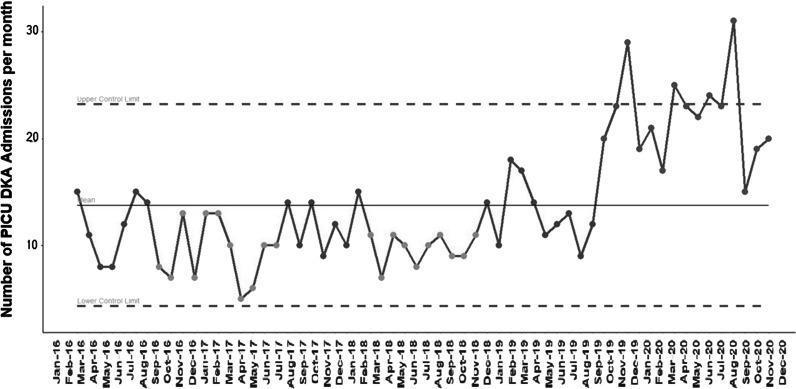
This medical timeline chart is a Statistical Process Control (SPC) chart, specifically a longitudinal line graph illustrating the monthly frequency of Pediatric Intensive Care Unit (PICU) admissions for Diabetic Ketoacidosis (DKA) from January 2016 to December 2020. The chart features three horizontal reference lines: a solid central line representing the mean, and two dashed lines representing the Upper Control Limit (UCL) and Lower Control Limit (LCL). From early 2016 through mid-2019, the data exhibits common-cause variation, with admission numbers remaining stable and generally fluctuating below the mean, rarely approaching the LCL (approximately 5 admissions). A significant shift toward special-cause variation begins in late 2019. Starting around November 2019 and continuing through 2020, there is a sustained increase in both volume and volatility. Multiple data points in 2020 (notably around March, July, and August) exceed the UCL, peaking at over 30 admissions per month. This visual evidence demonstrates a statistically significant upward trend in severe DKA cases requiring intensive care, potentially correlating with healthcare delivery changes or delayed presentations during the COVID-19 pandemic.
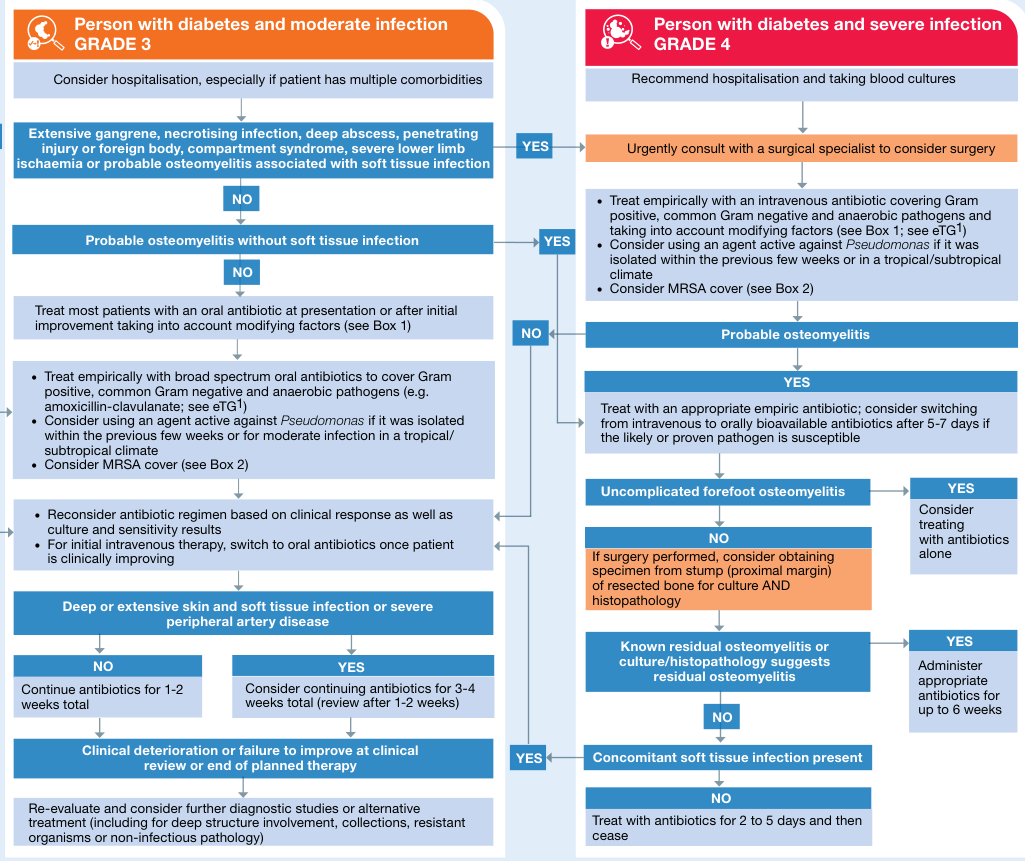
Summary : This flowchart provides a clinical decision-making pathway for the management of diabetic patients with moderate (Grade 3) and severe (Grade 4) infections, focusing on hospitalisation, antibiotic therapy, surgical consultation, and osteomyelitis treatment. flowchart: # Grade 3: Person with diabetes and moderate infection Nodes : • Start (rectangle): "Person with diabetes and moderate infection GRADE 3" • Decision (rectangle): "Consider hospitalisation, especially if patient has multiple comorbidities" • Decision (rectangle): "Extensive gangrene, necrotising infection, deep abscess, penetrating injury or foreign body, compartment syndrome, severe lower limb ischaemia or probable osteomyelitis associated with soft tissue infection" • Decision (rectangle): "Probable osteomyelitis without soft tissue infection" • Process (rectangle): "Treat most patients with an oral antibiotic at presentation or after initial improvement taking into account modifying factors (see Box 1)" • Process (rectangle): "Treat empirically with broad spectrum oral antibiotics to cover Gram positive, common Gram negative and anaerobic pathogens (e.g. amoxicillin-clavulanate; see eTG1)" • Process (rectangle): "Consider using an agent active against Pseudomonas if it was isolated within the previous few weeks or for moderate infection in a tropical/subtropical climate" • Process (rectangle): "Consider MRSA cover (see Box 2)" • Process (rectangle): "Reconsider antibiotic regimen based on clinical response as well as culture and sensitivity results" • Process (rectangle): "For initial intravenous therapy, switch to oral antibiotics once patient is clinically improving" • Decision (rectangle): "Deep or extensive skin and soft tissue infection or severe peripheral artery disease" • Process (rectangle): "Continue antibiotics for 1-2 weeks total" • Process (rectangle): "Consider continuing antibiotics for 3-4 weeks total (review after 1-2 weeks)" • Decision (rectangle): "Clinical deterioration or failure to improve at clinical review or end of planned therapy" • Process (rectangle): "Re-evaluate and consider further diagnostic studies or alternative treatment (including for deep structure involvement, collections, resistant organisms or non-infectious pathology)" # Grade 4: Person with diabetes and severe infection Nodes : • Start (rectangle): "Person with diabetes and severe infection GRADE 4" • Process (rectangle): "Recommend hospitalisation and taking blood cultures" • Decision (rectangle): "Urgently consult with a surgical specialist to consider surgery" • Process (rectangle): "Treat empirically with an intravenous antibiotic covering Gram positive, common Gram negative and anaerobic pathogens and taking into account modifying factors (see Box 1; see eTG1)" • Process (rectangle): "Consider using an agent active against Pseudomonas if it was isolated within the previous few weeks or in a tropical/subtropical climate" • Process (rectangle): "Consider MRSA cover (see Box 2)" • Decision (rectangle): "Probable osteomyelitis" • Process (rectangle): "Treat with an appropriate empiric antibiotic; consider switching from intravenous to orally bioavailable antibiotics after 5-7 days if the likely or proven pathogen is susceptible" • Decision (rectangle): "Uncomplicated forefoot osteomyelitis" • Process (rectangle): "Consider treating with antibiotics alone" • Decision (rectangle): "If surgery performed, consider obtaining specimen from stump (proximal margin) of resected bone for culture AND histopathology" • Decision (rectangle): "Known residual osteomyelitis or culture/histopathology suggests residual osteomyelitis" • Process (rectangle): "Administer appropriate antibiotics for up to 6 weeks" • Decision (rectangle): "Concomitant soft tissue infection present" • Process (rectangle): "Treat with antibiotics for 2 to 5 days and then cease" Connectors : • Arrows indicate decision points (YES/NO) and direct flow to subsequent steps. • YES/NO branches are clearly marked at each decision node. • Some nodes loop back to earlier steps if clinical deterioration or failure to improve occurs. Layout : • Two parallel columns: left for Grade 3 (moderate infection), right for Grade 4 (severe infection). • Each column starts with initial assessment, then branches based on clinical findings and response to therapy. • Decision nodes and process steps are arranged vertically, with arrows connecting them according to clinical logic. Analysis : • The flowchart provides a structured approach for clinicians to manage diabetic infections, distinguishing between moderate and severe cases. • Emphasises early hospitalisation and surgical consultation for severe infections. • Antibiotic therapy is tailored based on infection severity, pathogen risk, and clinical response. • Osteomyelitis management includes both medical and surgical options, with clear criteria for duration and type of antibiotic therapy. • The chart highlights the importance of re-evaluation and diagnostic flexibility in cases of poor clinical response.
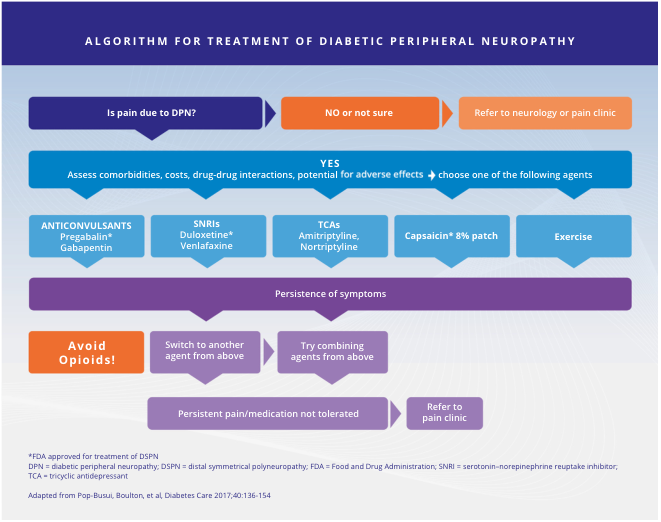
Summary : This flowchart presents an algorithm for the treatment of diabetic peripheral neuropathy (DPN), guiding clinicians through decision-making steps for pain management, agent selection, and escalation of care based on symptom persistence and medication tolerance. flowchart: # Nodes : • "Is pain due to DPN?" (hexagon) • "NO or not sure" (rectangle) • "Refer to neurology or pain clinic" (rectangle) • "YES" (rectangle) • "Assess comorbidities, costs, drug-drug interactions, potential for adverse effects ➔ choose one of the following agents" (rectangle) • "ANTICONVULSANTS Pregabalin* Gabapentin" (rectangle) • "SNRIs Duloxetine* Venlafaxine" (rectangle) • "TCAs Amitriptyline, Nortriptyline" (rectangle) • "Capsaicin* 8% patch" (rectangle) • "Exercise" (rectangle) • "Persistence of symptoms" (rectangle) • "Avoid Opioids!" (rectangle, orange) • "Switch to another agent from above" (rectangle) • "Try combining agents from above" (rectangle) • "Persistent pain/medication not tolerated" (rectangle) • "Refer to pain clinic" (rectangle) # Connectors : • Arrow from "Is pain due to DPN?" to "NO or not sure" and "YES". • Arrow from "NO or not sure" to "Refer to neurology or pain clinic". • Arrow from "YES" to "Assess comorbidities..." and then to five agent options: "ANTICONVULSANTS", "SNRIs", "TCAs", "Capsaicin* 8% patch", "Exercise". • Arrows from all five agent options to "Persistence of symptoms". • Arrow from "Persistence of symptoms" to "Avoid Opioids!", "Switch to another agent from above", and "Try combining agents from above". • Arrow from "Switch to another agent from above" and "Try combining agents from above" to "Persistent pain/medication not tolerated". • Arrow from "Persistent pain/medication not tolerated" to "Refer to pain clinic". # Layout : • Top-down, stepwise progression. • Initial decision node at top, branching to referral or treatment assessment. • Five parallel agent options in the middle. • Symptom persistence leads to further branching for agent switching, combination, or referral. • Orange highlight for "Avoid Opioids!" as a warning. # Additional Information : • Footnotes: *FDA approved for treatment of DSPN. • Abbreviations: DPN = diabetic peripheral neuropathy; DSPN = distal symmetrical polyneuropathy; FDA = Food and Drug Administration; SNRI = serotonin-norepinephrine reuptake inhibitor; TCA = tricyclic antidepressant. • Source: Adapted from Pop-Busui, Boulton, et al, Diabetes Care 2017;40:136-154. # Analysis : • The algorithm prioritizes non-opioid agents for pain management in DPN, with anticonvulsants, SNRIs, TCAs, topical capsaicin, and exercise as first-line options. • If symptoms persist, clinicians are advised to avoid opioids, switch agents, or combine therapies. • Persistent pain or intolerance to medication prompts referral to a pain clinic. • The flowchart emphasizes assessment of comorbidities and adverse effects before agent selection, and provides clear escalation steps for refractory cases.
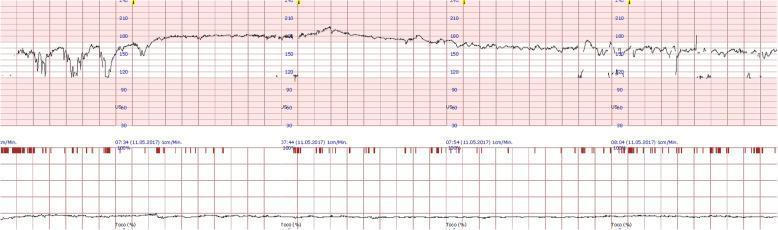
This diagnostic image shows a continuous fetal cardiotocography (CTG) tracing at 27 weeks of gestation, illustrating the impact and subsequent resolution of maternal diabetic ketoacidosis (DKA) on fetal well-being. The top panel displays the fetal heart rate (FHR) in beats per minute (bpm), while the bottom panel shows tocodynamometry (maternal uterine activity). The initial 30-minute segment (left side) demonstrates pathological features: a baseline tachycardia exceeding 160 bpm, significantly reduced baseline variability (flattened tracing), and repetitive variable decelerations characterized by sharp, transient drops in FHR. These findings are clinically significant as they reflect fetal stress or hypoxia secondary to maternal metabolic derangement. Following medical intervention (saline and insulin), the latter half of the tracing shows a clear normalization: the FHR baseline stabilizes around 150-160 bpm, normal beat-to-beat variability reappears, and decelerations resolve. This timeline-based progression serves as an educational example of how maternal acute illness affects fetal heart rate patterns and the rapid response to appropriate clinical stabilization.
Diabetic Ketoacidosis (DKA) - Harrison's Protocol
Classification of Severity
| Severity | pH | Serum HCO3- | Mental Status |
|---|---|---|---|
| Mild | 7.25-7.30 | 15-18 mEq/L | Normal |
| Moderate | 7.0-7.25 | 10-15 mEq/L | Mildly reduced |
| Severe | <7.0 | <10-15 mEq/L | Reduced/coma |
Laboratory Values at Presentation
| Parameter | DKA | HHS | Euglycemic-DKA |
|---|---|---|---|
| Glucose | 250-600 mg/dL | 600-1200 mg/dL | 100-250 mg/dL |
| Sodium | 125-135 mEq/L | 135-145 mEq/L | Normal |
| Potassium | Normal to ↑ | Normal | Normal to ↑ |
| Serum β-hydroxybutyrate | >3.0 mmol/L | <1.0 mmol/L | >3.0 mmol/L |
| HCO3- | <18 mEq/L | >18 mEq/L | <18 mEq/L |
| Arterial pH | 6.8-7.3 | >7.3 | <7.3 |
| Arterial PCO2 | 20-30 mmHg | Normal | 20-30 mmHg |
| Osmolality | >300 mOsm/mL | >300 mOsm/mL | Normal |
Harrison's Management Protocol (Table 416-9)
Step 1 - Confirm Diagnosis
- Elevated serum glucose
- Elevated serum β-hydroxybutyrate (>3.0 mmol/L)
- Metabolic acidosis (anion gap)
Step 2 - Admit
- ICU for severe DKA
- Step-down unit with close monitoring for mild-moderate DKA
Step 3 - Initial Assessment
Step 4 - Fluid Replacement
- 2-3 L of 0.9% normal saline (NS) or Lactated Ringer's at 10-20 mL/kg/hour
- Note: Lactated Ringer's is associated with more rapid DKA resolution and reduced hyperchloremia risk
- Switch to 0.45% saline at 250-500 mL/h once hemodynamically stable with adequate urine output
- Change to 5-10% dextrose + 0.45% saline or Lactated Ringer's at 150-250 mL/h
- Total fluid deficit is often 3-5 L, replaced over 24 h
Step 5 - Insulin
Do not start insulin until K+ ≥ 3.5 mEq/L - correct hypokalemia first
- Bolus: 0.1 units/kg regular insulin IV
- Infusion: 0.1 units/kg/hour by continuous IV infusion
- If no response within 2-4 hours, increase 2-3 fold
- Target glucose fall: 50-75 mg/dL/hour (avoid >100 mg/dL/hour to prevent osmotic encephalopathy)
- 0.1 unit/kg rapid-acting insulin analogue SC, then either:
- 0.1 unit/kg every 1 hour, OR
- 0.2 unit/kg every 2 hours
- Continue insulin + dextrose infusion to prevent hypoglycemia until:
- Anion gap closed, HCO3- >15 mEq/L, AND clinical improvement
- Reduce insulin infusion to 0.05 units/kg/hour when glucose <250 mg/dL (if using two-bag method)
- Give SC basal insulin ~2 hours before stopping IV infusion to prevent rebound hyperglycemia
Step 6 - Potassium Replacement
| Serum K+ | Action |
|---|---|
| <3.5 mEq/L | Hold insulin; give 20-40 mEq/h KCl IV; recheck before starting insulin |
| 3.5-5.0 mEq/L | Add 20-40 mEq K+ to each liter of IV fluid |
| >5.0 mEq/L | Do not supplement; recheck every 2 h |
Step 7 - Bicarbonate
- pH <6.9
- Administer: 100 mEq NaHCO3 in 400 mL sterile water + 20 mEq KCl over 2 hours; may repeat if pH still <6.9
Step 8 - Phosphate
- Not routinely supplemented
- Consider if phosphate <1.0 mg/dL, cardiac dysfunction, hemolytic anemia, or respiratory depression
- If needed: 20-30 mEq potassium phosphate added to replacement fluids
Step 9 - Identify and Treat the Precipitant
- Infection (most common - check even without fever)
- Insulin omission or pump failure
- New-onset T1DM
- Myocardial infarction
- Pancreatitis
- Medications (SGLT2 inhibitors - causes euglycemic DKA)
Step 10 - Monitoring (Comprehensive Flow Sheet)
| Parameter | Frequency |
|---|---|
| Vital signs, fluid I&O | Every 1-2 h |
| Serum glucose | Every 1 h |
| Serum electrolytes, BUN, creatinine | Every 2-4 h |
| Venous pH / β-hydroxybutyrate | Every 2-4 h |
| Anion gap | Every 4 h |
| Urine output | Every 1 h (catheterize if needed) |
Resolution Criteria
- Glucose <200 mg/dL
- Serum HCO3- ≥15 mEq/L
- Venous pH >7.3
- Anion gap closed (<12 mEq/L)
Special Considerations
Airway/Respiratory
Euglycemic DKA (SGLT2i-associated)
- Glucose may be near-normal (100-250 mg/dL)
- Do NOT withhold insulin
- Start dextrose infusion early alongside insulin
- Higher index of suspicion needed - check β-hydroxybutyrate even with near-normal glucose
Cerebral Edema
- Most serious complication, seen primarily in children
- Avoid correcting glucose faster than 100 mg/dL/hour
- Avoid overly rapid fluid replacement
Transition to Subcutaneous Insulin
- Give SC basal insulin 2 hours before stopping IV drip
- Patient must be able to eat before switching
- Restart pre-admission regimen or calculate appropriate new doses