
Arterial distribution of brain
arterial supply brain circle of Willis anatomy diagram
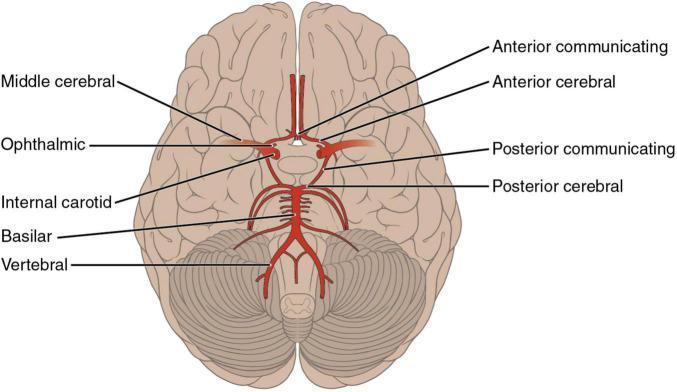
An anatomical diagram illustrating the arterial supply of the brain from an inferior (basal) perspective, specifically highlighting the Circle of Willis and its contributing vessels. The diagram shows the bilateral internal carotid arteries branching into the middle cerebral (MCA) and ophthalmic arteries. Centrally, the anterior cerebral arteries (ACA) are seen originating and coursing medially into the longitudinal fissure, connected by the anterior communicating artery (ACoA). The posterior circulation is depicted with the vertebral arteries merging into the basilar artery, which subsequently divides into the posterior cerebral arteries (PCA). Posterior communicating arteries (PCoA) are shown forming the critical anastomotic link between the internal carotid and posterior cerebral systems. The diagram is superimposed on the ventral surface of the brain, demonstrating the spatial relationship of these vessels to the frontal, temporal, and occipital lobes, as well as the cerebellum and brainstem. This illustration is an educational resource for understanding neurovascular anatomy and the territories susceptible to ischemic stroke.
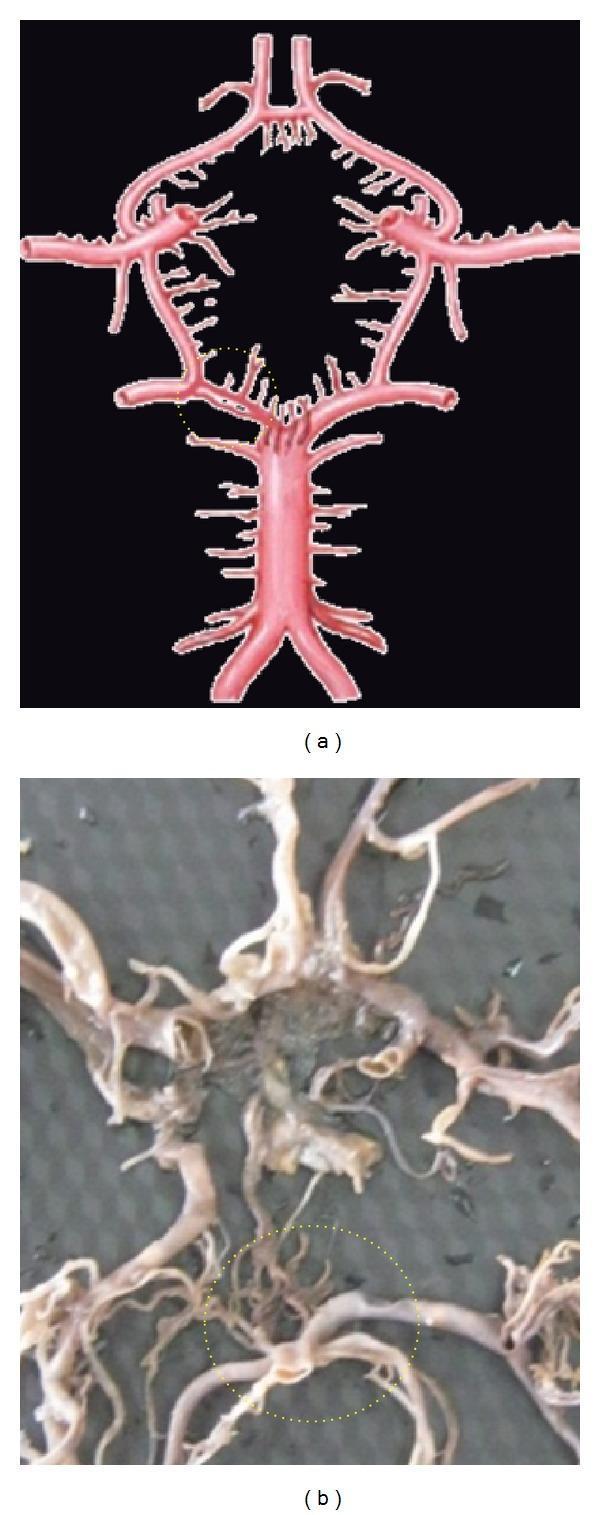
The image consists of two panels (a and b) illustrating the anatomy of the Circle of Willis at the base of the brain. Panel (a) is an anatomical diagram showing a standard arterial configuration with a dotted yellow circle highlighting the junction of the basilar artery and the posterior cerebral artery (PCA). Panel (b) is a clinical photograph of a post-mortem anatomical specimen showing the cerebral vasculature. A dotted yellow circle in panel (b) highlights a vascular anomaly: a duplication of the P1 segment of the posterior cerebral artery. In this region, the arterial pathway consists of two parallel, distinct vascular channels rather than a single vessel. The broader anatomical context displays the basilar artery, internal carotid arteries (ICA), anterior cerebral arteries (ACA), and communicating arteries (ACoA and PCoA). The image is intended for medical education in neuroanatomy and neuroradiology to demonstrate normal anatomical variants and congenital anomalies of the cerebral collateral circulation.
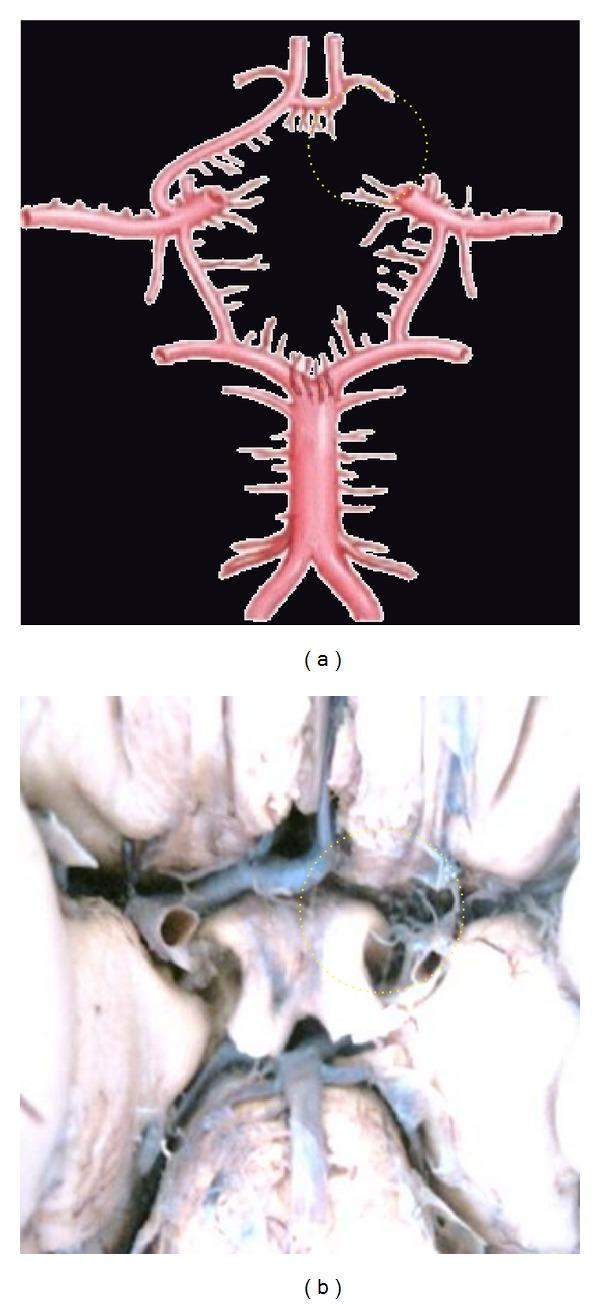
This medical visual content consists of an anatomical diagram (a) and a corresponding clinical photograph of a cadaveric dissection (b) illustrating neurovascular anatomy. The focus is on the Circle of Willis, specifically demonstrating a congenital vascular variation known as aplasia of the A1 segment of the anterior cerebral artery (ACA). In both panels, a yellow dotted circle highlights the area where the right A1 segment should connect the internal carotid artery to the anterior communicating artery (ACoA). The absence of this segment results in an incomplete Circle of Willis, which has clinical significance for collateral cerebral blood flow. The diagram (a) clearly depicts the major components of the cerebral arterial circle, including the basilar artery, posterior cerebral arteries, internal carotid arteries, and the intact left A1 and A2 segments. The clinical photograph (b) provides a real-world view of the same anatomical deficiency at the base of the brain. This material is designed for advanced medical education in neuroanatomy and radiology, emphasizing common vascular anomalies.
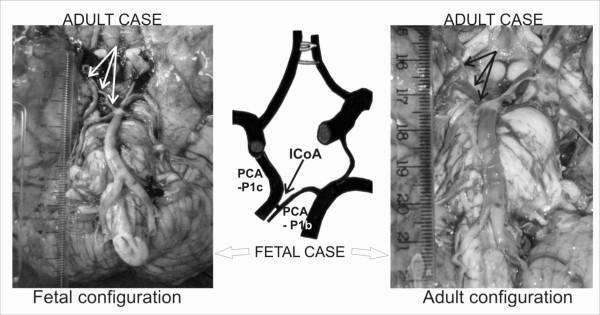
This composite educational resource compares anatomical configurations of the Circle of Willis (CoW) in fetal and adult cadaveric specimens. The image consists of two clinical photographs of brain base specimens and a central schematic diagram focusing on the posterior segment of the cerebral arterial circle. The 'Fetal configuration' (left) shows the ventral brainstem and diencephalon with visible vasculature. The accompanying central schematic labels the pre-communicating part of the carotid origin (PCA-P1c) and the pre-communicating part of the basilar origin (PCA-P1b), connected by an 'intermediate communicating artery' (ICoA). This configuration highlights an accessory vascular bridge within the P1 segment of the posterior cerebral artery. The 'Adult configuration' (right) illustrates a more mature vascular pattern with larger calibres and increased tortuosity. Arrows point to the bifurcation sites and anatomical segments. The comparison focuses on the morphological evolution and persistence of the ICoA, which can influence the hemodynamics of the posterior circulation. This material serves as a reference for anatomical variations in neurovascular anatomy and surgical planning.
Arterial Distribution of the Brain
Overview: Two Circulations
- Anterior (carotid) circulation - via the internal carotid arteries (ICA)
- Posterior (vertebrobasilar) circulation - via the vertebral arteries
Circle of Willis
- Anterior communicating artery (ACoA) - connects the two anterior cerebral arteries
- Two anterior cerebral arteries (ACA) - A1 segments
- Two internal carotid arteries (supraclinoid segments)
- Two posterior communicating arteries (PCoA) - link the ICA to the PCAs
- Two posterior cerebral arteries (PCA) - P1 segments
- Goldman-Cecil Medicine, p. 3923
Anterior Circulation (Carotid System)
1. Ophthalmic Artery
2. Anterior Choroidal Artery
-
Arises from the supraclinoid ICA, distal to the PCoA
-
Supplies: optic tract, anterior hippocampus, amygdala, tail of the caudate, lateral geniculate body, posterior limb of the internal capsule
-
Infarcts here mimic MCA territory strokes (cause contralateral hemiparesis)
-
Neuroanatomy through Clinical Cases 3rd Ed., p. 420
3. Posterior Communicating Artery (PCoA)
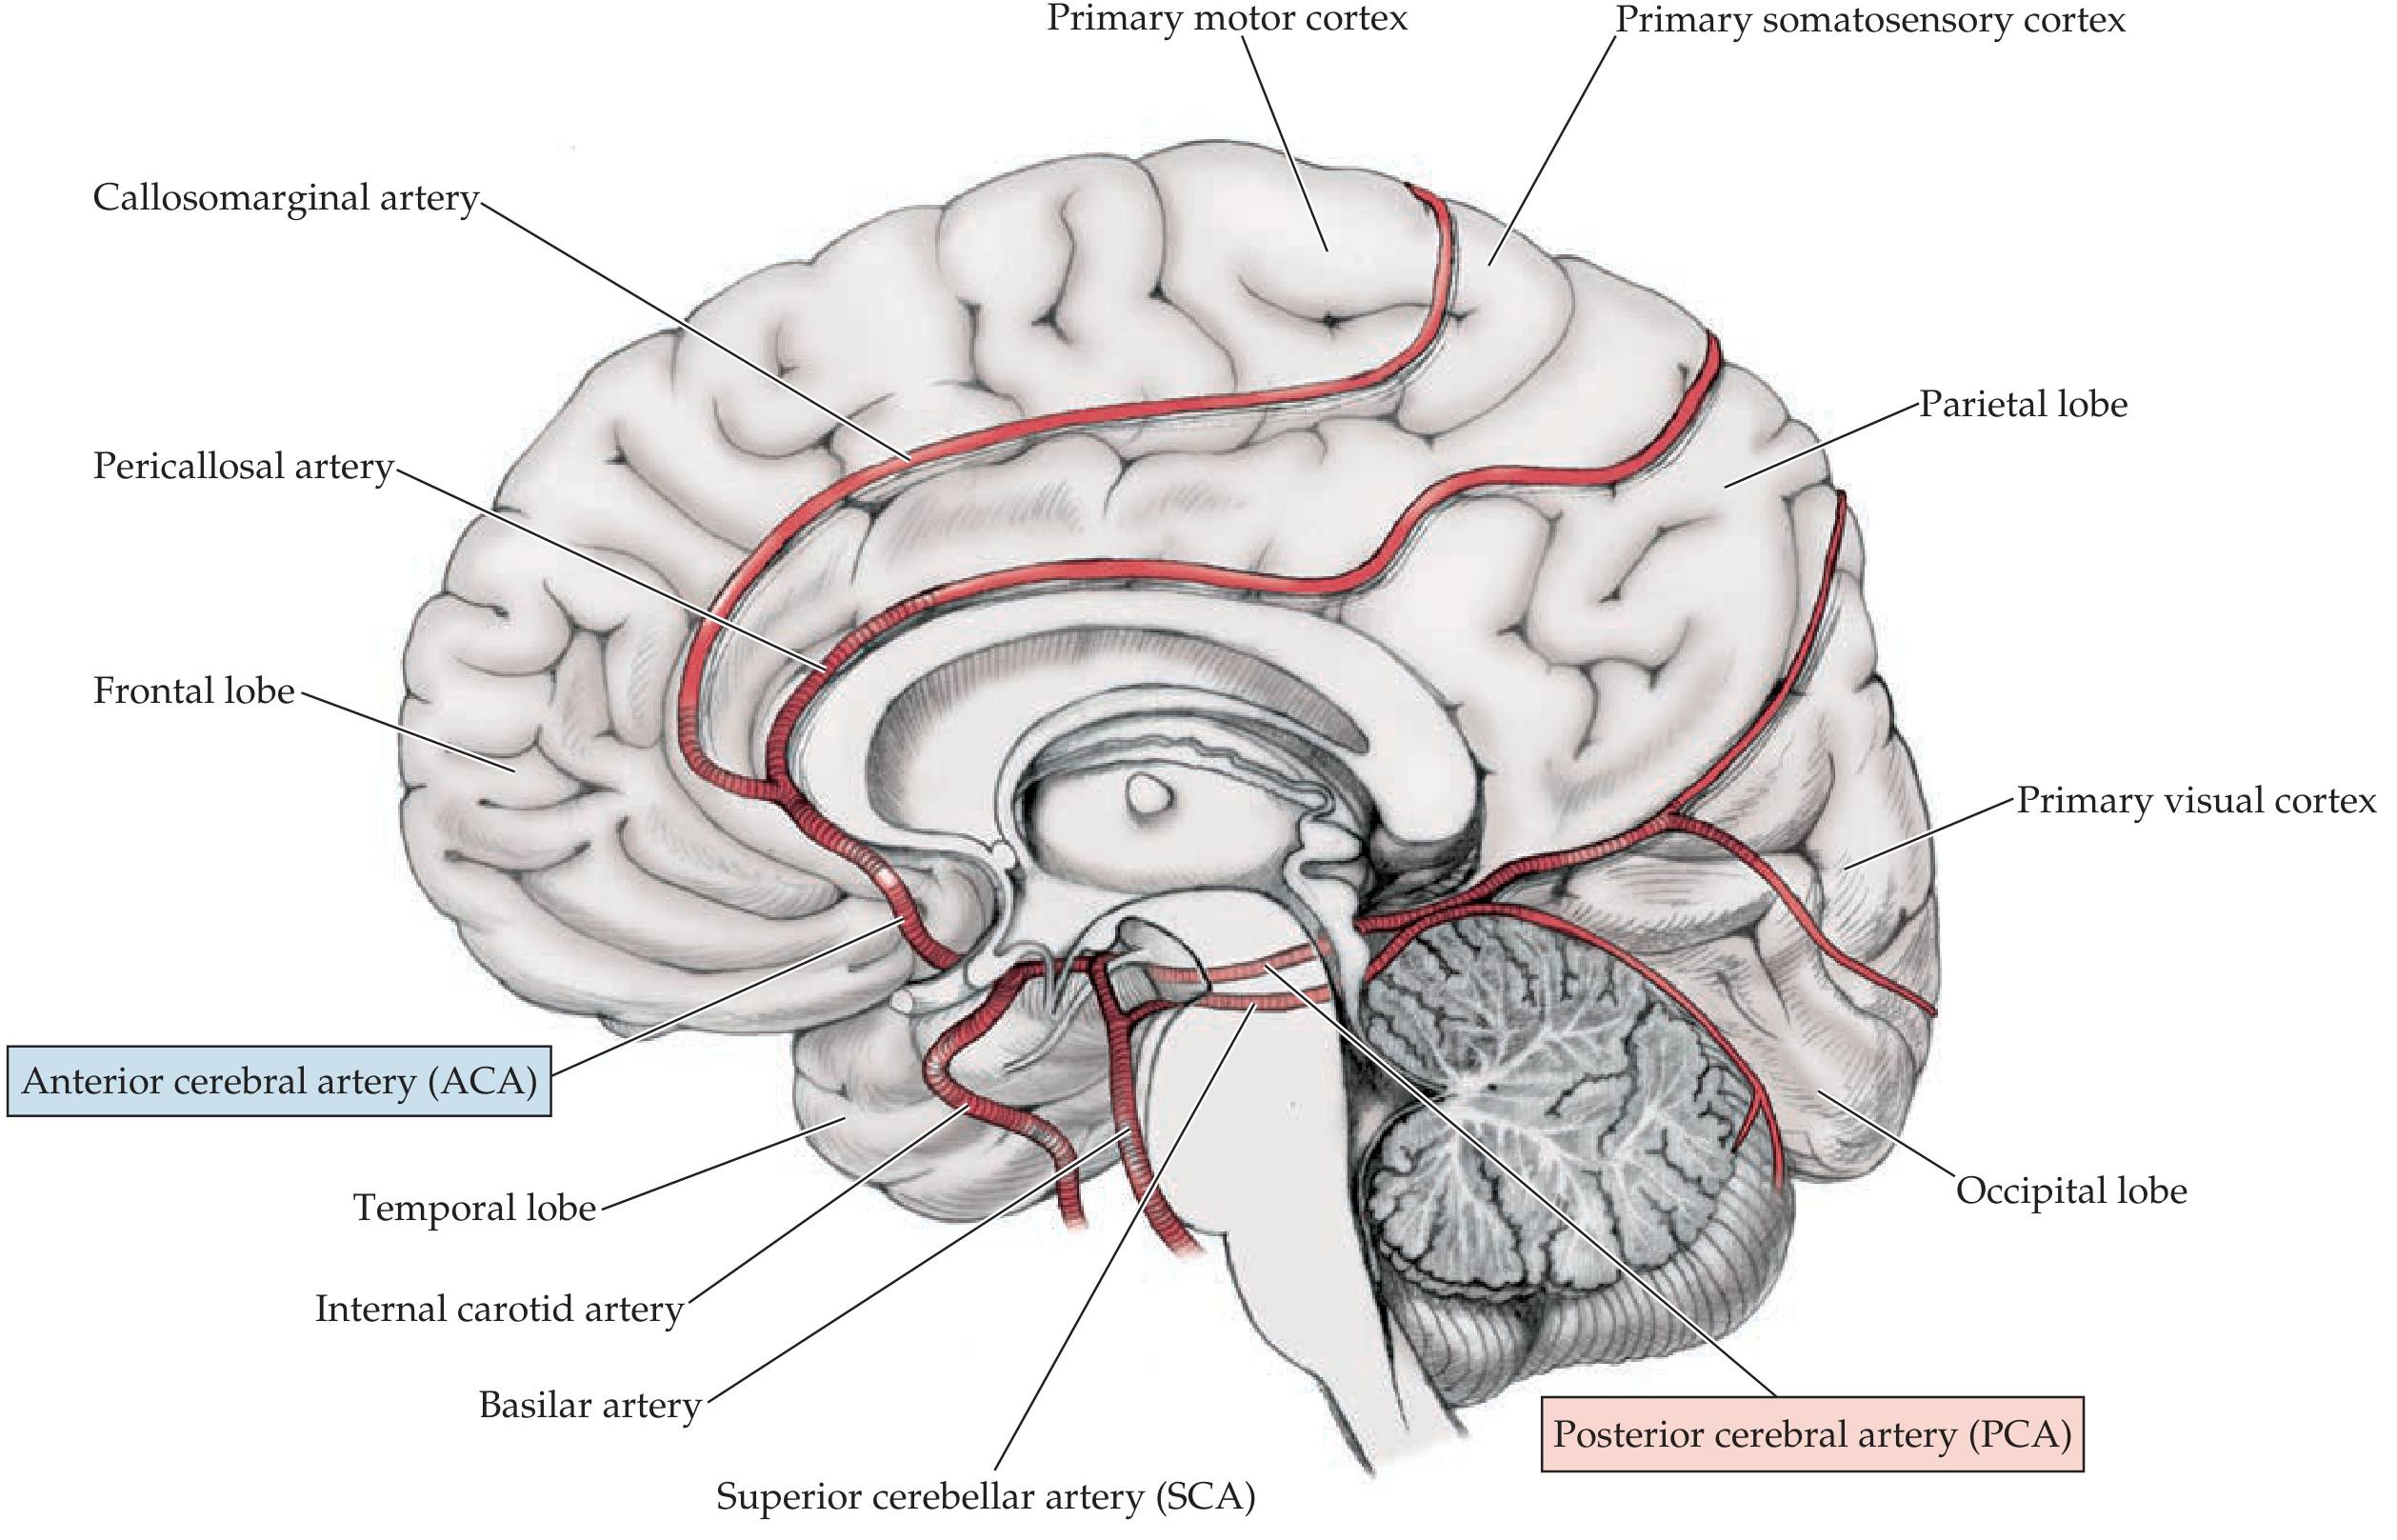
4. Anterior Cerebral Artery (ACA)
-
Lenticulostriate arteries (from A1 and A2 segments)
-
Recurrent artery of Heubner (large medial striate artery) - supplies anterior/inferior internal capsule, head of caudate, anterior putamen, globus pallidus, hypothalamus, olfactory bulbs and tracts
-
Goldman-Cecil Medicine, p. 3923
5. Middle Cerebral Artery (MCA)
- Superior division: lateral frontal lobe and parietal lobe above the Sylvian fissure (face and arm sensorimotor cortex, Broca's area)
- Inferior division: lateral temporal lobe (Wernicke's area)
-
Supplies head and body of caudate, putamen, globus pallidus
-
Anterior limb, genu, and superior posterior limb of the internal capsule
-
Goldman-Cecil Medicine, p. 3924; Neuroanatomy through Clinical Cases, p. 420
Posterior Circulation (Vertebrobasilar System)
Vertebral Artery Branches
- Posterior inferior cerebellar artery (PICA) - arises from the vertebral artery at the level of the medulla; supplies the lateral medulla and inferior cerebellum (occlusion = Wallenberg syndrome)
- Anterior spinal artery - both vertebrals contribute; supplies the medial medulla and ventral spinal cord
- Posterior spinal artery
Basilar Artery Branches
- Anterior inferior cerebellar artery (AICA) - from proximal basilar; supplies lateral caudal pons and a small part of cerebellum
- Superior cerebellar artery (SCA) - from the top of the basilar at the level of the rostral pons; supplies the superior cerebellum and a region of the rostral laterodorsal pons
- Paramedian perforating branches - supply the medial pons and midbrain
- Posterior cerebral artery (PCA) - terminal branch of the basilar
- Neuroanatomy through Clinical Cases 3rd Ed., p. 676-677
Posterior Cerebral Artery (PCA)
- Anterior division: inferior and medial temporal lobe (parahippocampal gyrus)
- Posterior division: occipital lobe including the calcarine cortex (primary visual cortex)
-
Thalamoperforator arteries - supply the thalamus
-
Thalamogeniculate arteries
-
Posterior choroidal arteries
-
Supplies most of the thalamus, midbrain, and medial occipital/temporal lobes
-
Goldman-Cecil Medicine, p. 3924
Vascular Territories at a Glance
Cortical Territories (three views)
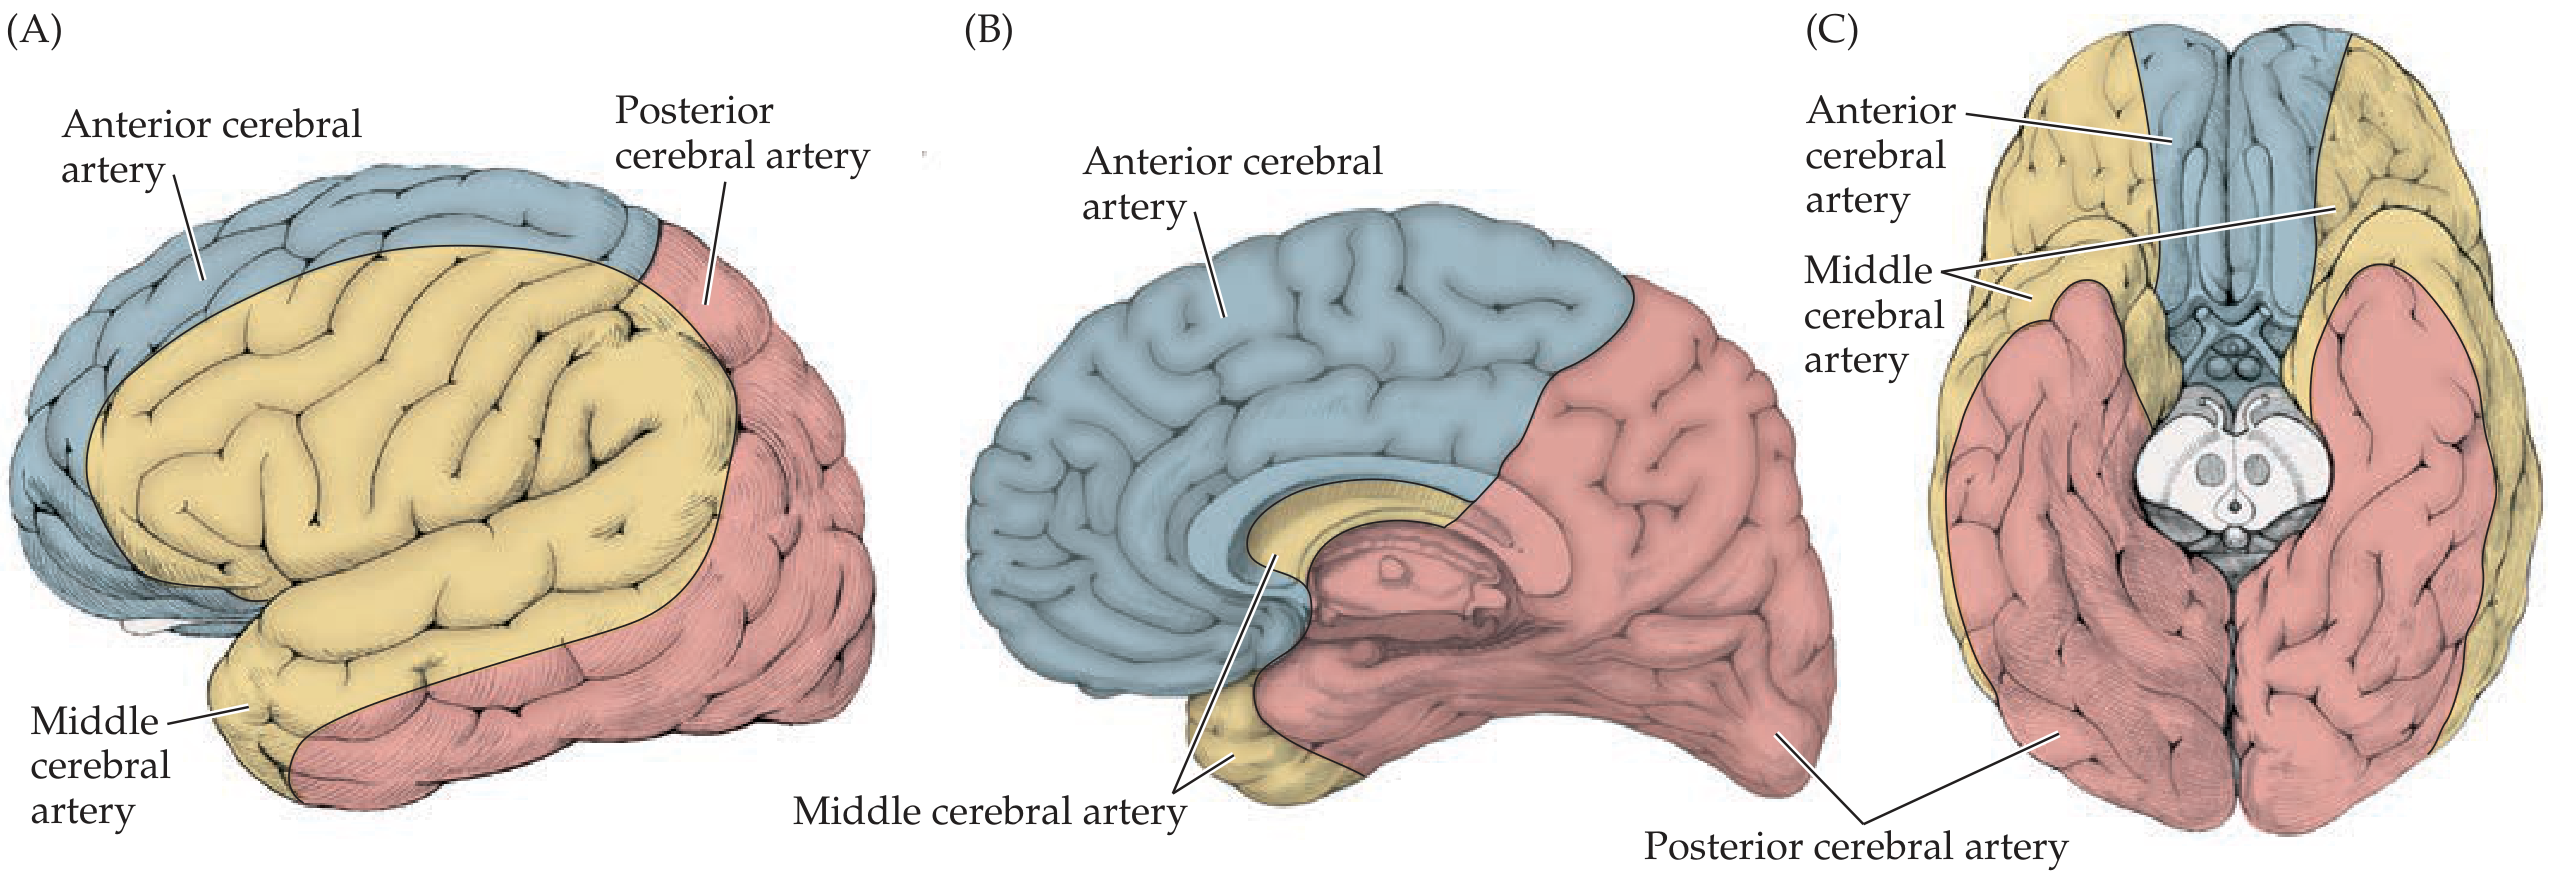
| Artery | Cortical Territory | Key Deep Territory |
|---|---|---|
| ACA | Medial frontal + parietal (leg area) | Caudate head, anterior internal capsule (via Heubner) |
| MCA | Entire lateral convexity (face, arm area, language) | Caudate, putamen, globus pallidus, genu + anterior limb IC |
| PCA | Medial/inferior temporal + occipital (visual cortex) | Thalamus, midbrain (via perforators) |
| PICA | Cerebellum (inferior) | Lateral medulla |
| AICA | Cerebellum (anteroinferior) | Lateral caudal pons |
| SCA | Cerebellum (superior) | Rostral lateral pons |
Brainstem Supply: Key Principle
- Paramedian region - short perforating branches from the vertebral/basilar artery (or anterior spinal artery at medullary level)
- Lateral region - long circumferential branches (PICA, AICA, SCA) and their penetrating branches
Collateral Circulation
-
Circle of Willis: Complete in only ~40% of individuals; provides intracranial collateral flow
-
Leptomeningeal (pial) collaterals: Provide flow across vascular border zones between ACA/MCA and MCA/PCA territories ("watershed" zones)
-
Extracranial-intracranial anastomoses: e.g., external carotid to ophthalmic artery (retrograde to ICA)
-
Grainger & Allison's Diagnostic Radiology
Spinal cord injuries
spinal cord injury syndromes incomplete complete ASIA classification diagram
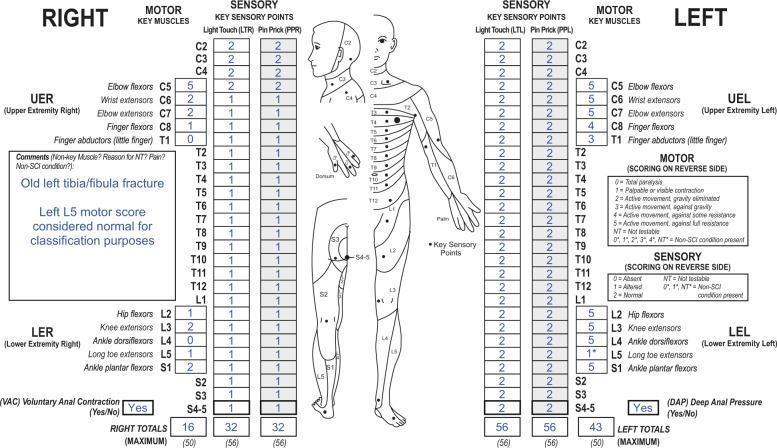
This infographic presents a standardized International Standards for Neurological Classification of Spinal Cord Injury (ISNCSCI) worksheet, also known as the ASIA (American Spinal Injury Association) chart. The diagram illustrates a neurological examination of a patient with a spinal cord injury (SCI) and a superimposed non-SCI condition (old left tibia/fibula fracture). It displays motor and sensory scores for the right and left sides across C2 to S4-5 segments. Sensory evaluation includes light touch and pin prick scores, while motor evaluation covers key muscle groups in the upper (C5-T1) and lower (L2-S1) extremities. A central anatomical diagram maps dermatomes and key sensory points. Specific findings highlight a motor score of 1* for the left L5 (long toe extensor), with a comment box indicating this should be treated as normal for classification due to the peripheral injury. The worksheet includes binary assessments for Voluntary Anal Contraction (VAC) and Deep Anal Pressure (DAP), as well as calculated total scores for motor and sensory function, serving as a critical diagnostic tool for determining the Neurological Level of Injury (NLI) and ASIA Impairment Scale (AIS) grade.
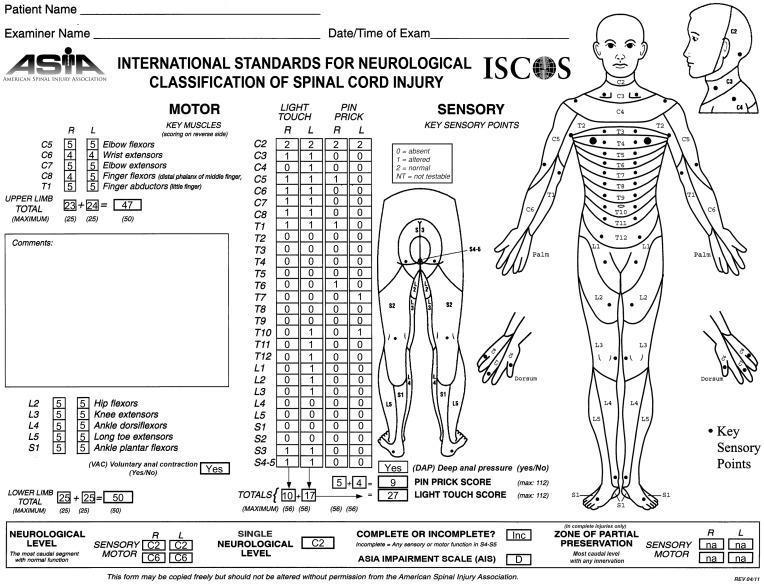
This is a completed International Standards for Neurological Classification of Spinal Cord Injury (ISNCSCI) form, commonly known as the ASIA (American Spinal Injury Association) Impairment Scale. The document consists of structured data tables and anatomical diagrams used to assess motor and sensory function following a spinal cord injury. The 'Motor' section evaluates key muscle groups for the upper (C5-T1) and lower (L2-S1) limbs on a 0-5 scale. This patient exhibits significant motor recovery, scoring 47/50 in the upper limb and 50/50 in the lower limb. The 'Sensory' section records light touch and pin prick scores for dermatomes C2-S4/5, using a 0-2 scale (absent, altered, normal). Sensory recovery is notably more limited than motor, with total scores of 27 for light touch and 9 for pin prick, indicating incomplete and asymmetric sensory preservation. The anatomical diagrams illustrate key sensory points across the body. The final assessment classifies the injury as an ASIA Impairment Scale (AIS) grade D, representing an incomplete spinal cord injury with preserved motor function below the neurological level.
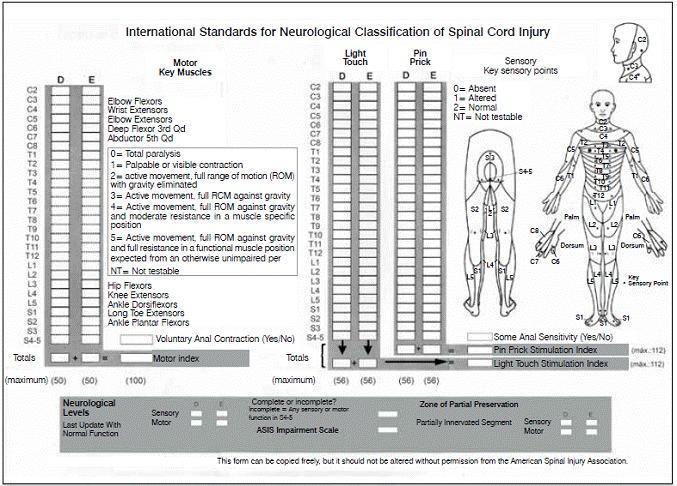
Educational infographic and clinical assessment form titled 'International Standards for Neurological Classification of Spinal Cord Injury (ISNCSCI)', commonly known as the ASIA Impairment Scale. The visual includes a structured data entry form for documenting neurological levels (C2 through S4-5) across motor and sensory domains. The 'Motor Key Muscles' section uses a 0-5 numerical scale to evaluate muscle strength, specifically listing indicators such as elbow flexors (C5), wrist extensors (C6), and ankle plantar flexors (S1). The 'Sensory Key Points' section includes two dermatome maps (anterior and posterior views of the human body) highlighting specific points for testing Light Touch and Pin Prick sensations, scored on a 0-2 scale (0=Absent, 1=Altered, 2=Normal). The form provides sections for calculating Motor and Sensory indices and determining the ASIA Impairment Scale grade (A-E). This diagnostic tool is used in neurology and orthopedics to standardize the evaluation of spinal cord injury severity and recovery progression.
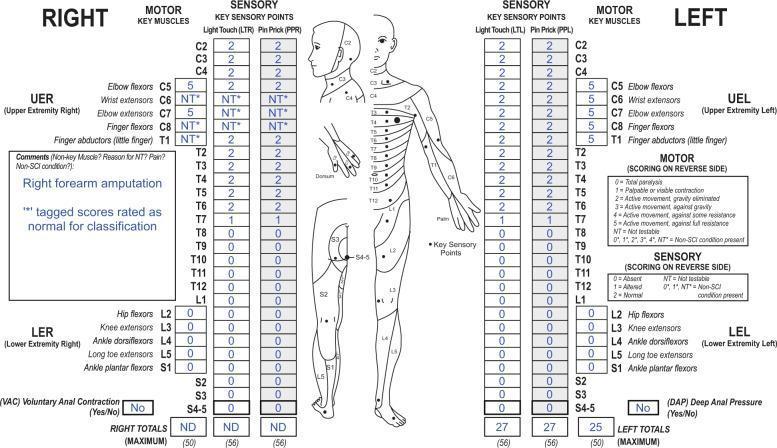
An ISNCSCI (International Standards for Neurological Classification of Spinal Cord Injury) assessment worksheet documenting a mid-thoracic spinal cord injury. The central diagram displays human dermatomes and key sensory points. The worksheet records bilateral motor and sensory scores (Light Touch and Pin Prick) from C2 to S4-5. In this specific clinical case, the right upper extremity sections (C6, C7, C8, and T1) contain 'NT*' (Not Testable) notations due to a right forearm amputation, with a comment indicating these should be treated as normal for classification purposes. Sensory and motor levels show normal function (score 2 or 5) down to T6, followed by impaired sensation (score 1) at T7 and complete loss of function (score 0) from T8 through the sacral segments. Sacral sparing indicators—Voluntary Anal Contraction (VAC) and Deep Anal Pressure (DAP)—are marked as 'No'. The image illustrates the methodology for classifying spinal cord injuries when confounded by non-SCI-related physical impairments like amputation.
spinal cord cross section tracts Brown-Sequard hemisection diagram
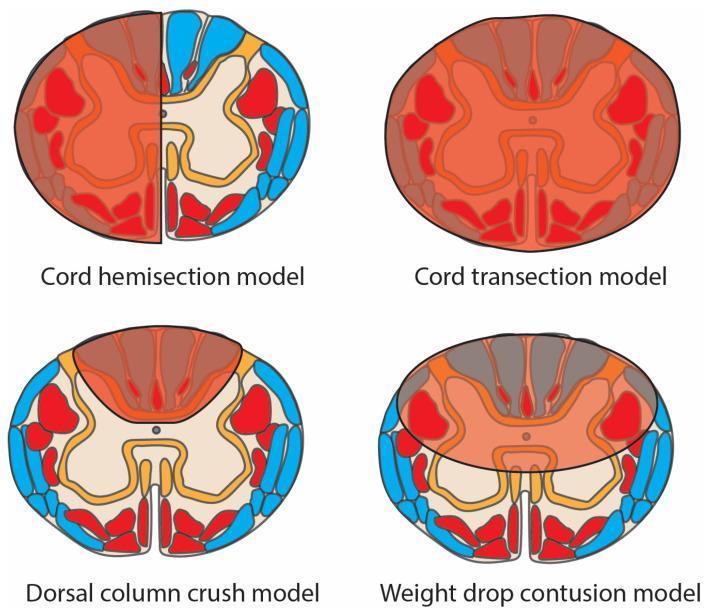
This medical schematic diagram illustrates four pre-clinical spinal cord injury (SCI) models in axial cross-section, highlighting damaged regions (translucent red overlay), motor tracts (opaque red), and sensory tracts (blue). 1. Cord Hemisection Model: Shows damage isolated to one lateral half of the spinal cord, characteristic of Brown-Séquard syndrome, affecting both motor and sensory tracts on the ipsilateral side. 2. Cord Transection Model: Depicts complete injury across the entire cord diameter, resulting in total disruption of all motor and sensory pathways. 3. Dorsal Column Crush Model: Features localized damage concentrated in the posterior (dorsal) funiculus, primarily affecting ascending sensory tracts. 4. Weight Drop Contusion Model: Displays a diffuse, central injury zone impacting the grey matter and surrounding white matter tracts, simulating clinical traumatic contusion. The diagram serves as an educational tool for comparing injury patterns across experimental models used in neurotrauma research and their resulting impact on anatomical tracts.
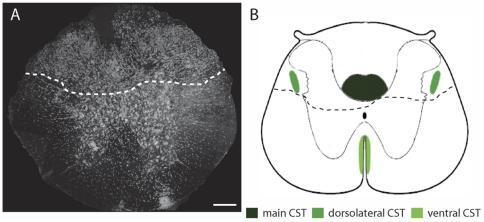
This figure provides a detailed anatomical and schematic overview of a dorsal hemisection of the thoracic spinal cord (T8 level), focusing on the corticospinal tract (CST). Panel A is a confocal microscopy image of a spinal cord cross-section counterstained with Neurotrace. A white dashed line delineates the lesion border, showing a clear separation between the dorsal area affected by the hemisection and the intact ventral region. Panel B is a corresponding schematic diagram illustrating the anatomical distribution of CST components. It highlights the main CST (dark green) located at the base of the dorsal funiculus, the dorsolateral CST (medium green) in the lateral funiculus, and the ventral CST (light green) near the ventral midline. The dashed line in the schematic reflects the lesion from Panel A, demonstrating that a dorsal hemisection interrupts the main and dorsolateral CST components while leaving the ventral CST spared. This visual is designed to teach the structural consequences of spinal cord injury on descending motor pathways.
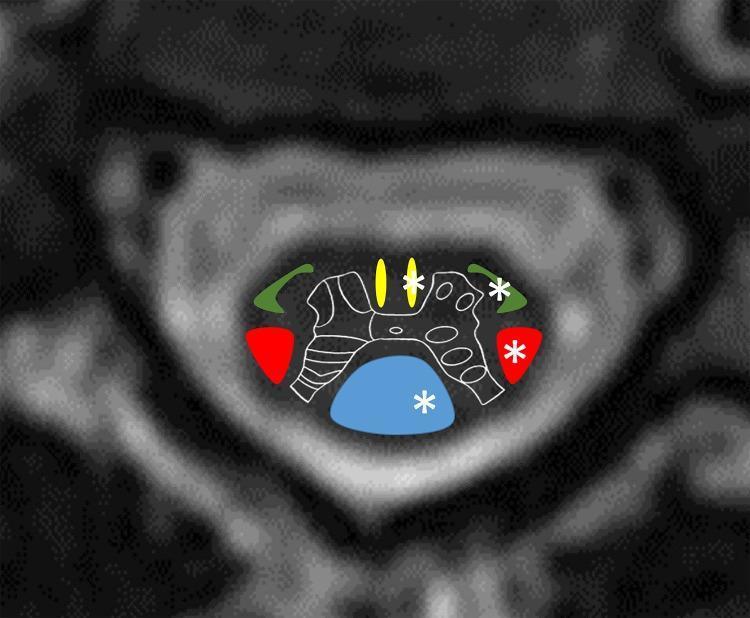
This composite diagnostic image features an axial cross-sectional graphic of the cervical spinal cord anatomy superimposed on a radiological background. The illustration uses color-coded regions to delineate primary white matter tracts: the dorsal column-medial lemniscus system is shown in blue (posteriorly), the lateral corticospinal tracts in red (laterally), the anterior corticospinal tracts in yellow (medial-anteriorly), and the anterolateral system (spinothalamic tract) in green (anterolaterally). A white outline represents the central grey matter of the spinal cord. White asterisks are strategically placed on the left hemicord tracts (blue, red, yellow, and green regions) to indicate the site of anatomical damage associated with a left-sided spinal cord lesion. This visual aid is designed to explain the pathophysiology of Brown-Séquard syndrome, illustrating how a hemicord injury affects specific ascending and descending pathways, leading to ipsilateral motor/proprioceptive loss and contralateral pain/temperature loss.
Spinal Cord Injuries (SCI)
Epidemiology & Mechanisms
- Motor vehicle accidents (most common)
- Falls (especially in elderly with pre-existing cervical stenosis)
- Sports injuries (diving, contact sports)
- Penetrating trauma (gunshot/stab wounds - typical cause of Brown-Séquard)
- Iatrogenic (aortic surgery, spinal instrumentation)
Pathophysiology
Primary Injury
Secondary Injury
-
Vasospasm and thrombosis of small arterioles
-
Extension of cord edema
-
Disruption of blood-brain/spinal cord barrier
-
Peripheral immune cell infiltration causing neuroinflammation
-
Destruction of intra-axonal structures and release of neurotoxic proteins
-
Goldman-Cecil Medicine, p. 3825
Classification: Complete vs. Incomplete
- Complete SCI: No motor or sensory function preserved below the injury level, including the sacral segments (S4-S5). Absence of sacral sparing.
- Incomplete SCI: Some sensory or motor function is preserved below the neurological level, including sacral segments. The key test is preservation of perianal sensation (sacral sparing).
ASIA Impairment Scale (AIS)
| Grade | Description |
|---|---|
| A | Complete - No sensory or motor function in S4-S5 |
| B | Sensory incomplete - Sensory but NO motor below level |
| C | Motor incomplete - Motor preserved; >half key muscles grade <3 |
| D | Motor incomplete - Motor preserved; ≥half key muscles grade ≥3 |
| E | Normal - Normal motor and sensory function |
- Bailey & Love's Short Practice of Surgery, p. 424
Acute Phenomena
Spinal Shock
- Flaccid paralysis, hypotonia, hyporeflexia below the lesion
- Duration: typically less than 24 hours, but can last days to weeks (some sources cite up to 6 weeks)
- The return of the bulbocavernosus reflex (anal sphincter contraction on squeezing glans penis or tugging a Foley catheter) marks the end of spinal shock
- After spinal shock resolves: UMN signs emerge (spasticity, hyperreflexia, Babinski)
Neurogenic Shock
-
Occurs with cervical or high thoracic injuries (at or above T5)
-
Mechanism: loss of sympathetic outflow → unopposed vagal tone
-
Clinically: hypotension + bradycardia + warm peripheries (distinguishes it from hypovolemic shock, which causes tachycardia)
-
Treat with vasopressors/inotropes; avoid fluid overload
-
Bailey & Love's Short Practice of Surgery, p. 424; Rosen's Emergency Medicine
Incomplete Spinal Cord Syndromes
1. Central Cord Syndrome (Most Common)
- Motor > sensory deficits
- Upper extremities > lower extremities (arms weaker than legs)
- Distal > proximal weakness
- Variable sensory loss and bladder dysfunction
- Burning dysesthesias in upper extremities may dominate
- Age < 50: >80% regain bladder continence; ~90% regain ambulatory status
- Age > 50: only ~30% regain bladder function; ~50% regain ambulation
2. Brown-Séquard Syndrome (Best Prognosis)
- Ipsilateral: Loss of motor function, proprioception, and vibration sense (dorsal column and corticospinal tract, same side)
- Contralateral: Loss of pain and temperature sensation (spinothalamic fibers cross 1-2 levels above then ascend contralaterally)
- 1-2 segments above the lesion: ipsilateral loss of pain and temperature (before fibers have crossed)
- 80-90% regain bowel and bladder function
- 75% regain ambulatory status
- 70% become independent in ADLs
3. Anterior Cord Syndrome (Worst Prognosis)
- Cervical hyperflexion with cord contusion or disc herniation into the canal
- Thrombosis/infarction of the anterior spinal artery
- Aortic surgery (most common cause of ischemic anterior cord syndrome)
- Complete loss of motor function below the lesion
- Loss of pain and temperature sensation below the lesion
- Preserved: posterior column modalities - proprioception, vibration, crude touch
- Most improvement in the first 24 hours; little thereafter
- Only 10-20% regain some motor function; even then with poor power/coordination
- Patients without motor function at 30 days: near-zero chance of recovery by 1 year
4. Posterior Cord Syndrome (Rare)
- Loss of dorsal column functions: proprioception, vibration, discriminative touch
- Motor function and pain/temperature sensation preserved
Summary Table
| Syndrome | Motor | Pain/Temp | Proprioception/Vibration | Prognosis |
|---|---|---|---|---|
| Central Cord | Arms >> Legs (bilateral) | Variable | Variable | Moderate |
| Brown-Séquard | Ipsilateral loss | Contralateral loss | Ipsilateral loss | Best |
| Anterior Cord | Bilateral loss | Bilateral loss | Preserved | Worst |
| Posterior Cord | Preserved | Preserved | Bilateral loss | Good |
- Rosen's Emergency Medicine; Tintinalli's Emergency Medicine
Conus Medullaris vs. Cauda Equina Syndrome
| Feature | Conus Medullaris (S3-S5, Co1) | Cauda Equina (L1 downward) |
|---|---|---|
| Motor | UMN type bilateral weakness | LMN type, may be unilateral |
| Reflexes | May be brisk | Decreased/absent |
| Bladder | Spastic autonomic bladder → overflow incontinence | Flaccid bladder |
| Saddle anesthesia | Present | Present |
| Onset | May be sudden | Often gradual |
- Rosen's Emergency Medicine, p. 1506
Autonomic Dysreflexia
-
Triggered by noxious stimuli below the injury level (full bladder, bowel impaction, uterine contractions, pressure sores, UTI)
-
Massive sympathetic discharge below the lesion, unmodulated by descending inhibition
-
Presentation: Severe paroxysmal hypertension, bradycardia (reflex), pounding headache, profuse sweating above the level, piloerection, flushing, nasal congestion
-
Occurs in up to 56% of patients with high lesions
-
Treatment: Sit patient upright, identify and remove the trigger (catheterize the bladder first), then pharmacological BP control; spinal/epidural anesthesia is definitive in labor
-
Rosen's Emergency Medicine, p. 3378
Investigations
- CT spine: First-line for bony injury (nearly 100% sensitive for significant bony injuries; replaces plain X-rays in most centers)
- MRI spine: Investigation of choice for ligamentous injury, disc herniation, spinal cord contusion/edema - essential when CT is negative but neurological deficits persist
- Plain X-ray: 3-view series (lateral, AP, odontoid) if CT unavailable; misses 10% of injuries
Management
Acute Phase
- Immobilization - cervical collar, log-roll precautions
- Airway - high cervical injuries (above C4) cause diaphragm paralysis; intubate early
- Hemodynamic support - neurogenic shock: vasopressors (avoid fluid overloading); maintain MAP 85-90 mmHg for first 7 days
- Urinary catheterization
- DVT prophylaxis - high risk due to immobility
Methylprednisolone - Controversial
- Tintinalli's Emergency Medicine; Campbell's Operative Orthopaedics 15th Ed 2026
Surgical
- Urgent decompression for incomplete injuries with ongoing compression or neurological deterioration
- Stabilization for unstable fractures
Rehabilitation
- Multidisciplinary: physiotherapy, occupational therapy, bladder/bowel management, psychology
- The level of neurological impairment determines functional outcome (e.g., C5 injury: can feed self; C7: independent in wheelchair; T1 and below: full independence in wheelchair)
Prognosis
-
Level of injury (cervical worst)
-
Completeness (ASIA A has poorest prognosis)
-
Ventilator dependence
-
Age at injury
-
Bailey & Love's Short Practice of Surgery, p. 424
Clinical anatomy of brainstem
brainstem anatomy cross section medulla pons midbrain cranial nerve nuclei diagram
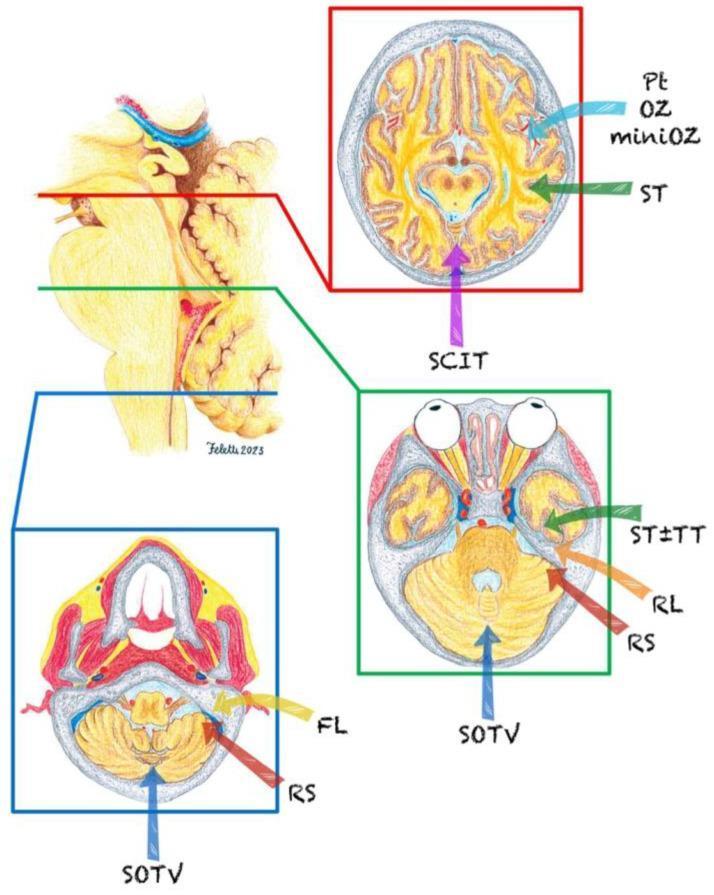
Anatomical and neurosurgical illustration depicting primary surgical approaches to the brainstem, segmented by axial planes. The left side of the image shows a sagittal view of the brainstem and cerebellum, color-coded into three main regions: the midbrain (red), the pons (green), and the medulla (blue). Three corresponding axial cross-sections are displayed on the right, mapped to these regions. The midbrain section (red frame) illustrates the Pterional (Pt), Orbitozygomatic (OZ/miniOZ), Subtemporal (ST), and Supracerebellar Infratentorial (SCIT) approaches. The pons section (green frame) demonstrates the Subtemporal (ST), Transtemporal (TT), Retrolabyrinthine (RL), Retrosigmoid (RS), and Suboccipital Transtelovelar (SOTV) routes. The medulla section (blue frame) highlights the Far Lateral (FL), Retrosigmoid (RS), and Suboccipital Transtelovelar (SOTV) trajectories. Arrows indicate the surgical vectors relative to the neuroanatomy, including the cerebellum, brainstem nuclei, and surrounding cranial structures, serving as a guide for selecting operative corridors based on lesion localization within the brainstem.
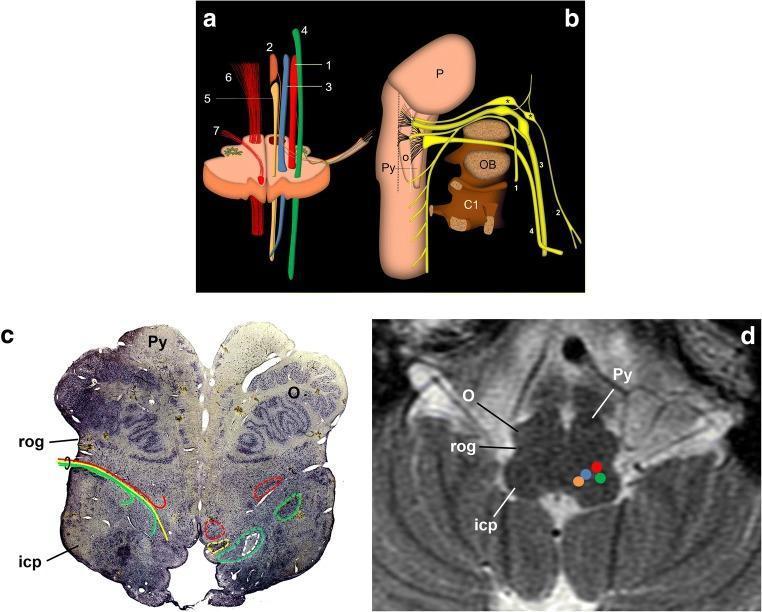
Educational panel illustrating the anatomy of the glossopharyngeal nerve (CN IX) and its relationships in the medulla oblongata. Figure (a) is an anatomical diagram of a transverse section of the medulla at the level of the inferior olive, highlighting efferent nuclei—nucleus ambiguus (1) and inferior salivatory nucleus (2)—and afferent nuclei—solitary nucleus (3) and spinal trigeminal nucleus (4). Other shown structures include the dorsal motor nucleus of vagus (5), pyramidal tract (6), and hypoglossal nerve (7). Figure (b) is a schematic drawing of the lower cranial nerves (1: spinal, 2: CN IX, 3: vagus, 4: hypoglossal) showing their course from the brainstem to the jugular foramen in relation to the pons (P), pyramid (Py), and occipital bone (OB). Figures (c) and (d) provide clinical correlation via a Nissl-stained micrographic slice and an axial T2-weighted MRI, respectively. These images demonstrate the retro-olivary groove (rog), inferior olivary nucleus (O), and inferior cerebellar peduncle (icp), identifying the precise exit point and internal nuclear organization of the glossopharyngeal nerve within the upper medulla.
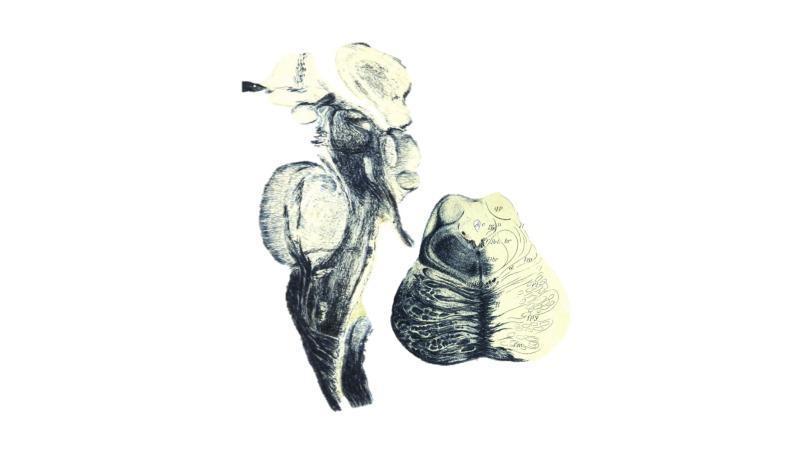
This medical illustration comprises two detailed anatomical sketches of the human brainstem from Jakob's Atlas of the Nervous System (1901). On the left, a sagittal section illustrates the vertical orientation of the brainstem, extending from the superior midbrain and diencephalon regions down through the bulbous pons and narrowing into the medulla oblongata. The sketch uses fine stippling and hatching to differentiate tissue densities, highlighting fiber tract trajectories and the prominent ventral protrusion of the pons. On the right, an axial cross-section through the pons is shown. This view reveals the internal architecture of the pontine tegmentum and the basilar part of the pons. The left side of the axial view is heavily shaded to demonstrate the dense arrangement of transverse pontine fibers and corticospinal tracts, while the right side features anatomical labels and light outlines to designate specific nuclei and nerve pathways. This historical clinical imaging reference is utilized in neuroanatomy education to map critical nuclei and tracts relevant to neurosurgical planning and the study of brainstem lesions.
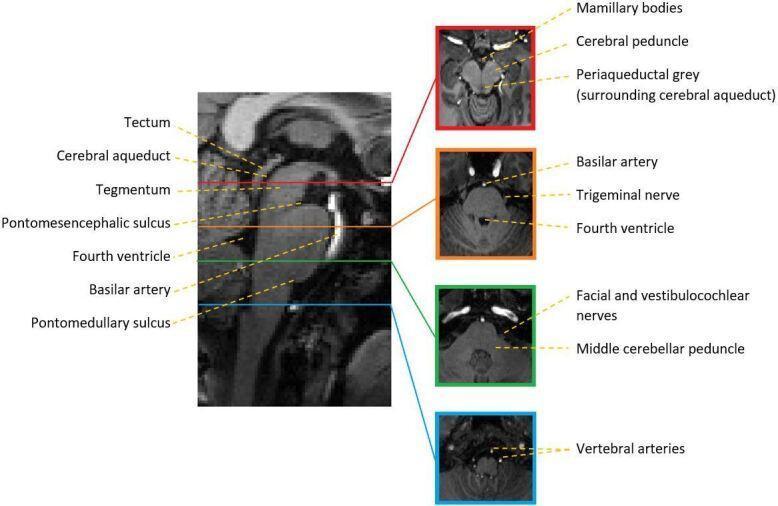
This diagnostic image provides a comprehensive anatomical overview of the human brainstem using T1-weighted MRI. On the left, a mid-sagittal section highlights the vertical arrangement of the midbrain, pons, and medulla. Key landmarks labeled include the tectum, cerebral aqueduct, tegmentum, and the fourth ventricle. Boundary demarcations such as the pontomesencephalic sulcus and the pontomedullary sulcus are clearly identified. To the right, four corresponding axial cross-sections are presented to illustrate internal and adjacent structures at specific levels. The superior axial view (midbrain) labels the mamillary bodies, cerebral peduncle, and periaqueductal grey. The second view (upper pons) identifies the basilar artery, trigeminal nerve, and fourth ventricle. The third view (lower pons/junction) shows the facial and vestibulocochlear nerves alongside the middle cerebellar peduncle. The most caudal axial view (medulla) highlights the vertebral arteries. This educational graphic is designed to teach brainstem spatial relationships, neuroanatomy, and neuroradiological landmarks for clinical localization.
Wallenberg lateral medullary syndrome diagram PICA infarct
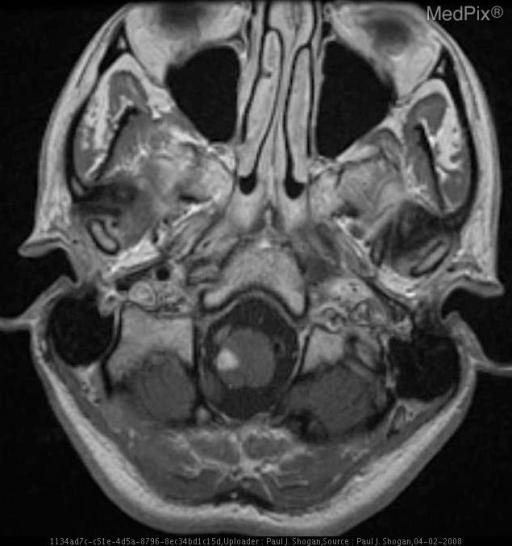
**Imaging Modality:** Magnetic Resonance Imaging (MRI), axial T2-weighted section. **Anatomical Region:** Axial section at the level of the craniocervical junction, specifically focusing on the medulla oblongata and posterior fossa. **Observed Pathology:** There is a focal, well-defined area of hyperintensity located in the right dorsolateral aspect of the medulla oblongata. The lesion is consistent with an acute or subacute ischemic infarct in the territory of the posterior inferior cerebellar artery (PICA) or the vertebral artery. **Characteristic Visual Features:** * **Signal Intensity:** High T2 signal (hyperintense) relative to the surrounding brainstem parenchyma. * **Localization:** Precise involvement of the lateral medullary segment, characteristic of Lateral Medullary Syndrome (Wallenberg Syndrome). * **Mass Effect:** Minimal to no significant mass effect or displacement of the fourth ventricle/medulla midline is observed in this section. * **Surrounding Structures:** The cerebellum and surrounding cisterns appear unremarkable at this level. **Key Diagnostic Features:** The specific dorsolateral medullary localization of the hyperintense signal is the hallmark radiologic finding for PICA territory infarction, correlating clinically with Wallenberg Syndrome.
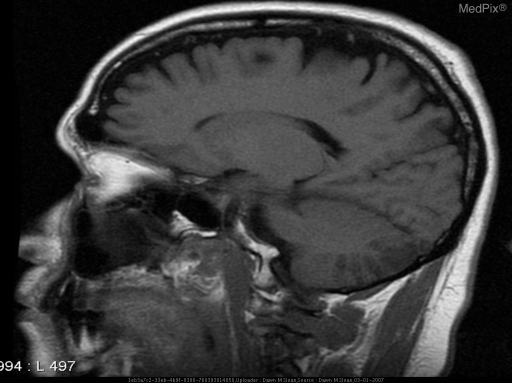
**Imaging Modality:** Magnetic Resonance Imaging (MRI) **Anatomical Plane:** Sagittal view **Anatomical Region:** Brain and upper cervical spine **Key Observations:** - **Parenchymal Findings:** The image demonstrates a T1-weighted sagittal section of the brain. There is a visible area of altered signal intensity within the posterior fossa, specifically involving the dorsolateral aspect of the medulla oblongata and the inferior portion of the cerebellum. - **Vascular Distribution:** The location of the lesion is highly characteristic of an infarct within the territory of the posterior inferior cerebellar artery (PICA). - **Associated Structures:** The sagittal view provides clear visualization of the brainstem (midbrain, pons, and medulla), the fourth ventricle, and the cerebellar hemispheres. The cortical sulci and gyri, corpus callosum, and pituitary gland appear within normal limits on this section. **Clinical Significance:** This radiologic pattern is consistent with a lateral medullary infarct, the anatomical substrate for Wallenberg’s syndrome. Key diagnostic cues include the localized involvement of the medulla, which typically results from PICA or vertebral artery occlusion. **Primary Keywords:** MRI, T1-weighted, sagittal, medulla oblongata, cerebellum, PICA infarct, lateral medullary syndrome, Wallenberg’s syndrome.
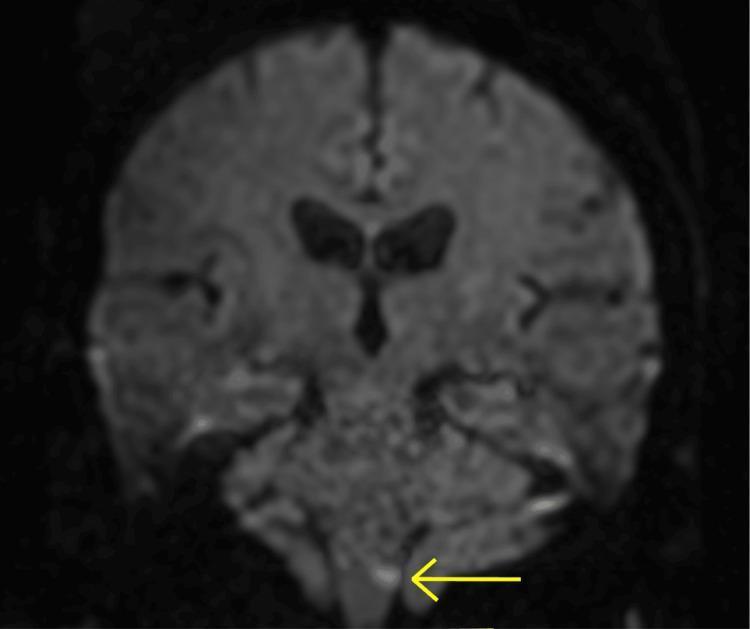
A coronal slice of a brain MRI using Diffusion-Weighted Imaging (DWI). The image displays the cerebrum, ventricular system, and posterior fossa structures, including the brainstem and cerebellum. A yellow arrow points to a localized focal area of high signal intensity (restricted diffusion) measuring approximately 4 mm in the left lateral medulla. This hyperintense lesion is characteristic of an acute ischemic infarct within the vascular territory of the posterior inferior cerebellar artery (PICA). The find represents Wallenberg syndrome (lateral medullary syndrome) pathology. The background shows moderate cortical and central atrophy, consistent with chronic ischemic changes or age-related involution. This diagnostic image is intended for educational use in neurology and radiology to demonstrate small-vessel stroke localization in the brainstem.
Clinical Anatomy of the Brainstem
Overview
- Midbrain (Mesencephalon)
- Pons (Metencephalon)
- Medulla Oblongata (Myelencephalon)
General Anatomical Principles
Columnar Organization of Cranial Nerve Nuclei
- Motor nuclei lie ventrally (anterior to the sulcus limitans)
- Sensory nuclei lie dorsally (posterior to the sulcus limitans)
- Somatic motor (GSE) - innervate eye and tongue muscles: CN III, IV, VI, XII
- Branchial motor (SVE) - innervate pharyngeal arch-derived muscles: CN V, VII, IX, X, XI
- Parasympathetic (GVE) - visceromotor: CN III (Edinger-Westphal), VII, IX, X
- Visceral sensory (GVA/SVA) - nucleus of the tractus solitarius (CN VII, IX, X)
- General somatic sensory (GSA) - trigeminal nuclear complex
- Special somatic sensory (SSA) - cochlear and vestibular nuclei (CN VIII)
- Neuroanatomy through Clinical Cases 3rd Ed., p. 586
1. Midbrain (Mesencephalon)
External Landmarks
- Ventral: Cerebral peduncles - paired columns carrying descending corticospinal/corticobulbar tracts
- Dorsal: Tectum (quadrigeminal plate) - superior and inferior colliculi
- Between peduncles: Interpeduncular fossa; CN III emerges here
- Lateral: CN IV exits dorsally (only CN to exit from dorsal brainstem)
- Cerebral aqueduct (of Sylvius): Connects 3rd and 4th ventricles, runs through midbrain
Internal Structure (three layers, ventral to dorsal)
| Zone | Structures | Clinical Relevance |
|---|---|---|
| Basis (cerebral peduncle) | Corticospinal, corticobulbar, corticopontine tracts | Damaged in Weber syndrome |
| Tegmentum | CN III/IV nuclei, red nucleus, MLF, spinothalamic tract, medial lemniscus, decussation of superior cerebellar peduncle | Benedikt, Claude syndromes |
| Tectum | Superior colliculi (visual reflex), inferior colliculi (auditory relay) | Parinaud syndrome with compression |
Grey Matter Landmarks
- Substantia nigra - dopaminergic; separates basis from tegmentum; low signal on T2-MRI due to iron
- Red nucleus - in tegmentum; low signal on T2-MRI; involved in cerebellar output
- Edinger-Westphal nucleus - parasympathetic to pupil/lens (CN III)
- Periaqueductal grey (PAG) - surrounds aqueduct; pain modulation, opioid receptors
Cranial Nerves at Midbrain Level
- CN III (Oculomotor) - exits through interpeduncular fossa; passes between SCA and PCA (at risk from PCA aneurysm)
- CN IV (Trochlear) - exits DORSALLY, below inferior colliculus; decussates in superior medullary velum
2. Pons
External Landmarks
- Ventral (basis pontis): Large convexity with transversely oriented pontocerebellar fibers entering the middle cerebellar peduncle; corticospinal tract fibers travel dispersed through here
- Dorsal (pontine tegmentum): Forms the floor of the upper fourth ventricle
- Basilar artery: Lies in the basilar groove on the ventral surface
- Pontomedullary sulcus: Separates pons from medulla
Internal Structure (ventral to dorsal)
| Zone | Key Structures |
|---|---|
| Basis pontis | Corticospinal tract (dispersed bundles), pontine nuclei, transverse pontocerebellar fibers |
| Tegmentum | CN V, VI, VII, VIII nuclei; MLF; PPRF; spinothalamic tract; medial lemniscus; reticular formation |
Cranial Nerves at Pontine Level
- CN V (Trigeminal) - exits at mid-pons laterally into Meckel's cave; chief sensory nucleus at mid-pons, spinal nucleus extends into medulla, motor nucleus at mid-pons
- CN VI (Abducens) - exits at pontomedullary junction; long intracranial course makes it vulnerable to raised ICP
- CN VII (Facial) - exits at pontomedullary sulcus (cerebellopontine angle); nucleus at caudal pons; its axons wrap around the CN VI nucleus forming the facial colliculus on the floor of the 4th ventricle
- CN VIII (Vestibulocochlear) - enters pons at CPA; cochlear and vestibular nuclei in caudal pons
Key Pontine Functional Centers
- Paramedian Pontine Reticular Formation (PPRF): Horizontal gaze center - coordinates ipsilateral conjugate gaze; ablation causes eyes to deviate toward the lesion ("eyes look away from hemiplegia" in pontine stroke)
- Respiratory centers (pneumotaxic/apneustic): Modify medullary respiratory rhythm
- Micturition center (pontine micturition center, M region)
3. Medulla Oblongata
External Landmarks
- Ventral surface (two paired bulges on each side):
- Pyramids (medially) - contain corticospinal fibers before decussation
- Olives (laterally) - contain inferior olivary nuclei
- Dorsal surface: Inferior part of 4th ventricle floor; gracile and cuneate tubercles
- Closed medulla (lower): Central canal continuous with spinal cord; pyramidal decussation and sensory decussation occur here
- Open medulla (upper): Related to 4th ventricle
Internal Structure
| Zone | Key Structures |
|---|---|
| Ventral (anterior) | Pyramids (corticospinal tracts), arcuate fibers |
| Central | Inferior olivary nucleus (cerebellar input), hypoglossal nucleus |
| Lateral | Inferior cerebellar peduncle (restiform body), spinothalamic tract, descending trigeminal tract/nucleus, nucleus ambiguus, descending sympathetic pathway, vestibular nuclei |
| Dorsal | Nucleus gracilis, nucleus cuneatus (posterior column relay); dorsal motor nucleus of CN X; nucleus solitarius |
Cranial Nerves at Medullary Level
- CN IX (Glossopharyngeal) - exits retro-olivary groove; nucleus ambiguus, inferior salivatory nucleus, nucleus solitarius
- CN X (Vagus) - exits retro-olivary groove; dorsal motor nucleus, nucleus ambiguus, nucleus solitarius
- CN XI (Accessory) - cranial root from nucleus ambiguus; spinal root from C1-C5
- CN XII (Hypoglossal) - exits between pyramids and olives (pre-olivary groove)
Vital Centers in Medulla
- Respiratory center (ventral respiratory group / dorsal respiratory group)
- Cardiovascular center (vasomotor center - controls heart rate and BP)
- Vomiting center (area postrema - chemoreceptor trigger zone, lacks blood-brain barrier)
- Swallowing center
Decussations in the Medulla
- Pyramidal decussation (motor) - lower medulla; corticospinal fibers cross here
- Sensory decussation (lemniscal) - slightly higher; medial lemniscus fibers from nuclei gracilis/cuneatus cross here
Reticular Formation and ARAS
Vascular Supply of the Brainstem
| Artery | Territory |
|---|---|
| Vertebral artery | Medulla (PICA = lateral medulla + inferior cerebellum) |
| Anterior spinal artery | Medial medulla |
| Basilar artery (perforators) | Paramedian pons and midbrain |
| AICA | Lateral caudal pons, small cerebellar region |
| SCA | Rostral lateral pons, superior cerebellum |
| PCA penetrators | Midbrain, thalamus |
- Paramedian: Short perforating branches
- Lateral: Long circumferential branches and their penetrators
Classic Brainstem Syndromes (Clinical Localization)
MIDBRAIN SYNDROMES
| Syndrome | Lesion Site | Ipsilateral | Contralateral |
|---|---|---|---|
| Weber | Medial peduncle (basis) | CN III palsy + dilated pupil | Hemiparesis (corticospinal + corticobulbar) |
| Benedikt | Tegmentum (red nucleus + CN III fascicle) | CN III palsy | Tremor/choreoathetosis (red nucleus) |
| Claude | More dorsal tegmentum | CN III palsy | Cerebellar ataxia |
| Nothnagel | Superior cerebellar peduncle | CN III palsy | Cerebellar ataxia |
| Parinaud (dorsal midbrain / Sylvian aqueduct syndrome) | Tectum/pretectum (posterior commissure) | Upgaze paralysis, convergence-retraction nystagmus, light-near dissociation, lid retraction (Collier sign) | - |
- Localization in Clinical Neurology 8e; Neuroanatomy through Clinical Cases 3rd Ed.
PONTINE SYNDROMES
| Syndrome | Lesion | Features |
|---|---|---|
| Millard-Gubler | Ventral pons | Ipsilateral CN VI + VII palsy, contralateral hemiparesis |
| Foville | Tegmental pons | Ipsilateral gaze palsy + CN VII palsy, contralateral hemiparesis |
| AICA infarct (lateral inferior pontine) | Lateral caudal pons | Ipsilateral facial palsy, facial anesthesia, gaze palsy, deafness/tinnitus, limb ataxia; contralateral hemibody pain/temperature loss |
| Locked-in Syndrome | Bilateral basis pontis (rostral/midpons) | Quadriplegia, anarthria, aphonia, impaired horizontal gaze; consciousness PRESERVED (ARAS intact); patients communicate by vertical eye movement/blinking |
MEDULLARY SYNDROMES
- Ipsilateral: Facial pain/temperature loss (CN V spinal nucleus), limb/gait ataxia (restiform body), Horner syndrome (descending oculosympathetic pathway), palatal/pharyngeal weakness + dysphagia + dysphonia (nucleus ambiguus), nystagmus/vertigo (vestibular nuclei), ipsilateral lateropulsion
- Contralateral: Trunk + limb pain/temperature loss (spinothalamic tract)
- No limb weakness (pyramids are spared - ventral medulla)
- Singultus (hiccups) from involvement of respiratory reticular centers
- Key mnemonic: "PIICA" - Pain/temp Ipsilateral face, Ipsilateral Cerebellar, Ataxia, contralateral pain/temp
- Ipsilateral: Tongue weakness/deviation (CN XII - LMN)
- Contralateral: Hemiparesis (pyramidal tract) + loss of proprioception/vibration (medial lemniscus); face spared
- No pain/temperature loss (spinothalamic tract is lateral - spared)
| Feature | Wallenberg (Lateral) | Dejerine (Medial) |
|---|---|---|
| Artery | PICA / VA | Anterior spinal / VA perforators |
| Tongue | Normal | Ipsilateral LMN weakness |
| Motor | No weakness | Contralateral hemiparesis |
| Sensory | Ipsilateral face, contralateral body (pain/temp) | Contralateral proprioception/vibration |
| Ataxia | Yes (ipsilateral) | No |
| Horner | Yes (ipsilateral) | No |
"Top of the Basilar" Syndrome
-
Behavioral abnormalities: coma, akinetic mutism, hypersomnolence, memory disturbance, agitated delirium
-
Peduncular hallucinosis - vivid, complex visual hallucinations (non-threatening)
-
Vertical gaze palsy, CN III palsy
-
Cortical blindness or hemianopia
-
Localization in Clinical Neurology 8e, p. 1367-1374
Clinical Rule: Crossed Deficits = Brainstem
Ipsilateral cranial nerve deficit + contralateral long-tract (motor or sensory) signs = brainstem lesion