Explain 10 common heart diseases with ECG changes and ecg inages of those diseases
ECG electrocardiogram myocardial infarction ST elevation
atrial fibrillation ECG irregularly irregular rhythm
heart block complete AV block ECG bradycardia
ventricular tachycardia ECG wide complex tachycardia
hypertrophic cardiomyopathy ECG left ventricular hypertrophy
pulmonary embolism ECG S1Q3T3 right heart strain
Wolff-Parkinson-White syndrome delta wave short PR ECG
pericarditis ECG saddle-shaped ST elevation diffuse
dilated cardiomyopathy ECG left bundle branch block low voltage
long QT syndrome torsades de pointes ECG polymorphic ventricular tachycardia
10 Common Heart Diseases: ECG Changes & Images
1. 🫀 ST-Elevation Myocardial Infarction (STEMI)
What it is
ECG Changes
| Feature | Finding |
|---|---|
| ST Segments | Convex (tombstone) ST elevation ≥1 mm in ≥2 contiguous leads |
| Reciprocal Changes | ST depression in leads opposite to the infarct territory |
| Hyperacute T-waves | Tall, peaked T-waves in the early phase |
| Q-waves | Pathological Q-waves develop within hours (>40 ms wide, >25% of R-wave height) |
| T-wave inversions | Follow ST elevation in the evolutionary phase |
- Anterior (V1–V4) → LAD occlusion
- Inferior (II, III, aVF) → RCA occlusion
- Lateral (I, aVL, V5–V6) → LCx occlusion
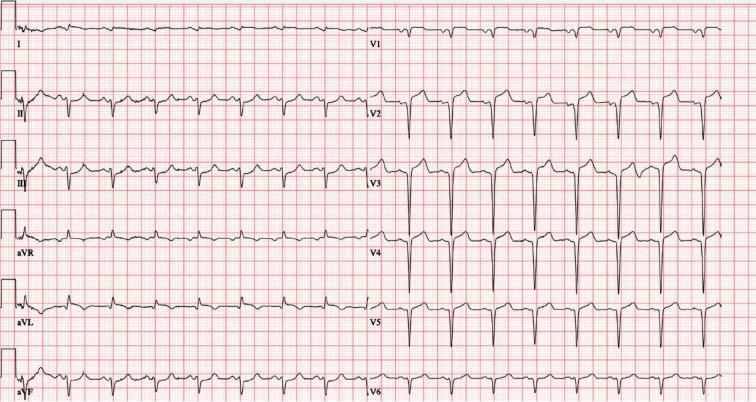
ECG Image — Anterior STEMI (LAD territory)
ECG Image — Inferolateral STEMI
2. ❤️ Atrial Fibrillation (AF)
What it is
ECG Changes
| Feature | Finding |
|---|---|
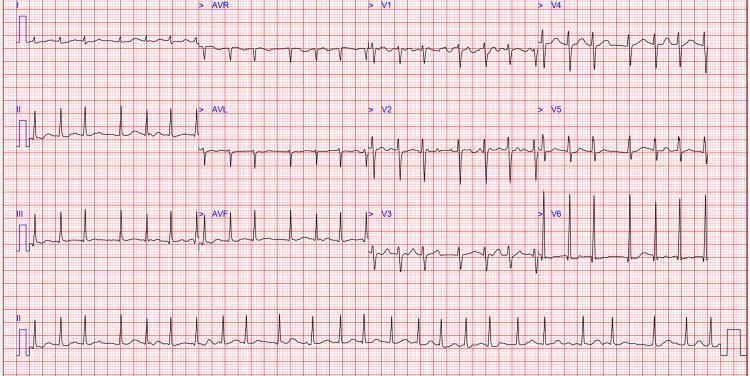
| P waves | Absent; replaced by fine, irregular fibrillatory (f) waves at 350–600/min |
| Rhythm | "Irregularly irregular" ventricular response |
| QRS complex | Narrow (unless aberrant conduction or WPW co-exists) |
| Rate | Ventricular rate 60–180/min depending on AV node conduction |
| Baseline | Undulating, no flat isoelectric line |
ECG Image
3. 🔵 Complete (Third-Degree) AV Block
What it is
ECG Changes
| Feature | Finding |
|---|---|
| AV Dissociation | P waves and QRS complexes completely independent |
| Atrial Rate | Regular, usually 60–100/min |
| Ventricular Rate | Slow escape rhythm: 40–60/min (nodal) or 20–40/min (ventricular) |
| QRS morphology | Narrow if junctional escape; wide/bizarre if ventricular escape |
| PR interval | Variable — no fixed relationship |
ECG Image
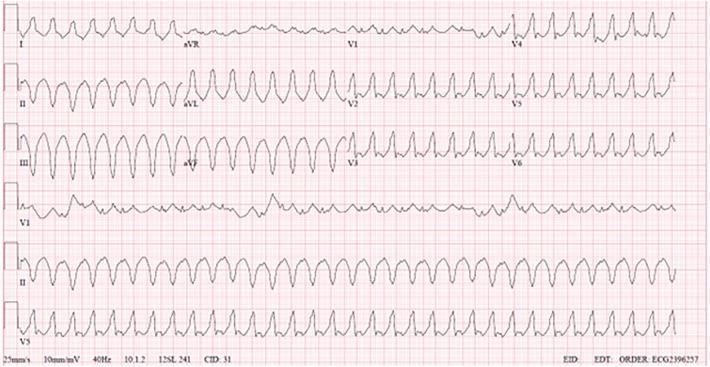
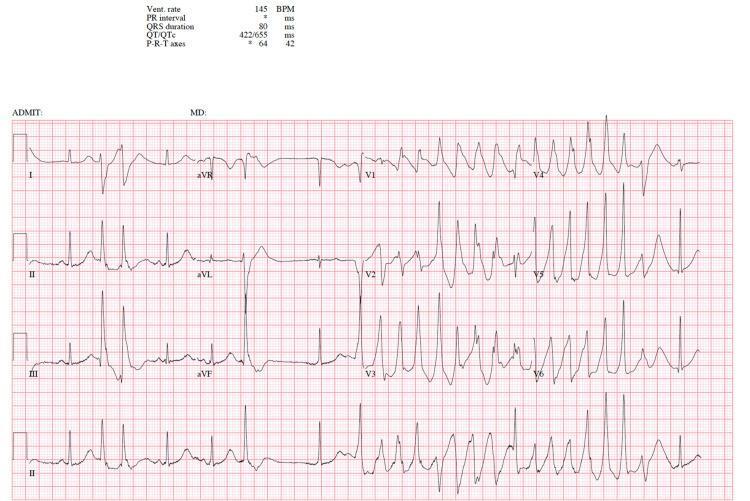
4. ⚡ Ventricular Tachycardia (VT)
What it is
ECG Changes
| Feature | Finding |
|---|---|
| Rate | 100–250 bpm, usually regular |
| QRS | Wide (>120 ms), bizarre morphology |
| P waves | AV dissociation — P waves march through independently |
| Fusion beats | Pathognomonic of VT |
| Capture beats | Narrow QRS amid wide complex — pathognomonic |
| Axis | Often extreme left or right axis deviation |
| Concordance | Positive concordance (all V leads upright) or negative concordance strongly suggests VT |
ECG Image
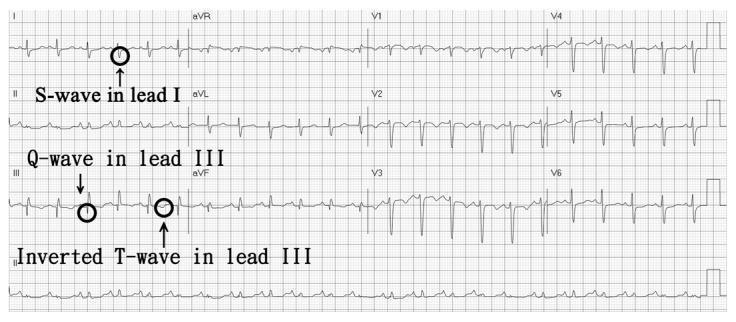
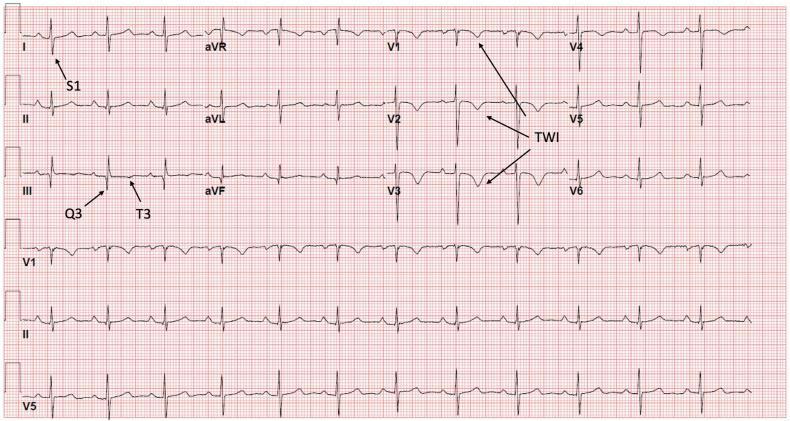
5. 🫁 Pulmonary Embolism (PE)
What it is
ECG Changes
| Feature | Finding |
|---|---|
| Sinus tachycardia | Most common finding (>100 bpm) |
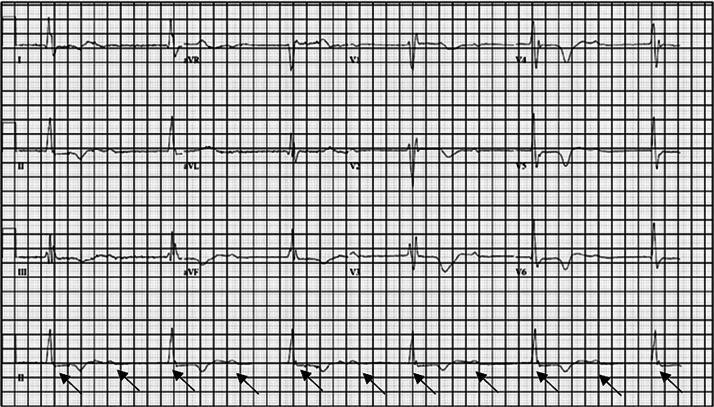
| S1Q3T3 | Deep S in lead I, Q wave in lead III, T-wave inversion in lead III |
| RBBB | New incomplete or complete right bundle branch block |
| T-wave inversions | V1–V4 (right ventricular strain pattern) |
| Right axis deviation | Shift from baseline |
| P pulmonale | Tall peaked P waves in inferior leads (right atrial enlargement) |
| Sinus tachycardia | Most sensitive but least specific finding |
ECG Image — Classic S1Q3T3 Pattern
ECG Image — Acute RV Strain with T-wave Inversions
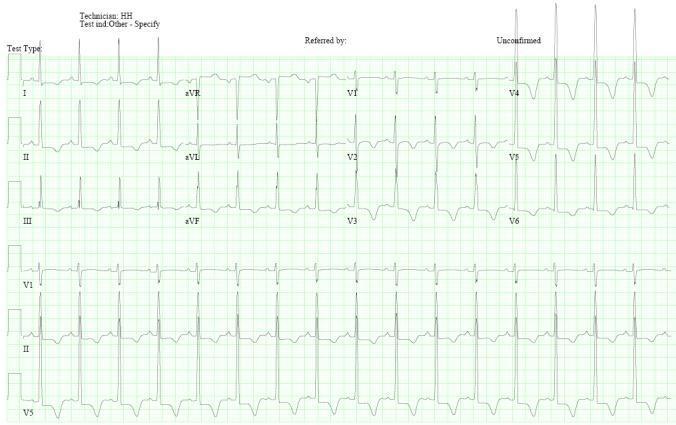
6. 🧬 Hypertrophic Cardiomyopathy (HCM)
What it is
ECG Changes
| Feature | Finding |
|---|---|
| LVH criteria | High voltage in precordial leads (Sokolow-Lyon: S-V1 + R-V5 >35 mm) |
| Strain pattern | ST depression + T-wave inversions in lateral leads (I, aVL, V4–V6) |
| Deep T inversions | Giant T-wave inversions in V3–V5 (apical HCM variant) |
| Abnormal Q waves | Deep narrow Q waves in lateral/inferior leads (septal hypertrophy) |
| Left axis deviation | Common |
| No septal Q waves | Absence of normal septal Q in V5–V6 (reversed septal depolarisation) |
ECG Image — Septal HCM with LVH & Strain
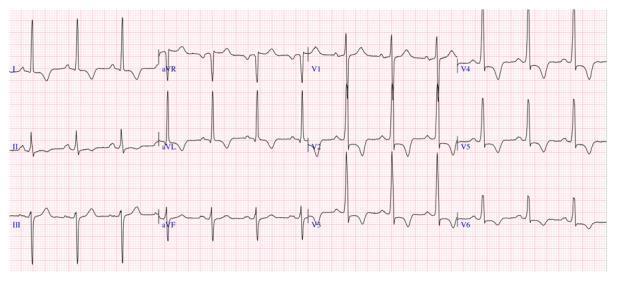
ECG Image — Apical HCM (Giant T-wave Inversions)
7. ❄️ Acute Pericarditis
What it is
ECG Changes
| Feature | Finding |
|---|---|
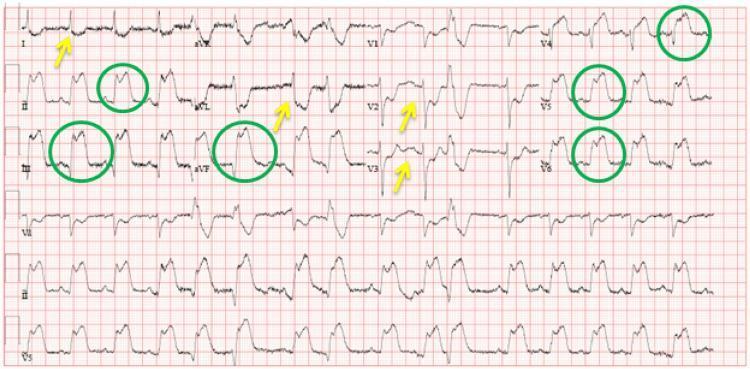
| ST elevation | Diffuse, concave (saddle-shaped) in almost all leads except aVR and V1 |
| PR depression | Classic early finding — depression in most leads, elevation in aVR |
| Spodick's sign | Downsloping TP segment (highly specific) |
| No reciprocal changes | Unlike STEMI — ST elevation is global, not regional |
| Temporal evolution | ST→ T-wave flattening → T inversion → normalisation (4 stages) |
| Electrical alternans | If large effusion with tamponade |
ECG Image

8. ⏱️ Long QT Syndrome (LQTS) & Torsades de Pointes
What it is
ECG Changes
| Feature | Finding |
|---|---|
| QTc prolongation | QTc >440 ms (men), >460 ms (women); danger threshold >500 ms |
| T-wave morphology | Notched, bifid, or prolonged T-waves; prominent U waves |
| Torsades de Pointes | Polymorphic VT with characteristic twisting QRS axis around the isoelectric line |
| Trigger | Often initiated by a PVC with short-long-short RR sequence |
| Self-terminating | Paroxysmal episodes of TdP, may degenerate to VF |
ECG Image — Long QT + Torsades de Pointes
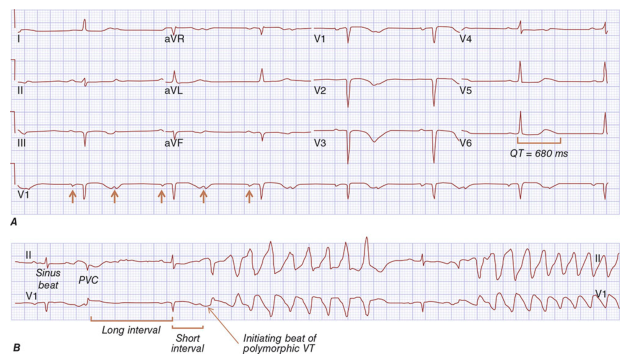
ECG Image — Torsades de Pointes
9. 🔗 Wolff-Parkinson-White (WPW) Syndrome
What it is
ECG Changes
| Feature | Finding |
|---|---|
| Short PR interval | <120 ms (bypasses normal AV node delay) |
| Delta wave | Slurred upstroke at the start of QRS — hallmark finding |
| Wide QRS | Broadened complex (>120 ms) due to pre-excitation |
| Secondary ST-T changes | Discordant ST/T changes (not ischemic) |
| Pseudo-infarction | Negative delta waves in inferior leads mimic Q-waves |
| AF with WPW | Extremely rapid irregular wide-complex rhythm (≥200 bpm) — medical emergency |
ECG Image
10. 🫀 Dilated Cardiomyopathy (DCM)
What it is
ECG Changes
| Feature | Finding |
|---|---|
| LBBB | Most common — broad monophasic R in I, aVL, V5–V6; QS in V1–V3 |
| Left axis deviation | Common |
| Low voltage | QRS amplitude <5 mm in all limb leads (amyloid, pericardial effusion) |
| Fragmented QRS | Multiple notches within the QRS — marker of fibrosis |
| Atrial fibrillation | Very common complication of DCM |
| Non-specific ST-T changes | Widespread T-wave flattening or inversion |
| Q waves | May mimic infarction in ischaemic DCM |
ECG Image — Dilated Cardiomyopathy with LBBB
Quick Reference Summary Table
| # | Disease | Key ECG Hallmarks |
|---|---|---|
| 1 | STEMI | Convex ST elevation, reciprocal depression, Q waves |
| 2 | Atrial Fibrillation | No P waves, irregularly irregular, fibrillatory baseline |
| 3 | Complete AV Block | AV dissociation, slow escape rhythm, variable PR |
| 4 | Ventricular Tachycardia | Wide QRS >120 ms, AV dissociation, fusion/capture beats |
| 5 | Pulmonary Embolism | Sinus tach, S1Q3T3, RBBB, RV strain T inversions V1–V4 |
| 6 | Hypertrophic Cardiomyopathy | LVH, strain, deep T inversions (apical), abnormal Q waves |
| 7 | Acute Pericarditis | Diffuse saddle ST elevation, PR depression, Spodick's sign |
| 8 | Long QT / TdP | QTc >500 ms, prominent U waves, twisting polymorphic VT |
| 9 | WPW Syndrome | Short PR <120 ms, delta wave, widened QRS |
| 10 | Dilated Cardiomyopathy | LBBB, low voltage, fragmented QRS, AF, non-specific ST-T changes |
Clinical Pearl: Always interpret the ECG in clinical context. Many of these patterns can overlap (e.g., LBBB in DCM can mask STEMI; WPW can mimic VT in AF; pericarditis can mimic STEMI). Rate, rhythm, morphology, and clinical history together guide management.
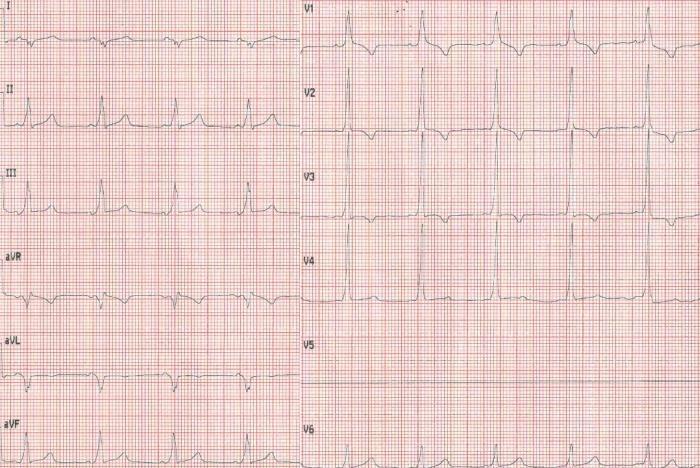
Show normal ecg side by side with the defective ecg
normal sinus rhythm 12 lead ECG healthy baseline
ls /home/daytona/workspace/ 2>/dev/null || echo "workspace empty or missing"
mkdir -p /home/daytona/workspace/ecg-comparison
~/ecg-comparison/ecg_comparison.html
<!DOCTYPE html>
<html lang="en">
<head>
<meta charset="UTF-8">
<meta name="viewport" content="width=device-width, initial-scale=1.0">
<title>ECG Comparison: Normal vs Pathological</title>
<style>
* { box-sizing: border-box; margin: 0; padding: 0; }
body {
font-family: 'Segoe UI', Arial, sans-serif;
background: #0f1117;
color: #e8eaf6;
padding: 20px;
}
h1 {
text-align: center;
font-size: 2rem;
color: #ef5350;
margin-bottom: 6px;
letter-spacing: 1px;
}
.subtitle {
text-align: center;
color: #90a4ae;
font-size: 0.95rem;
margin-bottom: 36px;
}
/* Normal ECG banner */
.normal-banner {
background: linear-gradient(135deg, #1a237e, #283593);
border-radius: 14px;
padding: 20px 28px;
margin-bottom: 36px;
display: flex;
align-items: flex-start;
gap: 28px;
border: 1px solid #3949ab;
}
.normal-banner img {
width: 55%;
border-radius: 10px;
border: 2px solid #5c6bc0;
}
.normal-banner .info {
flex: 1;
}
.normal-banner h2 {
color: #7986cb;
font-size: 1.3rem;
margin-bottom: 10px;
}
.normal-banner ul {
list-style: none;
padding: 0;
}
.normal-banner ul li {
padding: 5px 0;
border-bottom: 1px solid #3949ab;
font-size: 0.88rem;
color: #c5cae9;
}
.normal-banner ul li:last-child { border-bottom: none; }
.normal-banner ul li strong { color: #9fa8da; }
/* Disease cards */
.disease-card {
background: #161b2e;
border-radius: 16px;
border: 1px solid #2a3a5c;
margin-bottom: 32px;
overflow: hidden;
}
.card-header {
padding: 14px 22px;
display: flex;
align-items: center;
gap: 12px;
}
.card-header .num {
background: #ef5350;
color: white;
border-radius: 50%;
width: 36px; height: 36px;
display: flex; align-items: center; justify-content: center;
font-weight: 700; font-size: 1rem;
flex-shrink: 0;
}
.card-header h2 {
font-size: 1.25rem;
color: #ef9a9a;
}
.card-header .badge {
margin-left: auto;
background: rgba(239,83,80,0.15);
color: #ef5350;
border: 1px solid #ef5350;
border-radius: 20px;
padding: 3px 12px;
font-size: 0.78rem;
font-weight: 600;
}
.card-body {
padding: 0 22px 22px;
}
.ecg-row {
display: flex;
gap: 16px;
margin-bottom: 18px;
}
.ecg-panel {
flex: 1;
border-radius: 12px;
overflow: hidden;
}
.ecg-panel.normal-panel {
border: 2px solid #388e3c;
}
.ecg-panel.abnormal-panel {
border: 2px solid #d32f2f;
}
.ecg-panel .panel-label {
padding: 7px 14px;
font-size: 0.8rem;
font-weight: 700;
letter-spacing: 0.5px;
display: flex;
align-items: center;
gap: 6px;
}
.normal-panel .panel-label {
background: #1b5e20;
color: #a5d6a7;
}
.abnormal-panel .panel-label {
background: #b71c1c;
color: #ffcdd2;
}
.ecg-panel img {
width: 100%;
display: block;
background: #000;
}
/* Changes grid */
.changes-grid {
display: grid;
grid-template-columns: 1fr 1fr;
gap: 12px;
margin-top: 4px;
}
.change-col {
border-radius: 10px;
padding: 14px 16px;
}
.change-col.normal-col {
background: rgba(56,142,60,0.1);
border: 1px solid #388e3c;
}
.change-col.abnormal-col {
background: rgba(211,47,47,0.1);
border: 1px solid #d32f2f;
}
.change-col h4 {
font-size: 0.8rem;
font-weight: 700;
letter-spacing: 0.5px;
margin-bottom: 8px;
text-transform: uppercase;
}
.normal-col h4 { color: #81c784; }
.abnormal-col h4 { color: #ef9a9a; }
.change-col ul {
list-style: none;
padding: 0;
}
.change-col ul li {
font-size: 0.82rem;
padding: 3px 0;
color: #cfd8dc;
padding-left: 14px;
position: relative;
}
.change-col ul li::before {
content: '▸';
position: absolute;
left: 0;
font-size: 0.7rem;
}
.normal-col ul li::before { color: #81c784; }
.abnormal-col ul li::before { color: #ef9a9a; }
.change-col ul li strong { color: #fff; font-weight: 600; }
footer {
text-align: center;
color: #546e7a;
font-size: 0.8rem;
margin-top: 40px;
padding-top: 20px;
border-top: 1px solid #1e2a3a;
}
@media (max-width: 700px) {
.ecg-row { flex-direction: column; }
.changes-grid { grid-template-columns: 1fr; }
.normal-banner { flex-direction: column; }
.normal-banner img { width: 100%; }
}
</style>
</head>
<body>
<h1>❤️ ECG Comparison: Normal vs Pathological</h1>
<p class="subtitle">10 Common Heart Diseases — Side-by-Side Electrocardiogram Analysis</p>
<!-- NORMAL ECG REFERENCE BANNER -->
<div class="normal-banner">
<img src="https://cdn.orris.care/cdss_images/pmc_clinical_VQA_8f341459857cb1f6810c616d1d5c43c3d15519522ba21d62db2b50f3dee4d54f.jpg" alt="Normal Sinus Rhythm ECG" />
<div class="info">
<h2>✅ Normal Sinus Rhythm — Reference ECG</h2>
<ul>
<li><strong>Rate:</strong> 60–100 bpm, regular</li>
<li><strong>P waves:</strong> Present before every QRS, upright in II, inverted in aVR</li>
<li><strong>PR interval:</strong> 120–200 ms (3–5 small squares)</li>
<li><strong>QRS duration:</strong> <120 ms (narrow), normal axis</li>
<li><strong>R-wave progression:</strong> Normal V1→V6 transition</li>
<li><strong>ST segments:</strong> Isoelectric — no elevation or depression</li>
<li><strong>T waves:</strong> Upright in I, II, V3–V6; inverted in aVR</li>
<li><strong>QTc:</strong> 350–440 ms</li>
<li><strong>No pathological Q waves, no delta waves, no blocks</strong></li>
</ul>
</div>
</div>
<!-- =========================================================== -->
<!-- DISEASE 1: STEMI -->
<!-- =========================================================== -->
<div class="disease-card">
<div class="card-header" style="background: linear-gradient(90deg,#1a0000,#2d0000);">
<div class="num">1</div>
<h2>ST-Elevation Myocardial Infarction (STEMI)</h2>
<span class="badge">EMERGENCY</span>
</div>
<div class="card-body">
<div class="ecg-row">
<div class="ecg-panel normal-panel">
<div class="panel-label">✅ NORMAL ECG</div>
<img src="https://cdn.orris.care/cdss_images/pmc_clinical_VQA_7378a9205a98329a42c340ff3f26f55fba6da3f3e1f21a1231c367266e174c4a.jpg" alt="Normal ECG" />
</div>
<div class="ecg-panel abnormal-panel">
<div class="panel-label">🔴 STEMI — Anterior (LAD occlusion)</div>
<img src="https://cdn.orris.care/cdss_images/pmc_clinical_VQA_16738d4b125195130b5e53a811645d4064182fc2bbd0de16b0e00a57af7ff6ef.jpg" alt="Anterior STEMI ECG" />
</div>
</div>
<div class="changes-grid">
<div class="change-col normal-col">
<h4>Normal Findings</h4>
<ul>
<li>ST segments isoelectric in all leads</li>
<li>No pathological Q waves</li>
<li>Narrow QRS <120 ms</li>
<li>Normal T wave morphology</li>
<li>Normal R-wave progression V1→V6</li>
</ul>
</div>
<div class="change-col abnormal-col">
<h4>STEMI Changes</h4>
<ul>
<li><strong>Convex (tombstone) ST elevation</strong> V1–V6 ≥1 mm</li>
<li><strong>Reciprocal ST depression</strong> in II, III, aVF</li>
<li><strong>Hyperacute peaked T-waves</strong> early phase</li>
<li><strong>Pathological Q waves</strong> develop within hours</li>
<li>T-wave inversions follow ST elevation</li>
</ul>
</div>
</div>
</div>
</div>
<!-- =========================================================== -->
<!-- DISEASE 2: ATRIAL FIBRILLATION -->
<!-- =========================================================== -->
<div class="disease-card">
<div class="card-header" style="background: linear-gradient(90deg,#0d1a1a,#0d2626);">
<div class="num">2</div>
<h2>Atrial Fibrillation (AF)</h2>
<span class="badge">ARRHYTHMIA</span>
</div>
<div class="card-body">
<div class="ecg-row">
<div class="ecg-panel normal-panel">
<div class="panel-label">✅ NORMAL ECG</div>
<img src="https://cdn.orris.care/cdss_images/pmc_clinical_VQA_7378a9205a98329a42c340ff3f26f55fba6da3f3e1f21a1231c367266e174c4a.jpg" alt="Normal ECG" />
</div>
<div class="ecg-panel abnormal-panel">
<div class="panel-label">🔴 ATRIAL FIBRILLATION</div>
<img src="https://cdn.orris.care/cdss_images/pmc_clinical_VQA_55b3585ba004b0ca69f159c22eb5fbb4d8995fc007e77627c0d37922e4d88973.jpg" alt="Atrial Fibrillation ECG" />
</div>
</div>
<div class="changes-grid">
<div class="change-col normal-col">
<h4>Normal Findings</h4>
<ul>
<li>Regular rhythm — equal R-R intervals</li>
<li>Clear distinct P wave before each QRS</li>
<li>Flat isoelectric baseline</li>
<li>Consistent QRS morphology</li>
</ul>
</div>
<div class="change-col abnormal-col">
<h4>AF Changes</h4>
<ul>
<li><strong>No P waves</strong> — replaced by fibrillatory (f) waves</li>
<li><strong>Irregularly irregular</strong> R-R intervals</li>
<li>Undulating chaotic baseline (350–600/min atrial)</li>
<li>Narrow QRS (unless aberrant conduction)</li>
<li>Variable ventricular rate 60–180 bpm</li>
</ul>
</div>
</div>
</div>
</div>
<!-- =========================================================== -->
<!-- DISEASE 3: COMPLETE AV BLOCK -->
<!-- =========================================================== -->
<div class="disease-card">
<div class="card-header" style="background: linear-gradient(90deg,#0d0d1a,#0d1533);">
<div class="num">3</div>
<h2>Complete (3rd Degree) AV Block</h2>
<span class="badge">CONDUCTION</span>
</div>
<div class="card-body">
<div class="ecg-row">
<div class="ecg-panel normal-panel">
<div class="panel-label">✅ NORMAL ECG</div>
<img src="https://cdn.orris.care/cdss_images/pmc_clinical_VQA_7378a9205a98329a42c340ff3f26f55fba6da3f3e1f21a1231c367266e174c4a.jpg" alt="Normal ECG" />
</div>
<div class="ecg-panel abnormal-panel">
<div class="panel-label">🔴 COMPLETE AV BLOCK (3rd Degree)</div>
<img src="https://cdn.orris.care/cdss_images/pmc_clinical_VQA_aeb984a3d643e0df6ca0ccdeab021262c2023d848ce082be901b58452da13940.jpg" alt="Complete Heart Block ECG" />
</div>
</div>
<div class="changes-grid">
<div class="change-col normal-col">
<h4>Normal Findings</h4>
<ul>
<li>Fixed PR interval 120–200 ms</li>
<li>Every P wave followed by QRS</li>
<li>P rate = ventricular rate (60–100 bpm)</li>
<li>Narrow QRS, normal escape</li>
</ul>
</div>
<div class="change-col abnormal-col">
<h4>Complete AV Block Changes</h4>
<ul>
<li><strong>Complete AV dissociation</strong> — P waves and QRS independent</li>
<li><strong>Ventricular rate 20–40 bpm</strong> (ventricular escape)</li>
<li><strong>Wide, bizarre QRS</strong> (infranodal escape focus)</li>
<li>No fixed PR interval — varies constantly</li>
<li>Atrial rate regular, faster than ventricular</li>
</ul>
</div>
</div>
</div>
</div>
<!-- =========================================================== -->
<!-- DISEASE 4: VENTRICULAR TACHYCARDIA -->
<!-- =========================================================== -->
<div class="disease-card">
<div class="card-header" style="background: linear-gradient(90deg,#1a0a00,#2d1400);">
<div class="num">4</div>
<h2>Ventricular Tachycardia (VT)</h2>
<span class="badge">EMERGENCY</span>
</div>
<div class="card-body">
<div class="ecg-row">
<div class="ecg-panel normal-panel">
<div class="panel-label">✅ NORMAL ECG</div>
<img src="https://cdn.orris.care/cdss_images/pmc_clinical_VQA_7378a9205a98329a42c340ff3f26f55fba6da3f3e1f21a1231c367266e174c4a.jpg" alt="Normal ECG" />
</div>
<div class="ecg-panel abnormal-panel">
<div class="panel-label">🔴 VENTRICULAR TACHYCARDIA</div>
<img src="https://cdn.orris.care/cdss_images/pmc_clinical_VQA_d15a92de4e89b46f273b22d254d1e30fcd6a190c6d581b193e6dd338338c6bb6.jpg" alt="Ventricular Tachycardia ECG" />
</div>
</div>
<div class="changes-grid">
<div class="change-col normal-col">
<h4>Normal Findings</h4>
<ul>
<li>Narrow QRS <120 ms</li>
<li>Rate 60–100 bpm</li>
<li>P waves precede every QRS</li>
<li>Normal QRS morphology</li>
</ul>
</div>
<div class="change-col abnormal-col">
<h4>VT Changes</h4>
<ul>
<li><strong>Wide QRS >120 ms</strong>, bizarre morphology</li>
<li><strong>Rate 100–250 bpm</strong>, regular</li>
<li><strong>AV dissociation</strong> — P waves independent</li>
<li><strong>Fusion & capture beats</strong> — pathognomonic</li>
<li>Positive concordance across V1–V6 (all positive)</li>
<li>Extreme axis deviation</li>
</ul>
</div>
</div>
</div>
</div>
<!-- =========================================================== -->
<!-- DISEASE 5: PULMONARY EMBOLISM -->
<!-- =========================================================== -->
<div class="disease-card">
<div class="card-header" style="background: linear-gradient(90deg,#001a0d,#002d16);">
<div class="num">5</div>
<h2>Pulmonary Embolism (PE)</h2>
<span class="badge">EMERGENCY</span>
</div>
<div class="card-body">
<div class="ecg-row">
<div class="ecg-panel normal-panel">
<div class="panel-label">✅ NORMAL ECG</div>
<img src="https://cdn.orris.care/cdss_images/pmc_clinical_VQA_7378a9205a98329a42c340ff3f26f55fba6da3f3e1f21a1231c367266e174c4a.jpg" alt="Normal ECG" />
</div>
<div class="ecg-panel abnormal-panel">
<div class="panel-label">🔴 PULMONARY EMBOLISM — S1Q3T3 Pattern</div>
<img src="https://cdn.orris.care/cdss_images/pmc_clinical_VQA_5f391caa5a24ec425e9f48d4d9f73620a3b91f98df1f92cea400318772fda12e.jpg" alt="Pulmonary Embolism ECG S1Q3T3" />
</div>
</div>
<div class="changes-grid">
<div class="change-col normal-col">
<h4>Normal Findings</h4>
<ul>
<li>Normal rate (60–100 bpm)</li>
<li>No S wave in lead I</li>
<li>No Q wave or T inversion in lead III</li>
<li>Normal right precordial leads</li>
</ul>
</div>
<div class="change-col abnormal-col">
<h4>PE Changes</h4>
<ul>
<li><strong>Sinus tachycardia</strong> — most common finding</li>
<li><strong>S1Q3T3</strong> — deep S in I, Q wave + T inversion in III</li>
<li><strong>New RBBB</strong> (incomplete or complete)</li>
<li>T inversion V1–V4 (RV strain pattern)</li>
<li>Right axis deviation, P pulmonale</li>
</ul>
</div>
</div>
</div>
</div>
<!-- =========================================================== -->
<!-- DISEASE 6: HYPERTROPHIC CARDIOMYOPATHY -->
<!-- =========================================================== -->
<div class="disease-card">
<div class="card-header" style="background: linear-gradient(90deg,#0d001a,#1a0033);">
<div class="num">6</div>
<h2>Hypertrophic Cardiomyopathy (HCM)</h2>
<span class="badge">STRUCTURAL</span>
</div>
<div class="card-body">
<div class="ecg-row">
<div class="ecg-panel normal-panel">
<div class="panel-label">✅ NORMAL ECG</div>
<img src="https://cdn.orris.care/cdss_images/pmc_clinical_VQA_7378a9205a98329a42c340ff3f26f55fba6da3f3e1f21a1231c367266e174c4a.jpg" alt="Normal ECG" />
</div>
<div class="ecg-panel abnormal-panel">
<div class="panel-label">🔴 HYPERTROPHIC CARDIOMYOPATHY — Apical variant</div>
<img src="https://cdn.orris.care/cdss_images/pmc_clinical_VQA_f9136e8a77fe104cfbe3b8d6deb3a988a0925e95c5f6acba5afb957453257c47.jpg" alt="HCM ECG with giant T-wave inversions" />
</div>
</div>
<div class="changes-grid">
<div class="change-col normal-col">
<h4>Normal Findings</h4>
<ul>
<li>Normal QRS voltage</li>
<li>Upright T waves in lateral leads</li>
<li>Septal Q waves present in V5–V6 (normal)</li>
<li>No ST changes</li>
</ul>
</div>
<div class="change-col abnormal-col">
<h4>HCM Changes</h4>
<ul>
<li><strong>LVH criteria</strong> — high voltage S-V1 + R-V5 >35 mm</li>
<li><strong>Giant T-wave inversions</strong> V3–V5 (apical HCM)</li>
<li><strong>Strain pattern</strong> — ST depression + T inversions lateral leads</li>
<li>Deep narrow Q waves in inferior/lateral leads</li>
<li>Absent septal Q waves in V5–V6</li>
</ul>
</div>
</div>
</div>
</div>
<!-- =========================================================== -->
<!-- DISEASE 7: ACUTE PERICARDITIS -->
<!-- =========================================================== -->
<div class="disease-card">
<div class="card-header" style="background: linear-gradient(90deg,#001a1a,#002b2b);">
<div class="num">7</div>
<h2>Acute Pericarditis</h2>
<span class="badge">INFLAMMATORY</span>
</div>
<div class="card-body">
<div class="ecg-row">
<div class="ecg-panel normal-panel">
<div class="panel-label">✅ NORMAL ECG</div>
<img src="https://cdn.orris.care/cdss_images/pmc_clinical_VQA_7378a9205a98329a42c340ff3f26f55fba6da3f3e1f21a1231c367266e174c4a.jpg" alt="Normal ECG" />
</div>
<div class="ecg-panel abnormal-panel">
<div class="panel-label">🔴 ACUTE PERICARDITIS</div>
<img src="https://cdn.orris.care/cdss_images/pmc_clinical_VQA_cd4008531c1b1a2a99ab6d9b4282dcdcedfcf77c302b6ecbb7f7e01c5c985cf9.jpg" alt="Acute Pericarditis ECG" />
</div>
</div>
<div class="changes-grid">
<div class="change-col normal-col">
<h4>Normal Findings</h4>
<ul>
<li>Flat isoelectric PR segments</li>
<li>Isoelectric ST segments</li>
<li>Upright T waves in lateral leads</li>
<li>No diffuse changes</li>
</ul>
</div>
<div class="change-col abnormal-col">
<h4>Pericarditis Changes</h4>
<ul>
<li><strong>Diffuse saddle-shaped ST elevation</strong> (all leads except aVR, V1)</li>
<li><strong>PR segment depression</strong> — classic early sign</li>
<li><strong>PR elevation in aVR</strong> (reciprocal)</li>
<li><strong>Spodick's sign</strong> — downsloping TP segment</li>
<li>No reciprocal depression (unlike STEMI)</li>
</ul>
</div>
</div>
</div>
</div>
<!-- =========================================================== -->
<!-- DISEASE 8: LONG QT / TORSADES -->
<!-- =========================================================== -->
<div class="disease-card">
<div class="card-header" style="background: linear-gradient(90deg,#1a1a00,#2b2b00);">
<div class="num">8</div>
<h2>Long QT Syndrome & Torsades de Pointes</h2>
<span class="badge">CHANNELOPATHY</span>
</div>
<div class="card-body">
<div class="ecg-row">
<div class="ecg-panel normal-panel">
<div class="panel-label">✅ NORMAL ECG — QTc 350–440 ms</div>
<img src="https://cdn.orris.care/cdss_images/pmc_clinical_VQA_7378a9205a98329a42c340ff3f26f55fba6da3f3e1f21a1231c367266e174c4a.jpg" alt="Normal ECG" />
</div>
<div class="ecg-panel abnormal-panel">
<div class="panel-label">🔴 LONG QT → TORSADES DE POINTES (Harrison's)</div>
<img src="https://cdn.orris.care/cdss_images/HARRISON_1763034143291_d1a2f9c1-7f66-4dec-a3f8-19b81f2ba927.png" alt="Long QT and Torsades de Pointes ECG from Harrison's" />
</div>
</div>
<div class="changes-grid">
<div class="change-col normal-col">
<h4>Normal Findings</h4>
<ul>
<li>QTc 350–440 ms (male), <460 ms (female)</li>
<li>Normal T wave morphology — not notched</li>
<li>No prominent U waves</li>
<li>Regular sinus rhythm</li>
</ul>
</div>
<div class="change-col abnormal-col">
<h4>Long QT / TdP Changes</h4>
<ul>
<li><strong>QTc >500 ms</strong> — danger threshold</li>
<li><strong>Notched/bifid T waves</strong>, prominent U waves</li>
<li><strong>Torsades de Pointes</strong> — twisting polymorphic VT</li>
<li>PVC with short-long-short trigger initiates TdP</li>
<li>Self-terminating but may degenerate to VF</li>
</ul>
</div>
</div>
</div>
</div>
<!-- =========================================================== -->
<!-- DISEASE 9: WPW SYNDROME -->
<!-- =========================================================== -->
<div class="disease-card">
<div class="card-header" style="background: linear-gradient(90deg,#001a0a,#003319);">
<div class="num">9</div>
<h2>Wolff-Parkinson-White (WPW) Syndrome</h2>
<span class="badge">PRE-EXCITATION</span>
</div>
<div class="card-body">
<div class="ecg-row">
<div class="ecg-panel normal-panel">
<div class="panel-label">✅ NORMAL ECG — Normal PR interval, no delta wave</div>
<img src="https://cdn.orris.care/cdss_images/pmc_clinical_VQA_32202ebda4ec9404cf20f0a12d7fac22611ed6349c65e22fcd92d964de676b10.jpg" alt="Normal ECG baseline for WPW" />
</div>
<div class="ecg-panel abnormal-panel">
<div class="panel-label">🔴 WPW SYNDROME — Delta Wave, Short PR</div>
<img src="https://cdn.orris.care/cdss_images/pmc_clinical_VQA_fd0d58cc1913acd56cbc62cbf42657e4a465f052a9bb2ea0d3893584ef6f70e6.jpg" alt="WPW ECG with delta waves" />
</div>
</div>
<div class="changes-grid">
<div class="change-col normal-col">
<h4>Normal Findings</h4>
<ul>
<li>PR interval 120–200 ms</li>
<li>Sharp, narrow QRS onset (no delta)</li>
<li>QRS <120 ms</li>
<li>Normal T wave concordance</li>
</ul>
</div>
<div class="change-col abnormal-col">
<h4>WPW Changes</h4>
<ul>
<li><strong>Short PR <120 ms</strong> — bypasses AV node</li>
<li><strong>Delta wave</strong> — slurred upstroke at QRS onset</li>
<li><strong>Widened QRS >120 ms</strong></li>
<li>Discordant secondary ST-T changes</li>
<li>Pseudo-infarction Q waves (negative delta in inferior leads)</li>
</ul>
</div>
</div>
</div>
</div>
<!-- =========================================================== -->
<!-- DISEASE 10: DILATED CARDIOMYOPATHY -->
<!-- =========================================================== -->
<div class="disease-card">
<div class="card-header" style="background: linear-gradient(90deg,#1a0a0d,#2d1218);">
<div class="num">10</div>
<h2>Dilated Cardiomyopathy (DCM)</h2>
<span class="badge">STRUCTURAL</span>
</div>
<div class="card-body">
<div class="ecg-row">
<div class="ecg-panel normal-panel">
<div class="panel-label">✅ NORMAL ECG</div>
<img src="https://cdn.orris.care/cdss_images/pmc_clinical_VQA_7378a9205a98329a42c340ff3f26f55fba6da3f3e1f21a1231c367266e174c4a.jpg" alt="Normal ECG" />
</div>
<div class="ecg-panel abnormal-panel">
<div class="panel-label">🔴 DILATED CARDIOMYOPATHY — LBBB pattern</div>
<img src="https://cdn.orris.care/cdss_images/pmc_clinical_VQA_3458bf02be74ff6aa57a9c6a0409235cb092d3a4cf29ef11c03f844a2f6ac26b.jpg" alt="Dilated Cardiomyopathy ECG" />
</div>
</div>
<div class="changes-grid">
<div class="change-col normal-col">
<h4>Normal Findings</h4>
<ul>
<li>Normal QRS voltage</li>
<li>Narrow QRS <120 ms</li>
<li>Normal R-wave progression</li>
<li>Regular sinus rhythm</li>
</ul>
</div>
<div class="change-col abnormal-col">
<h4>DCM Changes</h4>
<ul>
<li><strong>LBBB</strong> — broad R in I, aVL, V5–V6; QS in V1–V3</li>
<li><strong>Low voltage</strong> — QRS <5 mm all limb leads</li>
<li><strong>Fragmented QRS</strong> — notching, marker of fibrosis</li>
<li>Atrial fibrillation (common complication)</li>
<li>Non-specific ST-T changes, left axis deviation</li>
</ul>
</div>
</div>
</div>
</div>
<footer>
<p>ECG images sourced from peer-reviewed medical literature and Harrison's Principles of Internal Medicine (21st Ed.)</p>
<p style="margin-top:6px;">For educational purposes only. Always interpret ECGs in full clinical context.</p>
</footer>
</body>
</html>
ls -lh /home/daytona/workspace/ecg-comparison/