
Imp questions that can be asked in the university exam under the topic of epidemiology
Important University Exam Questions - Epidemiology
1. DEFINITIONS & CONCEPTS
- Define epidemiology. Describe the aims and uses of epidemiology.
- Explain the concept of "natural history of disease" and levels of prevention.
- Define: Incidence, Prevalence, Attack rate, Secondary attack rate
- Difference between Incidence and Prevalence
- Herd immunity - definition and significance
- Define: Epidemic, Endemic, Pandemic, Sporadic
- Difference between Rate, Ratio, and Proportion
- Epidemiology vs. Clinical medicine - key differences
2. MEASUREMENTS IN EPIDEMIOLOGY
- Describe the basic measurements in epidemiology (mortality and morbidity indicators).
- Explain Crude Death Rate, Specific Death Rate, Standardized Mortality Ratio (SMR), and their uses.
- Incidence rate - definition and formula
- Prevalence rate (point vs. period) - definitions and formulas
- Attack rate and secondary attack rate with formulas
- Proportional Mortality Rate (PMR)
- Case Fatality Rate - definition and use
- Standardized Mortality Ratio (SMR)
3. CONCEPT OF CAUSATION
- Describe the concept of causation in epidemiology. Discuss the Epidemiological Triad, Web of Causation, and Koch's Postulates.
- Write about Henle-Koch's postulates and their limitations. What are Hill's criteria of causation?
- Epidemiological triad (Agent-Host-Environment)
- Web of causation (MacMahon's model)
- Koch's/Henle-Koch's postulates
- Bradford Hill's criteria for causation (9 criteria)
- Multifactorial causation
4. EPIDEMIOLOGICAL STUDY DESIGNS
- Classify epidemiological study designs. Compare and contrast Case-Control and Cohort studies with their advantages and disadvantages.
- Describe the design, methodology, uses, advantages, and disadvantages of a Case-Control study.
- Describe the design, methodology, types, uses, advantages, and disadvantages of a Cohort study.
- Write a note on Randomized Controlled Trials (RCTs) - design, advantages, limitations.
- Cross-sectional (prevalence) study - uses and limitations
- Ecological/Correlational study
- Prospective vs. Retrospective cohort studies
- Odds Ratio - definition, formula, and when it is used
- Relative Risk (Risk Ratio) - definition and formula
- Attributable risk - definition and significance
- Double-blind trial
5. DESCRIPTIVE EPIDEMIOLOGY
- Describe descriptive epidemiology. Explain the variables of "Person, Place, and Time."
- Person, Place, Time variables in epidemiology
- Spot map, epidemic curve - significance
- Age-standardization (direct and indirect methods)
6. BIAS AND CONFOUNDING
- Define bias. Describe the types of bias in epidemiological studies and how to minimize them.
- What is confounding? How is it controlled?
- Selection bias vs. Information bias
- Recall bias
- Berkson's bias
- Confounding variable - definition and methods of control (matching, stratification, randomization, multivariate analysis)
- Neyman's bias (prevalence-incidence bias)
7. SCREENING
- Define screening. Describe the criteria for a good screening test and the principles of screening for disease.
- Explain sensitivity, specificity, positive predictive value, and negative predictive value with formulas.
- Sensitivity and Specificity - definitions, formulas, and trade-off
- Positive Predictive Value (PPV) and Negative Predictive Value (NPV)
- Wilson and Jungner criteria for screening
- Mass screening vs. selective screening
- Lead time bias in screening
8. EPIDEMICS AND OUTBREAK INVESTIGATION
- Describe the steps in investigation of an epidemic (outbreak investigation).
- Classify epidemics. Describe common-source and propagated epidemics with examples and epidemic curves.
- Point source vs. propagated epidemic - differences and epidemic curves
- Steps in epidemic investigation (10 steps)
- Herd immunity threshold formula
- Epidemic curve - types and interpretation
- Food-borne disease outbreak investigation
9. SURVEILLANCE
- Define epidemiological surveillance. Describe the types and uses of surveillance systems.
- Sentinel surveillance
- Active vs. passive surveillance
- Disease notification system in India
- Uses of surveillance data
10. ASSOCIATION AND CAUSATION (Applied)**
- Odds Ratio vs. Relative Risk - when each is used
- Number Needed to Treat (NNT) and Number Needed to Harm (NNH)
- Absolute risk reduction vs. Relative risk reduction
- Population Attributable Risk and Population Attributable Risk Percent
KEY FORMULAS TO MEMORIZE
| Measure | Formula |
|---|---|
| Incidence Rate | New cases / Population at risk × 1000 |
| Prevalence | All existing cases / Total population × 1000 |
| Attack Rate | Cases / Population exposed × 100 |
| Secondary Attack Rate | New cases in household contacts / Total contacts × 100 |
| Case Fatality Rate | Deaths from disease / Cases of disease × 100 |
| Odds Ratio (case-control) | ad / bc |
| Relative Risk (cohort) | Incidence in exposed / Incidence in unexposed |
| Attributable Risk | Incidence exposed - Incidence unexposed |
| Sensitivity | TP / (TP + FN) × 100 |
| Specificity | TN / (TN + FP) × 100 |
| PPV | TP / (TP + FP) × 100 |
| NPV | TN / (TN + FN) × 100 |
MOST LIKELY LONG ESSAY QUESTIONS (10 marks)
- Case-Control study - design, methodology, advantages, disadvantages
- Cohort study - design, types, advantages, disadvantages
- Screening - criteria, sensitivity, specificity, PPV, NPV
- Epidemic investigation - steps
- Bradford Hill's criteria for causation
- Measurements in epidemiology (incidence, prevalence, mortality rates)
- Bias in epidemiological studies
- Randomized Controlled Trial
MOST LIKELY SHORT NOTES (5 marks)
- Odds Ratio
- Herd immunity
- Sentinel surveillance
- Attack rate and secondary attack rate
- Web of causation
- Epidemic curve
- Confounding and its control
- Sensitivity and Specificity
- Standardized Mortality Ratio
- Cross-sectional study
Make pdf
mkdir -p /home/daytona/workspace/epidemiology-pdf
~/epidemiology-pdf/generate_pdf.py
from reportlab.lib.pagesizes import A4
from reportlab.lib.styles import getSampleStyleSheet, ParagraphStyle
from reportlab.lib.units import cm
from reportlab.lib import colors
from reportlab.platypus import (
SimpleDocTemplate, Paragraph, Spacer, Table, TableStyle,
HRFlowable, PageBreak
)
from reportlab.lib.enums import TA_CENTER, TA_LEFT, TA_JUSTIFY
from reportlab.platypus import KeepTogether
OUTPUT = "/home/daytona/workspace/epidemiology-pdf/Epidemiology_Important_Questions.pdf"
doc = SimpleDocTemplate(
OUTPUT,
pagesize=A4,
rightMargin=2*cm,
leftMargin=2*cm,
topMargin=2.5*cm,
bottomMargin=2.5*cm,
title="Important Questions - Epidemiology",
author="Orris Medical Education"
)
styles = getSampleStyleSheet()
# Custom styles
title_style = ParagraphStyle(
'CustomTitle',
parent=styles['Title'],
fontSize=22,
textColor=colors.HexColor('#1a3c6e'),
spaceAfter=6,
alignment=TA_CENTER,
fontName='Helvetica-Bold'
)
subtitle_style = ParagraphStyle(
'Subtitle',
parent=styles['Normal'],
fontSize=11,
textColor=colors.HexColor('#4a6fa5'),
spaceAfter=4,
alignment=TA_CENTER,
fontName='Helvetica'
)
section_style = ParagraphStyle(
'SectionHeading',
parent=styles['Heading1'],
fontSize=13,
textColor=colors.white,
backColor=colors.HexColor('#1a3c6e'),
spaceBefore=14,
spaceAfter=6,
leftIndent=-10,
rightIndent=-10,
borderPad=6,
fontName='Helvetica-Bold'
)
subsection_style = ParagraphStyle(
'SubSection',
parent=styles['Heading2'],
fontSize=11,
textColor=colors.HexColor('#1a3c6e'),
spaceBefore=8,
spaceAfter=4,
fontName='Helvetica-Bold',
borderPad=2,
)
body_style = ParagraphStyle(
'Body',
parent=styles['Normal'],
fontSize=10,
leading=16,
spaceAfter=2,
fontName='Helvetica',
textColor=colors.HexColor('#2d2d2d')
)
bullet_style = ParagraphStyle(
'Bullet',
parent=styles['Normal'],
fontSize=10,
leading=15,
leftIndent=16,
spaceAfter=2,
fontName='Helvetica',
textColor=colors.HexColor('#2d2d2d'),
bulletIndent=4
)
note_style = ParagraphStyle(
'Note',
parent=styles['Normal'],
fontSize=9,
textColor=colors.HexColor('#555555'),
fontName='Helvetica-Oblique',
alignment=TA_CENTER,
spaceBefore=8,
spaceAfter=4
)
def section(title):
return [
Spacer(1, 0.2*cm),
Paragraph(f" {title}", section_style),
Spacer(1, 0.1*cm)
]
def subsection(title):
return Paragraph(title, subsection_style)
def body(text):
return Paragraph(text, body_style)
def bullet(text):
return Paragraph(f"• {text}", bullet_style)
def space(h=0.2):
return Spacer(1, h*cm)
story = []
# ── TITLE PAGE ──
story.append(space(1.5))
story.append(Paragraph("EPIDEMIOLOGY", title_style))
story.append(Paragraph("Important University Exam Questions", subtitle_style))
story.append(Paragraph("Based on Park's Textbook of Preventive and Social Medicine", subtitle_style))
story.append(space(0.3))
story.append(HRFlowable(width="100%", thickness=2, color=colors.HexColor('#1a3c6e')))
story.append(space(0.3))
story.append(Paragraph("Community Medicine | Preventive & Social Medicine", note_style))
story.append(space(2))
# ── SECTION 1: DEFINITIONS ──
story += section("1. DEFINITIONS & CONCEPTS")
story.append(subsection("Long Answer Questions (10 marks)"))
for q in [
"Define epidemiology. Describe the aims and uses of epidemiology.",
"Explain the concept of natural history of disease and the levels of prevention.",
"Describe the differences between epidemiology and clinical medicine."
]:
story.append(bullet(q))
story.append(space())
story.append(subsection("Short Answer Questions (5 marks)"))
for q in [
"Define: Incidence, Prevalence, Attack rate, Secondary attack rate",
"Difference between Incidence and Prevalence",
"Herd immunity — definition and significance",
"Define: Epidemic, Endemic, Pandemic, Sporadic",
"Difference between Rate, Ratio, and Proportion",
"Epidemiology vs. Clinical medicine — key differences"
]:
story.append(bullet(q))
# ── SECTION 2: MEASUREMENTS ──
story += section("2. MEASUREMENTS IN EPIDEMIOLOGY")
story.append(subsection("Long Answer Questions (10 marks)"))
for q in [
"Describe the basic measurements in epidemiology — mortality and morbidity indicators.",
"Explain Crude Death Rate, Specific Death Rate, Standardized Mortality Ratio (SMR) and their uses.",
"Write about measurement of morbidity. Describe incidence and prevalence with formulas and examples."
]:
story.append(bullet(q))
story.append(space())
story.append(subsection("Short Answer Questions (5 marks)"))
for q in [
"Incidence rate — definition and formula",
"Prevalence rate (point vs. period) — definitions and formulas",
"Attack rate and secondary attack rate with formulas",
"Proportional Mortality Rate (PMR)",
"Case Fatality Rate — definition and use",
"Standardized Mortality Ratio (SMR)"
]:
story.append(bullet(q))
# ── SECTION 3: CAUSATION ──
story += section("3. CONCEPT OF CAUSATION")
story.append(subsection("Long Answer Questions (10 marks)"))
for q in [
"Describe the concept of causation in epidemiology. Discuss the Epidemiological Triad, Web of Causation, and Koch's Postulates.",
"Write about Henle-Koch's postulates and their limitations. What are Bradford Hill's criteria of causation?",
"Describe the multifactorial causation model with examples."
]:
story.append(bullet(q))
story.append(space())
story.append(subsection("Short Answer Questions (5 marks)"))
for q in [
"Epidemiological triad — Agent, Host, Environment",
"Web of causation (MacMahon's model)",
"Koch's / Henle-Koch's postulates",
"Bradford Hill's criteria for causation (all 9 criteria)",
"Multifactorial causation",
"Germ theory of disease and its limitations"
]:
story.append(bullet(q))
# ── SECTION 4: STUDY DESIGNS ──
story += section("4. EPIDEMIOLOGICAL STUDY DESIGNS")
story.append(subsection("Long Answer Questions (10 marks)"))
for q in [
"Classify epidemiological study designs. Compare and contrast Case-Control and Cohort studies.",
"Describe the design, methodology, uses, advantages, and disadvantages of a Case-Control study.",
"Describe the design, methodology, types, uses, advantages, and disadvantages of a Cohort study.",
"Write a note on Randomized Controlled Trials (RCTs) — design, advantages, limitations.",
"Describe cross-sectional study — design, uses, and limitations."
]:
story.append(bullet(q))
story.append(space())
story.append(subsection("Short Answer Questions (5 marks)"))
for q in [
"Cross-sectional (prevalence) study — uses and limitations",
"Ecological/Correlational study",
"Prospective vs. Retrospective cohort studies",
"Odds Ratio — definition, formula, and when it is used",
"Relative Risk (Risk Ratio) — definition and formula",
"Attributable risk — definition and significance",
"Double-blind trial",
"Community trial vs. Field trial"
]:
story.append(bullet(q))
# ── SECTION 5: DESCRIPTIVE EPIDEMIOLOGY ──
story += section("5. DESCRIPTIVE EPIDEMIOLOGY")
story.append(subsection("Long Answer Questions (10 marks)"))
for q in [
"Describe descriptive epidemiology. Explain the variables of Person, Place, and Time.",
"Write about the epidemiological approach to disease investigation."
]:
story.append(bullet(q))
story.append(space())
story.append(subsection("Short Answer Questions (5 marks)"))
for q in [
"Person, Place, Time variables in epidemiology",
"Spot map and epidemic curve — significance",
"Age-standardization — direct and indirect methods",
"Secular trend in disease"
]:
story.append(bullet(q))
# ── SECTION 6: BIAS & CONFOUNDING ──
story += section("6. BIAS AND CONFOUNDING")
story.append(subsection("Long Answer Questions (10 marks)"))
for q in [
"Define bias. Describe the types of bias in epidemiological studies and how to minimize them.",
"What is confounding? How is it controlled in epidemiological studies?"
]:
story.append(bullet(q))
story.append(space())
story.append(subsection("Short Answer Questions (5 marks)"))
for q in [
"Selection bias vs. Information bias",
"Recall bias",
"Berkson's bias",
"Confounding variable — definition and methods of control",
"Neyman's bias (prevalence-incidence bias)",
"Methods to control confounding: matching, stratification, randomization, multivariate analysis"
]:
story.append(bullet(q))
# ── SECTION 7: SCREENING ──
story += section("7. SCREENING")
story.append(subsection("Long Answer Questions (10 marks)"))
for q in [
"Define screening. Describe the criteria for a good screening test and the principles of screening.",
"Explain sensitivity, specificity, positive predictive value (PPV), and negative predictive value (NPV) with formulas and a 2×2 table.",
"Describe Wilson and Jungner criteria for screening."
]:
story.append(bullet(q))
story.append(space())
story.append(subsection("Short Answer Questions (5 marks)"))
for q in [
"Sensitivity and Specificity — definitions, formulas, and trade-off",
"Positive Predictive Value (PPV) and Negative Predictive Value (NPV)",
"Wilson and Jungner criteria for screening",
"Mass screening vs. Selective screening",
"Lead time bias in screening",
"ROC curve — interpretation"
]:
story.append(bullet(q))
# ── SECTION 8: EPIDEMICS ──
story += section("8. EPIDEMICS AND OUTBREAK INVESTIGATION")
story.append(subsection("Long Answer Questions (10 marks)"))
for q in [
"Describe the steps in investigation of an epidemic (outbreak investigation).",
"Classify epidemics. Describe common-source and propagated epidemics with examples and epidemic curves.",
"Describe the investigation of a food-borne disease outbreak."
]:
story.append(bullet(q))
story.append(space())
story.append(subsection("Short Answer Questions (5 marks)"))
for q in [
"Point source vs. propagated epidemic — differences and epidemic curves",
"Steps in epidemic investigation (10 steps)",
"Herd immunity threshold",
"Epidemic curve — types and interpretation",
"Mixed epidemic"
]:
story.append(bullet(q))
# ── SECTION 9: SURVEILLANCE ──
story += section("9. SURVEILLANCE")
story.append(subsection("Long Answer Questions (10 marks)"))
for q in [
"Define epidemiological surveillance. Describe the types and uses of surveillance systems.",
"Describe the National Disease Surveillance system in India."
]:
story.append(bullet(q))
story.append(space())
story.append(subsection("Short Answer Questions (5 marks)"))
for q in [
"Sentinel surveillance",
"Active vs. passive surveillance",
"Disease notification system in India",
"Uses of surveillance data",
"Syndromic surveillance"
]:
story.append(bullet(q))
# ── SECTION 10: APPLIED MEASURES ──
story += section("10. ASSOCIATION AND CAUSATION (Applied)")
story.append(subsection("Short Answer Questions (5 marks)"))
for q in [
"Odds Ratio vs. Relative Risk — when each is used",
"Number Needed to Treat (NNT) and Number Needed to Harm (NNH)",
"Absolute Risk Reduction vs. Relative Risk Reduction",
"Population Attributable Risk and Population Attributable Risk Percent",
"P-value and confidence interval — interpretation",
"Type I and Type II errors"
]:
story.append(bullet(q))
# ── FORMULAS TABLE ──
story += section("KEY FORMULAS TO MEMORIZE")
story.append(space(0.3))
formula_data = [
["Measure", "Formula"],
["Incidence Rate", "New cases / Population at risk × 1000"],
["Prevalence", "All existing cases / Total population × 1000"],
["Attack Rate", "Cases / Population exposed × 100"],
["Secondary Attack Rate", "New cases in contacts / Total contacts × 100"],
["Case Fatality Rate", "Deaths from disease / Cases of disease × 100"],
["Odds Ratio (case-control)", "ad / bc"],
["Relative Risk (cohort)", "Incidence in exposed / Incidence in unexposed"],
["Attributable Risk", "Incidence exposed − Incidence unexposed"],
["Sensitivity", "TP / (TP + FN) × 100"],
["Specificity", "TN / (TN + FP) × 100"],
["PPV", "TP / (TP + FP) × 100"],
["NPV", "TN / (TN + FN) × 100"],
]
table = Table(formula_data, colWidths=[6.5*cm, 10*cm])
table.setStyle(TableStyle([
('BACKGROUND', (0, 0), (-1, 0), colors.HexColor('#1a3c6e')),
('TEXTCOLOR', (0, 0), (-1, 0), colors.white),
('FONTNAME', (0, 0), (-1, 0), 'Helvetica-Bold'),
('FONTSIZE', (0, 0), (-1, 0), 10),
('ALIGN', (0, 0), (-1, -1), 'LEFT'),
('VALIGN', (0, 0), (-1, -1), 'MIDDLE'),
('FONTNAME', (0, 1), (-1, -1), 'Helvetica'),
('FONTSIZE', (0, 1), (-1, -1), 9.5),
('ROWBACKGROUNDS', (0, 1), (-1, -1), [colors.HexColor('#f0f4fa'), colors.white]),
('GRID', (0, 0), (-1, -1), 0.5, colors.HexColor('#c0cce0')),
('TOPPADDING', (0, 0), (-1, -1), 6),
('BOTTOMPADDING', (0, 0), (-1, -1), 6),
('LEFTPADDING', (0, 0), (-1, -1), 8),
]))
story.append(table)
# ── TOP QUESTIONS ──
story += section("MOST LIKELY EXAM QUESTIONS")
story.append(space(0.2))
story.append(subsection("Long Essay (10 marks) — Top 8"))
for i, q in enumerate([
"Case-Control study — design, methodology, advantages, disadvantages",
"Cohort study — design, types, advantages, disadvantages",
"Screening — criteria, sensitivity, specificity, PPV, NPV",
"Epidemic investigation — steps",
"Bradford Hill's criteria for causation",
"Measurements in epidemiology (incidence, prevalence, mortality rates)",
"Bias in epidemiological studies",
"Randomized Controlled Trial"
], 1):
story.append(bullet(f"{i}. {q}"))
story.append(space(0.3))
story.append(subsection("Short Notes (5 marks) — Top 10"))
for i, q in enumerate([
"Odds Ratio",
"Herd immunity",
"Sentinel surveillance",
"Attack rate and secondary attack rate",
"Web of causation",
"Epidemic curve",
"Confounding and its control",
"Sensitivity and Specificity",
"Standardized Mortality Ratio",
"Cross-sectional study"
], 1):
story.append(bullet(f"{i}. {q}"))
# ── FOOTER NOTE ──
story.append(space(0.8))
story.append(HRFlowable(width="100%", thickness=1, color=colors.HexColor('#c0cce0')))
story.append(space(0.2))
story.append(Paragraph(
"Source: Park's Textbook of Preventive and Social Medicine | Prepared by Orris Medical Education",
note_style
))
doc.build(story)
print(f"PDF created: {OUTPUT}")
python /home/daytona/workspace/epidemiology-pdf/generate_pdf.py
Epidemiology Important Questions
PDF Document · PDF
- All 10 topic sections with long answer and short answer questions
- A key formulas table (incidence, prevalence, OR, RR, sensitivity, specificity, etc.)
- Top 8 long essay and Top 10 short note questions most likely to appear in exams
- Clean formatting with section headers, bullet points, and a color scheme suitable for printing
- Source credited to Park's Textbook of Preventive and Social Medicine
steps in the investigation of epidemic
Steps in the Investigation of an Epidemic
Objectives of Epidemic Investigation
- Define the magnitude of the outbreak in terms of time, place, and person
- Determine the conditions and factors responsible for its occurrence
- Identify the cause, source of infection, and mode of transmission to guide control measures
- Make recommendations to prevent recurrence
"No step-by-step approach applicable in all situations can be described like a cook-book. However, an orderly procedure is desired." - Park's
The 10 Steps
Step 1 - Verification of Diagnosis
- The first and most essential step before any field action
- The reported cases may be spurious, arising from misinterpretation of signs and symptoms by lay people
- A clinical examination of a sample of cases (not all) is usually sufficient
- Laboratory investigations (stool culture, blood tests, serology) confirm the diagnosis
- Important: Epidemiological investigation must NOT be delayed until laboratory results are available
Step 2 - Confirmation of the Existence of an Epidemic
- Compare current disease frequency with the same period in previous years
- An epidemic exists when observed cases exceed the expected frequency (endemic baseline) for that population
- Statistical rule: an arbitrary limit of two standard errors above endemic occurrence defines the epidemic threshold (e.g., for influenza)
- For some diseases (cholera, food poisoning, hepatitis A), the existence of an epidemic is obvious and needs no comparison
- For modern epidemics (cancer, cardiovascular disease), existence is not easily recognized
Step 3 - Defining the Population at Risk
- Get a detailed and current map with natural landmarks, roads, and locations of all dwelling units
- Divide the area into segments and number houses systematically
- Conduct a house-to-house census by age and sex in the defined area
- This denominator is essential to calculate attack rates in various groups and subgroups
- Without an appropriate denominator ("population at risk"), attack rates cannot be calculated
Step 4 - Rapid Search for All Cases and Their Characteristics
- Name, age, sex, occupation, social class
- Travel history, previous exposure
- Time of onset of disease (for the epidemic curve)
- Signs and symptoms of illness
- Personal contacts (home, work, school)
- Special events: parties attended, foods eaten
- Exposure to common vehicles - water, food, milk
- History of injections, blood products, attendance at large gatherings
Step 5 - Data Analysis by Time, Place, and Person
- Draw an epidemic curve (a histogram of cases by time of onset)
- Reveals the incubation period, the probable time of exposure, and the type of epidemic (point source vs. propagated)
- A sharp spike = point/common source; a series of waves = propagated
- Prepare a spot map marking the residence, workplace, or other relevant location of each case
- Helps identify the geographic focus of the outbreak and possible source
- Calculate attack rates by age, sex, occupation, and other relevant characteristics
- Helps identify the group most affected and points toward the likely source or mode of transmission
Step 6 - Formulation of Hypotheses
- Based on the descriptive data (time, place, person analysis), formulate one or more hypotheses about:
- The causative agent
- The source of infection
- The mode of transmission
- The vehicle of transmission (e.g., contaminated water, specific food item)
- The hypothesis must be consistent with all known epidemiological, clinical, and laboratory facts
Step 7 - Testing the Hypothesis
- Use analytical epidemiological methods to test the hypothesis:
- Case-control study: compare exposure history of cases vs. controls
- Cohort study: compare attack rates in exposed vs. non-exposed groups
- Compare attack rates across groups exposed and not exposed to each suspected factor
- The hypothesis that is consistent with all known facts is accepted
- When divergent theories are presented, turn to arguments tested by the subsequent course of events
Step 8 - Evaluation of Ecological Factors
- Investigate the circumstances and environmental conditions that made the epidemic possible:
- Sanitary status of eating establishments
- Water and milk supply; breakdown in the water supply system
- Movements of the human population
- Atmospheric changes: temperature, humidity, air pollution
- Population dynamics of insects and animal reservoirs
- Relate the disease to environmental factors to identify the source of infection, reservoir, and mode of transmission
Step 9 - Further Investigation of the Population at Risk
- A study of the population at risk (or a sample) may be needed for additional information:
- Medical examinations and screening tests
- Examination of suspected food, faeces, or blood samples
- Biochemical studies
- Assessment of immunity status
- Serological studies may reveal clinically inapparent (subclinical) cases and illuminate pathogenesis
- Classify all members as to: (a) exposure to specific potential vehicles, and (b) whether ill or not
Step 10 - Writing the Report
| Section | Key Contents |
|---|---|
| Background | Geography, climate, demographics, health service organization, normal disease prevalence |
| Historical data | Previous epidemics in the area, first cases of the present outbreak |
| Methodology | Case definition, questionnaire used, survey teams, laboratory methods |
| Results | Attack rates, epidemic curve, spot map, case characteristics |
| Conclusions | Source, mode of transmission, causative agent |
| Recommendations | Immediate control measures, long-term prevention strategies |
Memory Aid
V-C-D-R-D-F-T-E-F-W
| # | Step |
|---|---|
| 1 | Verification of diagnosis |
| 2 | Confirmation of epidemic |
| 3 | Defining population at risk |
| 4 | Rapid search for all cases |
| 5 | Data analysis (Time, Place, Person) |
| 6 | Formulation of hypothesis |
| 7 | Testing the hypothesis |
| 8 | Evaluation of ecological factors |
| 9 | Further investigation of population at risk |
| 10 | Writing the report |
define Spot ap
Spot Map
Definition
- Also called a "dot map"
- Each dot represents the residence, workplace, school, or place of exposure of an individual case
- It is a tool of descriptive epidemiology - specifically the "Place" variable
"Prepare a spot map (geographic distribution) of cases, and if possible, their relation to possible sources of infection, e.g., water supply, air pollution, foods eaten, occupation, etc." - Park's Textbook
Purpose and Uses
- Visualize disease distribution - shows at a glance the areas of high or low disease frequency
- Identify clustering - clustering of dots on the map may suggest a common source of infection or a shared risk factor
- Reveal geographic boundaries of the epidemic
- Suggest source and mode of spread - by relating case locations to environmental features (water supplies, food outlets, factories, etc.)
- Generate hypotheses about cause and transmission
The Classic Example - John Snow (1854)
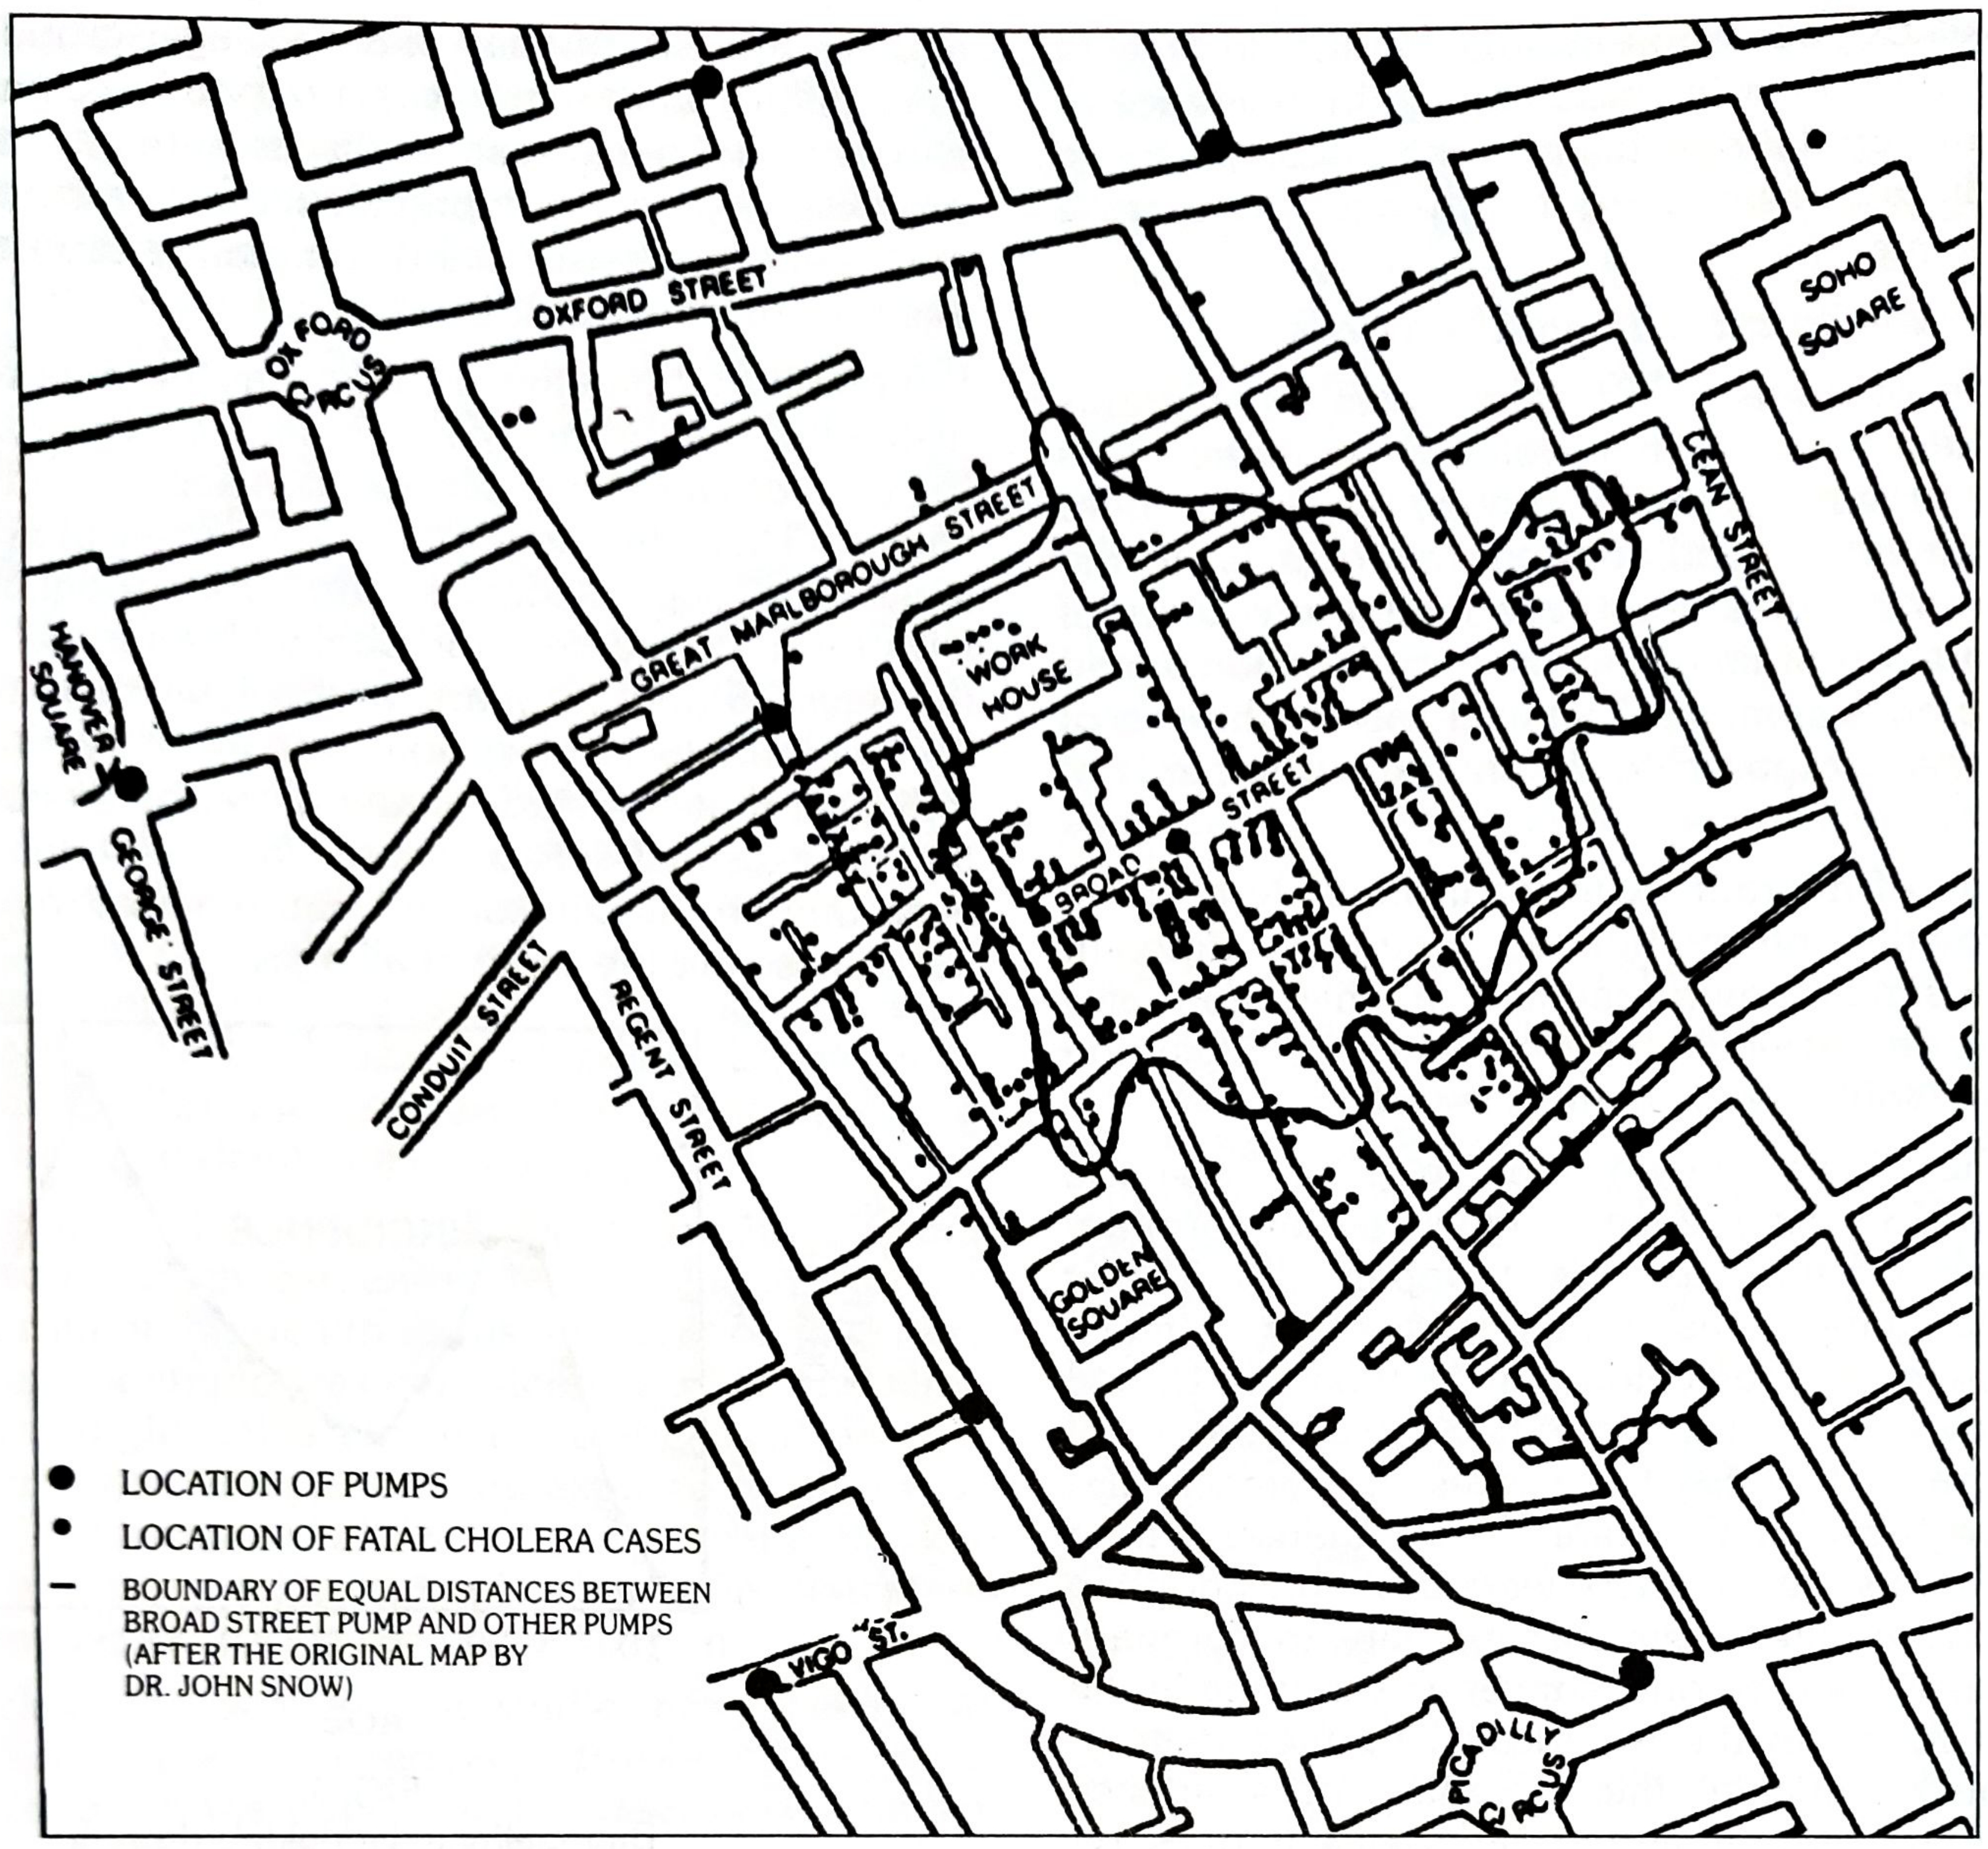
Types of Maps Used in Epidemiology
| Type | Description | Use |
|---|---|---|
| Spot map | Each case = one dot at location of residence/exposure | Outbreak investigation |
| Shaded map (Choropleth) | Areas shaded by disease frequency | Geographic comparisons |
| Area map | Entire administrative area shaded | Broad regional patterns |
Spot Map in Epidemic Investigation (Step 5)
Limitations
- Shows only where cases live/work - not necessarily where exposure occurred
- Does not account for population density (an area with many dots may simply have more people)
- Does not prove causation - only generates hypotheses
Common Source epidemics
Common Source Epidemics
Definition
Classification
(a) Common Source - Single Exposure (Point Source) Epidemic
Definition
Classic Example
- Food poisoning at a party - everyone eats the same contaminated food at the same time
Epidemic Curve
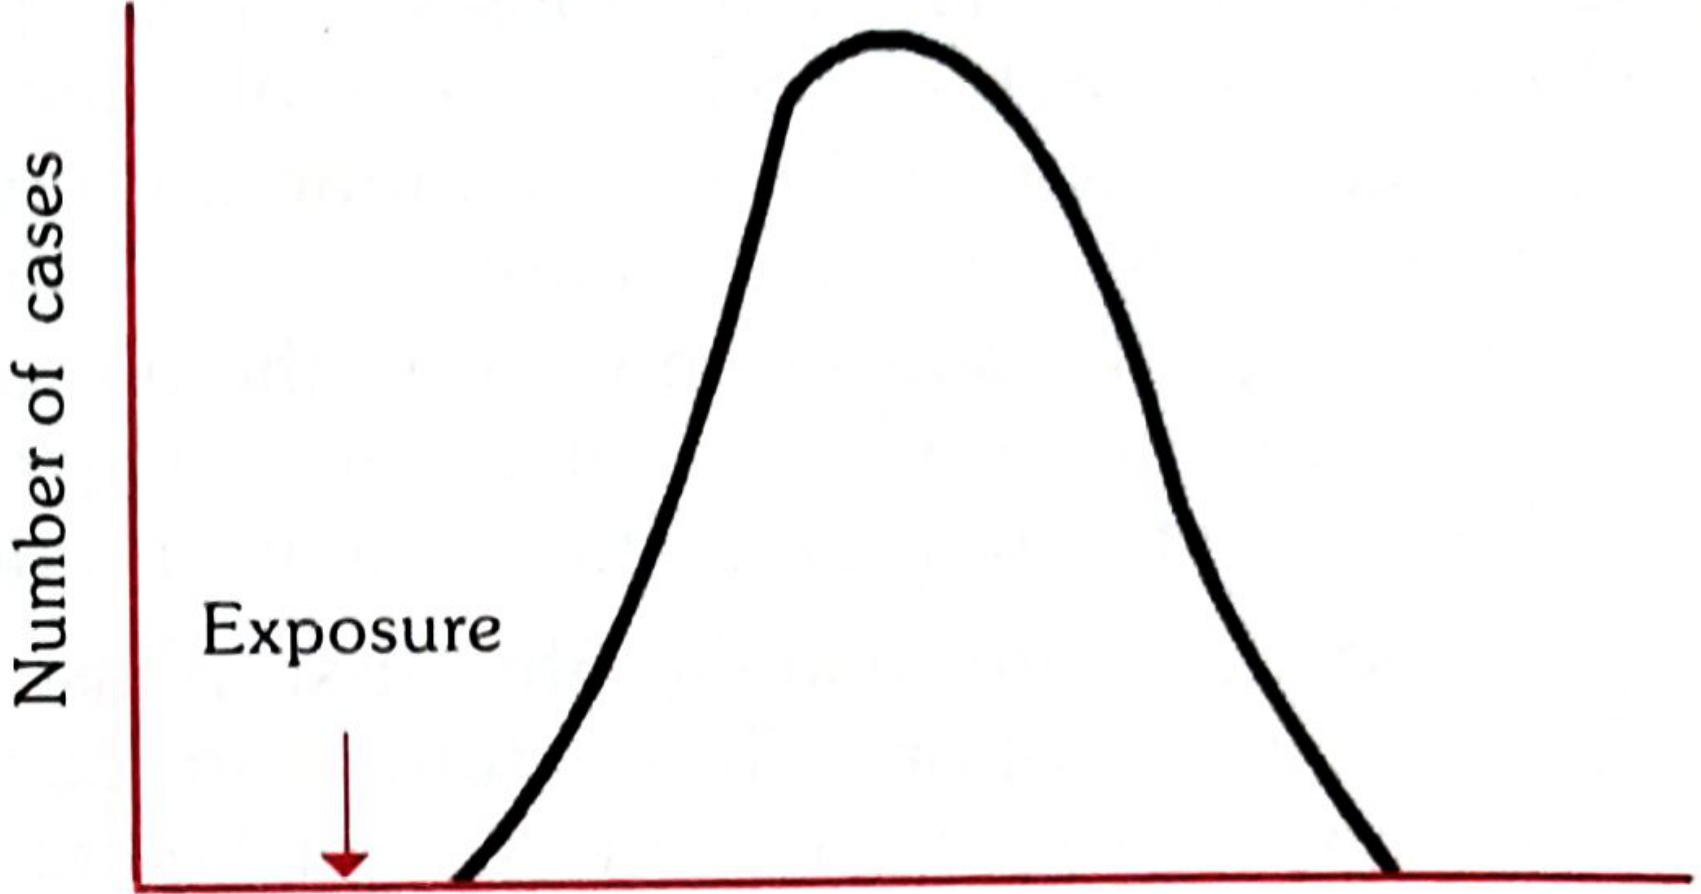
Features (must know for exam)
| Feature | Detail |
|---|---|
| Onset | Explosive - cases cluster within a narrow time interval |
| Peak | One single peak - no secondary waves |
| Duration | All cases develop within one incubation period |
| Epidemic curve shape | Rises sharply, falls rapidly (bell-shaped or skewed) |
| Key measurement | Median incubation period = time for 50% of cases to occur after exposure |
(b) Common Source - Continuous or Repeated Exposure Epidemic
Definition
Features
| Feature | Detail |
|---|---|
| Onset | No explosive rise - cases appear gradually over time |
| Duration | Extends beyond one incubation period |
| Epidemic curve shape | More extended or irregular - no sharp single peak |
| Secondary cases | Usually absent (unlike propagated epidemics) |
Examples
- A contaminated well supplying water to a community over weeks
- A prostitute as the common source in a gonorrhoea outbreak (infects clients over time - no explosive rise)
- A nationally distributed contaminated food product or vaccine (e.g., polio vaccine)
- Legionnaire's disease outbreak in Philadelphia (1976) - caused by a contaminated air-conditioning cooling tower, the outbreak continued beyond one incubation period with no secondary cases among contacts
Important Note - Mixed Epidemic
"Water-borne cholera is a familiar example - the epidemic reaches a sharp peak (common source), but tails off gradually over a longer period of time (propagated spread)."
- A sharp initial peak (from contaminated water source)
- A prolonged tail (from person-to-person spread)
Non-Infectious Common Source Epidemics
- Bhopal gas tragedy (India) - methyl isocyanate gas leak
- Minamata disease (Japan) - consumption of fish containing high concentrations of methyl mercury from industrial effluent
Comparison: Common Source vs. Propagated Epidemic
| Feature | Common Source (Point) | Propagated |
|---|---|---|
| Source | Single common source | Person-to-person / vector |
| Onset | Explosive, simultaneous | Gradual rise |
| Duration | Within one incubation period | Multiple incubation periods |
| Epidemic curve | Single sharp peak, rapid fall | Successive waves, gradual decline |
| Secondary cases | Absent | Present |
| Examples | Food poisoning, cholera (water-borne) | Hepatitis A, polio, measles |
| Control | Remove/eliminate the source | Quarantine, immunization |
Ten maintenance and the equipments using in the experiments.
Cold chain
Cold chain maintenance and experiments using in the epidemics.
Cold Chain - Maintenance and Equipment
Definition
"The cold chain is a system of storage and transport of vaccines at low temperature from the manufacturer to the actual vaccination site."
| Right | Meaning |
|---|---|
| Right vaccine | Correct product |
| Right quantity | No shortage or excess |
| Right place | Correct facility level |
| Right time | When needed |
| Right condition | No temperature break in cold chain |
| Right cost | Economical delivery |
Temperature Requirements for Vaccines
- Heat-sensitive vaccines: Must be kept at +2°C to +8°C (most UIP vaccines)
- Freeze-sensitive vaccines (must NOT go below 0°C): Cholera, DPT, Pentavalent, Hepatitis B, HPV, IPV, TT, Rotavirus, PCV
- Light-sensitive vaccines: BCG, measles, OPV (must be protected from sunlight)
Cold Chain Equipment
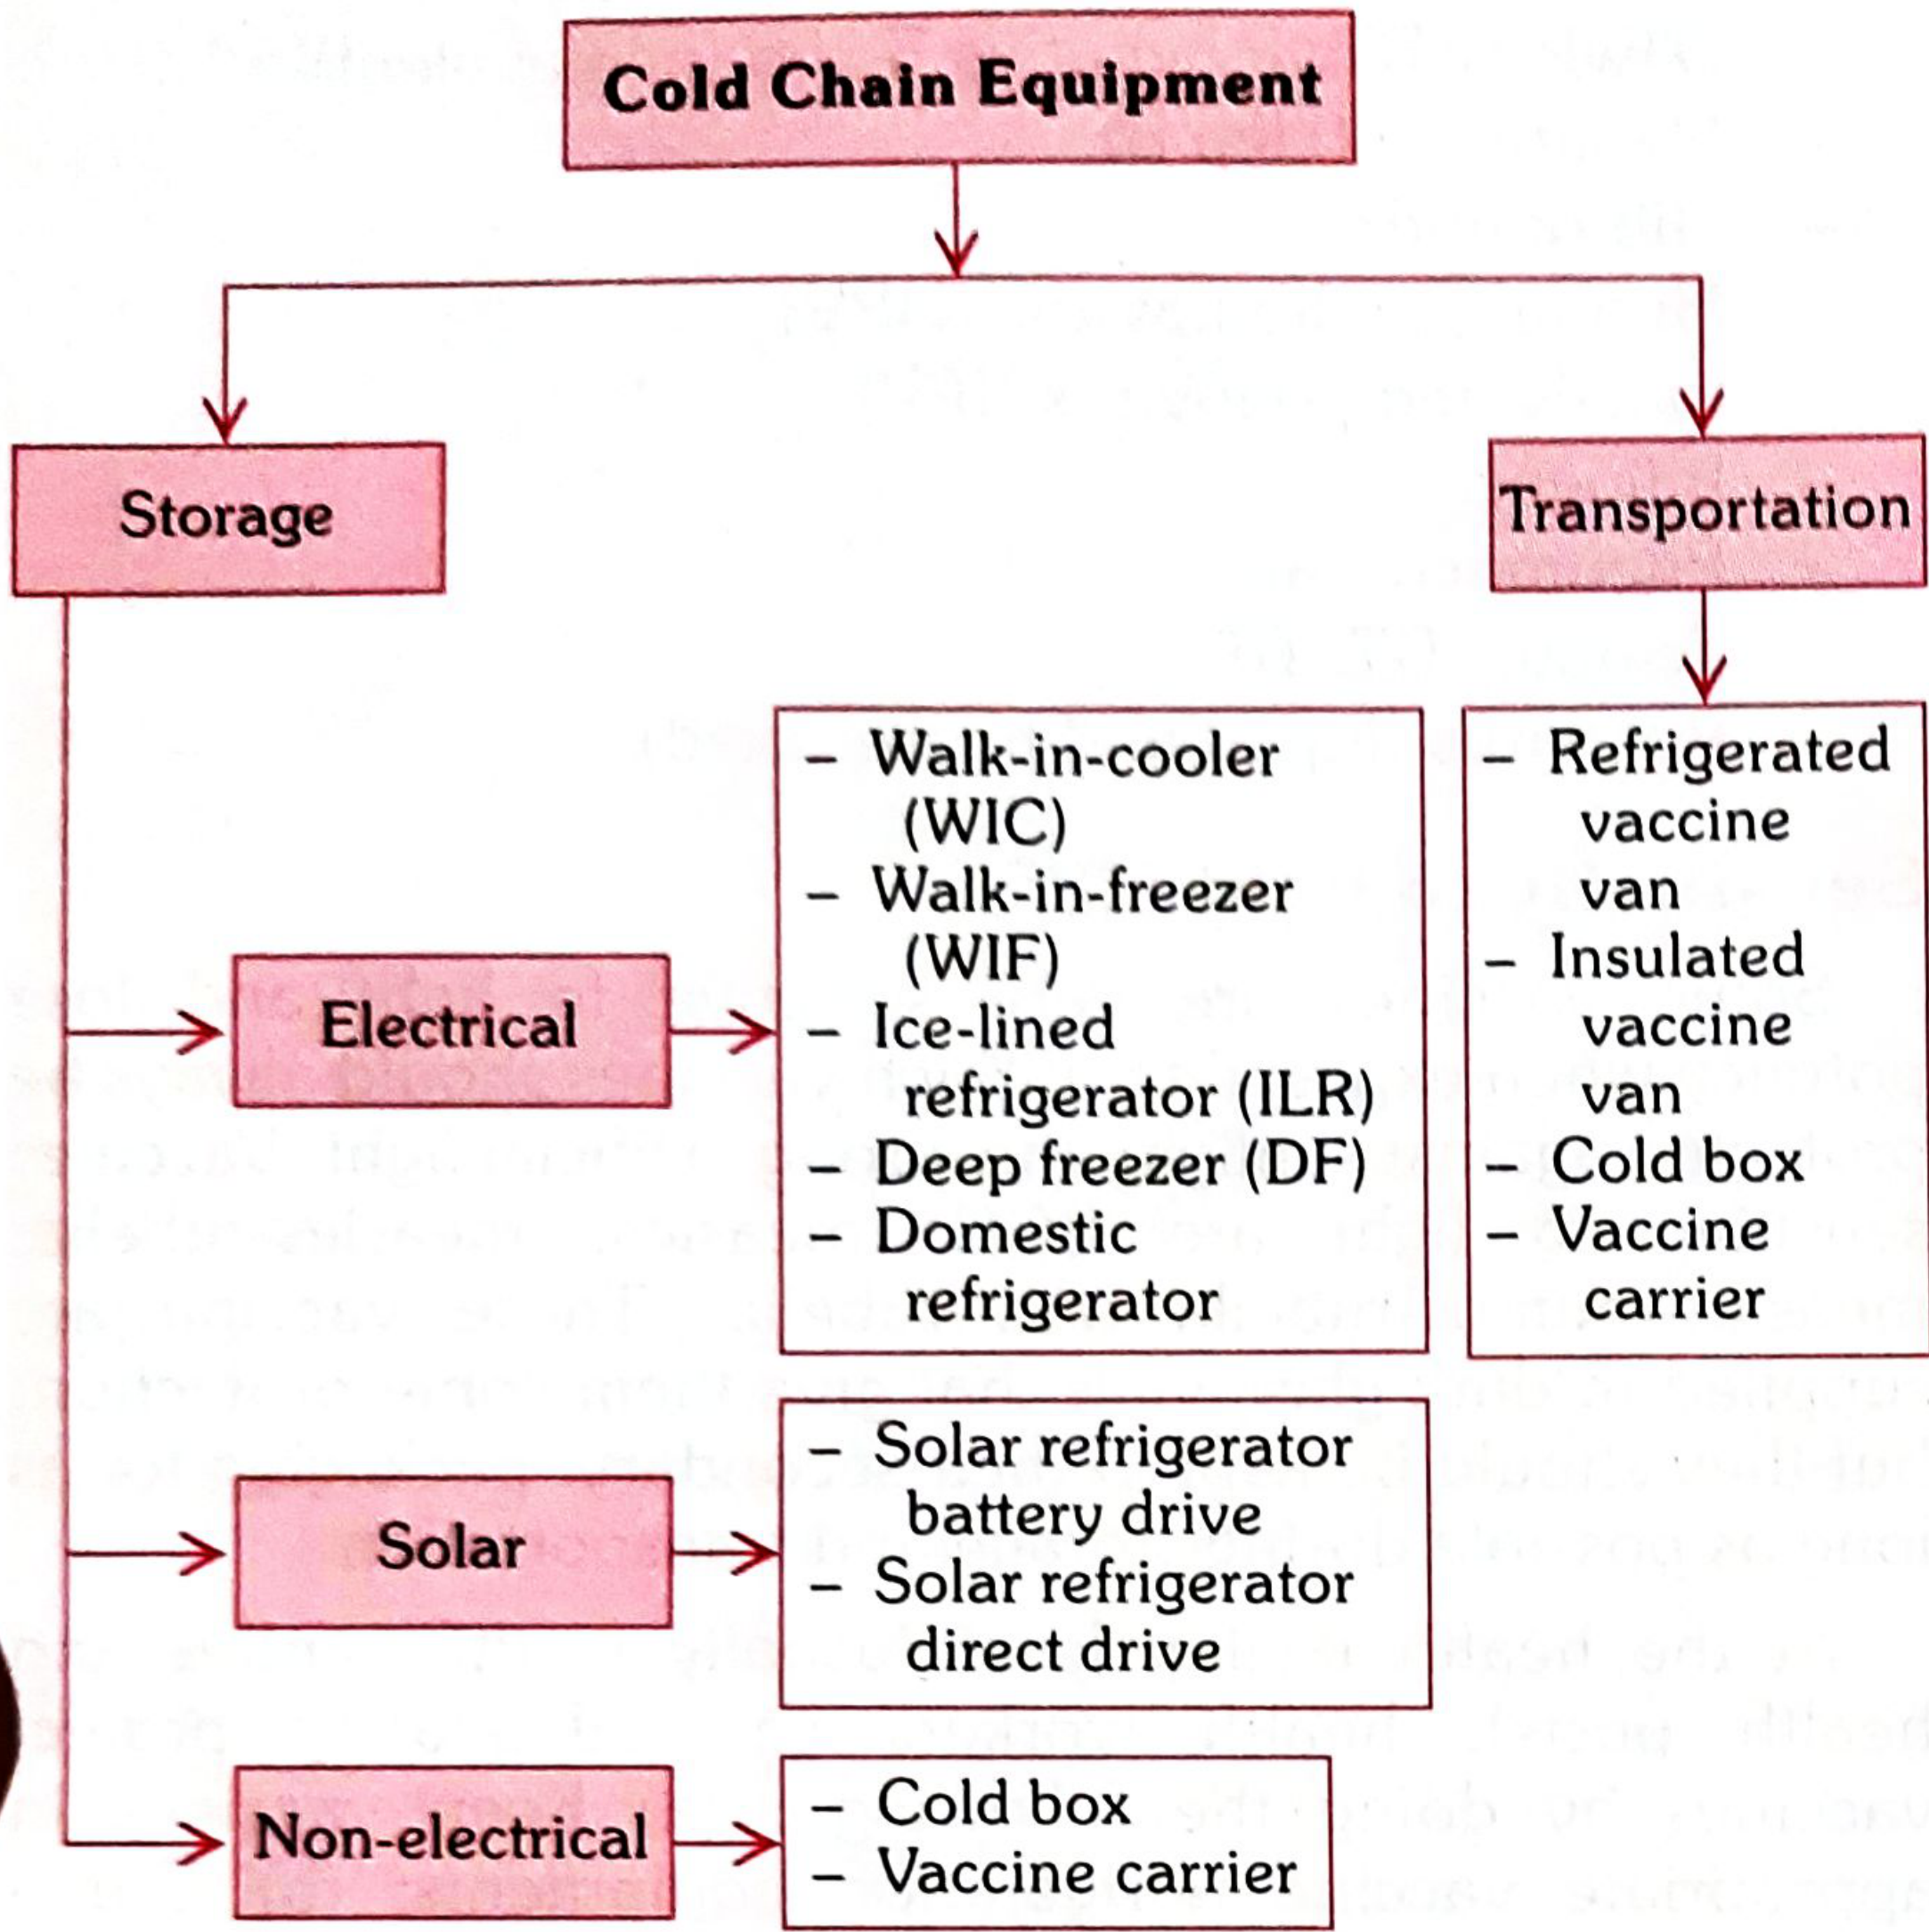
A. STORAGE EQUIPMENT
I. Electrical Cold Chain Equipment
1. Walk-in-Freezer (WIF)
- Pre-fabricated modular PUF (polyurethane foam) insulated cold room
- Maintains temperature: -15°C to -25°C
- Has two identical refrigeration units + standby generator (auto-starts on power cut)
- Location: National, state, and regional vaccine stores
- Use: Bulk storage of OPV and preparation of frozen ice packs
2. Walk-in-Cooler (WIC)
- Pre-fabricated modular PUF insulated cold room
- Maintains temperature: +2°C to +8°C
- Capacity: 16.5, 32, and 40 cubic meters (used in India under UIP)
- Has two cooling units + standby generator with auto start/stop
- Location: Government medical store depots, state/regional vaccine stores
- Use: Storage of large quantities of BCG, Hepatitis B, DPT, Pentavalent, IPV, Measles, TT
- WIC and WIF have continuous temperature recorder and alarm system
3. Deep Freezer (DF)
- Operates on vapour compression system; top-opening lid (prevents cold air loss)
- Maintains temperature: -15°C to -25°C
- Location: District level and above (for OPV storage up to 3 months); sub-district level (for freezing ice packs only)
- Hold-over time: Limited - depends on number of frozen ice packs inside and frequency of opening
- Important: DF used for storing vaccines should NOT be used for preparation of ice packs simultaneously (raises cabinet temperature, harms OPV)
4. Ice-Lined Refrigerator (ILR)
- Most important link in the cold chain
- Top-opening lid (holds cold air better than front-opening)
- Maintains temperature: +2°C to +8°C
- Has a lining of water containers (ice packs/tubes) fitted all around walls
- When electricity works: water freezes and cools the cabinet
- When electricity fails: ice lining maintains safe temperature
- Can keep vaccines safe with minimum 8 hours electricity in 24 hours
- Location: District and sub-district level (PHC headquarters)
| Compartment | Vaccines |
|---|---|
| Bottom of basket | OPV, BCG, Measles, JE (heat-sensitive, not freeze-sensitive) |
| Upper part of basket | DPT, TT, Hepatitis B, IPV, Pentavalent, diluents (freeze-sensitive) |
| Never directly on floor | All vaccines - risk of freezing and damage |
5. Domestic Refrigerator
- Used at PHC/sub-centre level where ILR is unavailable
- Less reliable than ILR for hold-over time
- Maintains +2°C to +8°C
II. Solar Cold Chain Equipment
1. Solar Refrigerator - Battery Drive
- Uses low voltage (12 or 24V) DC compressors charged by solar energy via battery
- Has two compartments:
- Vaccine storage: +2°C to +8°C
- Freezer: up to -7°C (for ice packs)
- Has battery, charge controller, and solar panels
2. Solar Refrigerator - Direct Drive
- Uses sun's energy to freeze phase change material (ice bank)
- Ice bank keeps refrigerator cold during night and cloudy days
- Wired directly to photovoltaic generators (no battery)
III. Non-Electrical Storage Equipment
6. Cold Box
- Insulated container used to store vaccines without electricity
- Used when electricity is unavailable or during transport
- Maintains temperature for several hours with ice packs
7. Vaccine Carrier
- Small insulated box used to carry vaccines to outreach/immunization sessions
- Holds 4 ice packs
- Maintains temperature of +2°C to +8°C for several hours
B. TRANSPORTATION EQUIPMENT
| Equipment | Use |
|---|---|
| Refrigerated vaccine van | Transport of large quantities; maintains cold chain during transit |
| Insulated vaccine van | Transport with ice packs; no active refrigeration |
| Cold box | Short-distance transport and outreach |
| Vaccine carrier | Last-mile delivery to immunization sessions |
Hold-Over Time
"In the event of power failure, hold-over time is the time taken by equipment to raise the inside cabinet temperature from its temperature at the time of power cut to the maximum temperature limit of its recommended range."
| Equipment | Hold-over Time |
|---|---|
| ILR | Longest (hours to days, due to ice lining) |
| Deep Freezer | Limited (depends on ice packs and frequency of opening) |
| Vaccine Carrier | Several hours |
9. Ice Packs
- Contain water only (no salt to be added)
- Water filled up to the marked level
- Leaking ice packs must be discarded
- Used inside ILR, cold boxes, and vaccine carriers
Cold Chain Maintenance - Key Points
- Never store vaccines directly on the floor of ILR (freezing damage)
- Freeze-sensitive vaccines (DPT, TT, Hep B) always in the upper basket of ILR
- Always monitor temperature with thermometers and temperature logs (twice daily)
- VVM (Vaccine Vial Monitor) - a heat-sensitive label on vaccine vials; changes color if heat exposure has occurred; discard if inner square is same color or darker than outer circle
- Shake test - used to detect if freeze-sensitive vaccines have been frozen accidentally
- Vaccines are not stored at sub-centre level - risk of cold chain failure is greatest here; vaccines must be supplied on the day of use
- Open vial policy (2015): Partially used multi-dose vials of DPT, TT, Hep B, OPV, Pentavalent, PCV, IPV can be reused in subsequent sessions up to 28 days (subject to conditions)
uses of epidemiology
Uses of Epidemiology
Introduction
Aims of Epidemiology (IEA)
- To describe the distribution and magnitude of health and disease problems in human populations
- To identify aetiological factors (risk factors) in the pathogenesis of disease
- To provide data essential to planning, implementation, and evaluation of health services and to the setting up of priorities
The ultimate aim is to lead to effective action - to eliminate or reduce health problems and to promote health and well-being of society as a whole.
The 7 Uses of Epidemiology (Morris)
1. To Study the Historical Rise and Fall of Disease in the Population
- Winston Churchill said: "The farther back you look, the farther forward you can see."
- The health and disease pattern in a community is never constant - it fluctuates over short and long periods of time
- Epidemiology first showed that coronary heart disease was an "epidemic" - later, accidents, cancer, and diabetes were also found to be epidemic
- As old diseases (e.g., smallpox) are conquered, new ones (e.g., Legionnaire's disease, Lassa fever, AIDS) have emerged - and epidemiology played a major role in each
- By studying time trends, we can make useful projections into the future and identify emerging health problems
2. Community Diagnosis
- Refers to the identification and quantification of health problems in a community in terms of mortality and morbidity rates and ratios
- Identifies groups at risk or those in need of health care
- Serves three purposes:
- (a) Lays down priorities in disease control and prevention
- (b) Serves as a benchmark for evaluation of health services at a later date
- (c) Is a source of new knowledge about disease distribution, causation, and prevention
- Extends beyond disease profiles to include understanding of social, cultural, and environmental characteristics of the community
Epidemiology is described as a "diagnostic tool" of community medicine
3. Planning and Evaluation of Health Services
- Epidemiological data provides the fundamental basis for planning and developing needed health services
- Examples:
- Planning medical care facilities (e.g., number of hospital beds, health manpower planning)
- Planning preventive services (e.g., screening programmes, immunization campaigns, sanitary services)
- Planning for research
- The application of epidemiological principles to health care problems constitutes "new epidemiology"
- Any measures taken to control or prevent disease must be evaluated for effectiveness in reducing disease frequency
- Evaluation also involves measuring cost in terms of vaccine, trained personnel, storage, transport, etc.
- Example: Evaluating the hepatitis vaccine requires not just proving effectiveness, but also measuring cost-effectiveness of large-scale application
4. Evaluation of Individual's Risks and Chances
- Epidemiologists make statements about the degree of risk in a population
- Measures used:
- Absolute risk - incidence rate, specific rates
- Relative risk - comparing exposed vs. non-exposed
- Attributable risk - portion of disease attributable to a factor
- Classic examples:
- Risk of bearing a Down syndrome (mongoloid) child with advancing maternal age
- Risk of hereditary disorders
- Smoking vs. non-smoking risk assessment for lung cancer and coronary heart disease (CHD)
- This use helps in individual counselling and targeted prevention
5. Syndrome Identification
- Medical syndromes are identified by observing frequently associated findings in individual patients
- Epidemiological investigations can be used to define and refine syndromes - and to correct misconceptions
- Examples:
- The two types of peptic ulcer (gastric and duodenal) were not well-appreciated until 1920. The "poverty gradient" in gastric ulcer certification (but not in duodenal ulcer) helped differentiate them - a contribution of epidemiology
- Patterson-Kelly syndrome (association between dysphagia and iron-deficiency anaemia) - when tested by epidemiological methods, the association was not confirmed
- Essential hypertension: Plasma renin levels have suggested that aetiologically, prognostically, and therapeutically distinct syndromes may exist
- Note: Of ~3000 syndromes described in paediatric literature, the primary defect is known only in about 20% - epidemiology helps explore the rest
6. Completing the Natural History of Disease
- Epidemiology is concerned with the entire spectrum of disease in a population - both clinical and sub-clinical
- The picture of disease constructed on the basis of hospital patients is incomplete - it differs from what is found in the community
- The epidemiologist, by studying disease patterns in the community (agent, host, environment), fills gaps in the natural history of disease that the clinician cannot
- Classic example:
- Ischaemic heart disease: Epidemiology revealed that one-third to two-thirds of all deaths due to IHD are sudden (occur within less than 1 hour). Hospital studies could never have reached this conclusion because these patients never reach the hospital
7. Searching for Causes and Risk Factors
- Epidemiology identifies causes by relating disease to inter-population differences and attributes of populations or cohorts
- Major discoveries through epidemiology:
- Rubella causes congenital defects in newborns
- Thalidomide is a teratogenic agent
- Cigarette smoking causes lung cancer
- Oxygen exposure in premature babies causes retrolental fibroplasia
- For chronic diseases, a single cause is often not found; instead, the concept of "risk factors" is used
- The concept of risk factors gave renewed impetus to epidemiological research
- The search for causes and risk factors is a ceaseless effort, as our knowledge of disease aetiology - particularly chronic disease - remains incomplete
Summary Table
| # | Use | Key Point |
|---|---|---|
| 1 | Historical study | Track rise and fall of diseases; forecast future trends |
| 2 | Community diagnosis | Identify and quantify health problems; identify groups at risk |
| 3 | Planning and evaluation | Rational allocation of resources; evaluate effectiveness of services |
| 4 | Individual risk evaluation | Calculate relative risk, attributable risk; individual counselling |
| 5 | Syndrome identification | Define and refine clinical syndromes using population data |
| 6 | Natural history of disease | Fill gaps that hospital-based studies miss; understand full disease spectrum |
| 7 | Search for causes/risk factors | Identify aetiology, risk factors, and causal relationships |
Memory Aid
"H C P E S N S" History - Community diagnosis - Planning - Evaluation of risk - Syndrome identification - Natural history - Search for causes
uses of epidemiology
7 Uses of Epidemiology (Morris)
| # | Use | One-line Summary |
|---|---|---|
| 1 | Historical study of disease | Track the rise and fall of diseases over time; forecast future trends |
| 2 | Community diagnosis | Identify and quantify health problems; identify groups at risk |
| 3 | Planning and evaluation | Rational allocation of resources; evaluate effectiveness of health services |
| 4 | Evaluation of individual risks | Calculate relative risk and attributable risk; individual counselling |
| 5 | Syndrome identification | Define and refine clinical syndromes using population data |
| 6 | Natural history of disease | Fill gaps that hospital studies miss; understand the full disease spectrum |
| 7 | Search for causes and risk factors | Identify aetiology, risk factors, and causal relationships |
Memory Aid
H - C - P - E - S - N - S
- History of disease
- Community diagnosis
- Planning and evaluation
- Evaluation of individual risk
- Syndrome identification
- Natural history of disease
- Search for causes
Create a PDF summary of uses of epidemiology for exam prep
~/epidemiology-pdf/uses_of_epidemiology.py
from reportlab.lib.pagesizes import A4
from reportlab.lib.styles import getSampleStyleSheet, ParagraphStyle
from reportlab.lib.units import cm
from reportlab.lib import colors
from reportlab.platypus import (
SimpleDocTemplate, Paragraph, Spacer, Table, TableStyle,
HRFlowable, KeepTogether
)
from reportlab.lib.enums import TA_CENTER, TA_LEFT, TA_JUSTIFY
OUTPUT = "/home/daytona/workspace/epidemiology-pdf/Uses_of_Epidemiology_Exam_Prep.pdf"
doc = SimpleDocTemplate(
OUTPUT,
pagesize=A4,
rightMargin=2*cm,
leftMargin=2*cm,
topMargin=2.5*cm,
bottomMargin=2.5*cm,
title="Uses of Epidemiology - Exam Prep",
author="Orris Medical Education"
)
W = A4[0] - 4*cm # usable width
# ── STYLES ──
styles = getSampleStyleSheet()
title_style = ParagraphStyle('T', parent=styles['Title'],
fontSize=24, textColor=colors.HexColor('#1a3c6e'),
spaceAfter=4, alignment=TA_CENTER, fontName='Helvetica-Bold')
subtitle_style = ParagraphStyle('Sub', parent=styles['Normal'],
fontSize=11, textColor=colors.HexColor('#4a6fa5'),
spaceAfter=3, alignment=TA_CENTER, fontName='Helvetica-Oblique')
section_style = ParagraphStyle('Sec', parent=styles['Normal'],
fontSize=12, textColor=colors.white,
fontName='Helvetica-Bold', alignment=TA_LEFT,
leftIndent=8, rightIndent=8, spaceBefore=10, spaceAfter=4)
use_num_style = ParagraphStyle('UseNum', parent=styles['Normal'],
fontSize=13, textColor=colors.HexColor('#1a3c6e'),
fontName='Helvetica-Bold', spaceBefore=8, spaceAfter=2)
body_style = ParagraphStyle('Body', parent=styles['Normal'],
fontSize=10, leading=15, spaceAfter=3,
fontName='Helvetica', textColor=colors.HexColor('#2d2d2d'),
alignment=TA_JUSTIFY)
bullet_style = ParagraphStyle('Bul', parent=styles['Normal'],
fontSize=10, leading=14, leftIndent=14, spaceAfter=2,
fontName='Helvetica', textColor=colors.HexColor('#2d2d2d'),
bulletIndent=4)
example_style = ParagraphStyle('Ex', parent=styles['Normal'],
fontSize=9.5, leading=14, leftIndent=14, spaceAfter=2,
fontName='Helvetica-Oblique', textColor=colors.HexColor('#555555'))
note_style = ParagraphStyle('Note', parent=styles['Normal'],
fontSize=9, textColor=colors.HexColor('#666666'),
fontName='Helvetica-Oblique', alignment=TA_CENTER,
spaceBefore=6, spaceAfter=4)
quote_style = ParagraphStyle('Quote', parent=styles['Normal'],
fontSize=10.5, leading=15, leftIndent=20, rightIndent=20,
fontName='Helvetica-Oblique', textColor=colors.HexColor('#1a3c6e'),
spaceBefore=4, spaceAfter=4)
def sp(h=0.25): return Spacer(1, h*cm)
def hr(color='#c0cce0', t=0.7): return HRFlowable(width="100%", thickness=t, color=colors.HexColor(color))
def section_bar(text):
data = [[Paragraph(f" {text}", section_style)]]
t = Table(data, colWidths=[W])
t.setStyle(TableStyle([
('BACKGROUND', (0,0), (-1,-1), colors.HexColor('#1a3c6e')),
('TOPPADDING', (0,0), (-1,-1), 6),
('BOTTOMPADDING', (0,0), (-1,-1), 6),
('LEFTPADDING', (0,0), (-1,-1), 0),
]))
return t
def use_block(num, title, color_hex):
data = [[Paragraph(f" USE {num} — {title}", ParagraphStyle('UB',
parent=styles['Normal'],
fontSize=11.5, textColor=colors.white,
fontName='Helvetica-Bold',
leftIndent=6))]]
t = Table(data, colWidths=[W])
t.setStyle(TableStyle([
('BACKGROUND', (0,0), (-1,-1), colors.HexColor(color_hex)),
('TOPPADDING', (0,0), (-1,-1), 7),
('BOTTOMPADDING', (0,0), (-1,-1), 7),
('LEFTPADDING', (0,0), (-1,-1), 0),
('RIGHTPADDING', (0,0), (-1,-1), 4),
]))
return t
def bullet(text): return Paragraph(f"• {text}", bullet_style)
def example(text): return Paragraph(f" ✦ {text}", example_style)
def body(text): return Paragraph(text, body_style)
def quote(text): return Paragraph(f'"{text}"', quote_style)
story = []
# ══════════════════════════════════════════════
# TITLE
# ══════════════════════════════════════════════
story.append(sp(0.5))
story.append(Paragraph("USES OF EPIDEMIOLOGY", title_style))
story.append(Paragraph("Exam Preparation Summary", subtitle_style))
story.append(Paragraph("Based on Park's Textbook of Preventive and Social Medicine", subtitle_style))
story.append(sp(0.3))
story.append(hr('#1a3c6e', 2))
story.append(sp(0.2))
# Definition box
def_data = [[Paragraph(
'<b>Definition:</b> Epidemiology has been defined as <i>"a means of learning, '
'or asking questions and getting answers that lead to further questions."</i>',
ParagraphStyle('Def', parent=styles['Normal'], fontSize=10.5, leading=16,
fontName='Helvetica', textColor=colors.HexColor('#1a3c6e'),
leftIndent=6, rightIndent=6))]]
def_table = Table(def_data, colWidths=[W])
def_table.setStyle(TableStyle([
('BACKGROUND', (0,0), (-1,-1), colors.HexColor('#eef3fb')),
('BOX', (0,0), (-1,-1), 1, colors.HexColor('#4a6fa5')),
('TOPPADDING', (0,0), (-1,-1), 10),
('BOTTOMPADDING', (0,0), (-1,-1), 10),
('LEFTPADDING', (0,0), (-1,-1), 12),
('RIGHTPADDING', (0,0), (-1,-1), 12),
]))
story.append(def_table)
story.append(sp(0.3))
# IEA Aims
story.append(section_bar("AIMS OF EPIDEMIOLOGY (IEA) — 3 Main Aims"))
story.append(sp(0.15))
for a in [
"Describe the <b>distribution and magnitude</b> of health and disease in human populations",
"Identify <b>aetiological factors (risk factors)</b> in the pathogenesis of disease",
"Provide data for <b>planning, implementation, and evaluation</b> of health services and setting priorities"
]:
story.append(bullet(a))
story.append(sp(0.1))
story.append(quote("The ultimate aim is to eliminate or reduce health problems and promote the health and well-being of society as a whole."))
story.append(sp(0.2))
# ══════════════════════════════════════════════
# 7 USES
# ══════════════════════════════════════════════
story.append(section_bar("7 USES OF EPIDEMIOLOGY — MORRIS (1957)"))
story.append(sp(0.2))
# Color palette for 7 uses
colors_list = ['#1a3c6e','#2e6da4','#3a7fc1','#2980b9','#1f618d','#154360','#1b4f72']
# ── USE 1 ──
story.append(use_block(1, "To Study the Historical Rise and Fall of Disease", colors_list[0]))
story.append(sp(0.1))
story.append(body('Epidemiology tracks how disease patterns change over time — both over short and long periods. By studying history, we can project into the future.'))
story.append(bullet('Winston Churchill: <i>"The farther back you look, the farther forward you can see."</i>'))
story.append(bullet('Coronary heart disease was first recognised as an <b>"epidemic"</b> through epidemiology'))
story.append(bullet('As old diseases (smallpox) are conquered, new ones (AIDS, Legionnaire\'s disease, Lassa fever) are identified — epidemiology plays a key role each time'))
story.append(bullet('Epidemiology provides a means to study <b>disease profiles, time trends</b> and identify <b>emerging health problems</b>'))
story.append(sp(0.15))
# ── USE 2 ──
story.append(use_block(2, "Community Diagnosis", colors_list[1]))
story.append(sp(0.1))
story.append(body('Identification and quantification of health problems in a community in terms of mortality and morbidity rates; identifies groups at risk or those in need of health care.'))
story.append(bullet('<b>Three purposes of community diagnosis:</b>'))
story.append(example('(a) Lays down priorities in disease control and prevention'))
story.append(example('(b) Serves as a benchmark for evaluation of health services later'))
story.append(example('(c) Source of new knowledge about disease distribution, causation, and prevention'))
story.append(bullet('Extends beyond illness profiles to include <b>social, cultural, and environmental</b> characteristics'))
story.append(bullet('Epidemiology is called the <b>"diagnostic tool of community medicine"</b>'))
story.append(sp(0.15))
# ── USE 3 ──
story.append(use_block(3, "Planning and Evaluation of Health Services", colors_list[2]))
story.append(sp(0.1))
story.append(body('Epidemiological data provides the fundamental basis for planning and developing health services and for assessing their impact.'))
story.append(bullet('<b>Planning includes:</b>'))
story.append(example('• Medical care: number of hospital beds, health manpower planning'))
story.append(example('• Preventive services: screening programmes, immunization campaigns, sanitary services'))
story.append(example('• Research planning'))
story.append(bullet('<b>Evaluation:</b> Any disease control measure must be evaluated for <b>effectiveness AND cost-effectiveness</b>'))
story.append(bullet('Application of epidemiological principles to health care = <b>"New Epidemiology"</b>'))
story.append(sp(0.15))
# ── USE 4 ──
story.append(use_block(4, "Evaluation of Individual Risks and Chances", colors_list[3]))
story.append(sp(0.1))
story.append(body('Epidemiologists quantify the degree of risk in a population and translate that into individual risk assessment.'))
story.append(bullet('Measures used: <b>Incidence rate</b> (absolute risk), <b>Relative risk</b>, <b>Attributable risk</b>'))
story.append(bullet('<b>Examples:</b>'))
story.append(example('• Risk of bearing a Down syndrome child with advancing maternal age'))
story.append(example('• Risk of hereditary disorders'))
story.append(example('• Smokers vs. non-smokers: risk for lung cancer and coronary heart disease (CHD)'))
story.append(bullet('Helps in <b>individual counselling</b> and <b>targeted prevention</b>'))
story.append(sp(0.15))
# ── USE 5 ──
story.append(use_block(5, "Syndrome Identification", colors_list[4]))
story.append(sp(0.1))
story.append(body('Epidemiological investigations can define and refine medical syndromes, and correct misconceptions — something impossible from individual patient observations alone.'))
story.append(bullet('Of ~3,000 syndromes described in paediatric literature, primary defect is known in only <b>~20%</b>'))
story.append(bullet('<b>Examples:</b>'))
story.append(example('• Gastric vs. duodenal ulcer differentiation: "poverty gradient" seen in gastric ulcer but not duodenal — identified by epidemiology (1920s)'))
story.append(example('• Patterson-Kelly syndrome (dysphagia + iron-deficiency anaemia): when tested epidemiologically, the association was NOT confirmed'))
story.append(example('• Essential hypertension: epidemiology suggested aetiologically distinct subtypes based on plasma renin levels'))
story.append(sp(0.15))
# ── USE 6 ──
story.append(use_block(6, "Completing the Natural History of Disease", colors_list[5]))
story.append(sp(0.1))
story.append(body('Epidemiology covers the entire disease spectrum in a population — clinical and sub-clinical — filling gaps that hospital-based studies cannot.'))
story.append(bullet('Hospital studies give an <b>incomplete and biased picture</b> of disease'))
story.append(bullet('The epidemiologist studies disease patterns in the community (agent-host-environment) and fills gaps in natural history'))
story.append(bullet('<b>Classic example:</b>'))
story.append(example('• Ischaemic Heart Disease (IHD): Epidemiology revealed that 1/3 to 2/3 of all IHD deaths are SUDDEN (occur within <1 hour). Hospital studies could never have discovered this — because these patients never reach the hospital!'))
story.append(sp(0.15))
# ── USE 7 ──
story.append(use_block(7, "Searching for Causes and Risk Factors", colors_list[6]))
story.append(sp(0.1))
story.append(body('Epidemiology identifies causes by relating disease to inter-population differences and population attributes. The concept of "risk factors" gave renewed impetus to epidemiological research.'))
story.append(bullet('<b>Major discoveries through epidemiology:</b>'))
story.append(example('• Rubella → congenital defects in newborns'))
story.append(example('• Thalidomide → teratogenic agent'))
story.append(example('• Cigarette smoking → lung cancer'))
story.append(example('• Oxygen exposure in premature babies → retrolental fibroplasia'))
story.append(bullet('For chronic diseases: concept of <b>"risk factors"</b> used instead of single cause'))
story.append(bullet('The search for causes and risk factors is a <b>ceaseless effort</b> — especially for chronic and "new" diseases'))
story.append(sp(0.3))
# ══════════════════════════════════════════════
# SUMMARY TABLE
# ══════════════════════════════════════════════
story.append(section_bar("QUICK REVISION TABLE"))
story.append(sp(0.2))
table_data = [
[Paragraph('<b>#</b>', ParagraphStyle('th', parent=styles['Normal'], fontSize=10, fontName='Helvetica-Bold', textColor=colors.white, alignment=TA_CENTER)),
Paragraph('<b>Use</b>', ParagraphStyle('th', parent=styles['Normal'], fontSize=10, fontName='Helvetica-Bold', textColor=colors.white)),
Paragraph('<b>Key Point / Example</b>', ParagraphStyle('th', parent=styles['Normal'], fontSize=10, fontName='Helvetica-Bold', textColor=colors.white))],
['1', 'Historical study', 'Rise/fall of diseases; forecast future trends (Churchill quote)'],
['2', 'Community diagnosis', '"Diagnostic tool of community medicine"; quantify morbidity & mortality'],
['3', 'Planning & evaluation', 'Hospital beds, manpower, immunization; cost-effectiveness evaluation'],
['4', 'Individual risk evaluation', 'Relative risk, attributable risk; Down syndrome, smoking-cancer risk'],
['5', 'Syndrome identification', 'Gastric vs. duodenal ulcer; Patterson-Kelly syndrome correction'],
['6', 'Natural history of disease', 'IHD: 1/3–2/3 deaths sudden — missed by hospital studies'],
['7', 'Search for causes/risk factors', 'Rubella, thalidomide, smoking, oxygen; concept of risk factors'],
]
cell_style = ParagraphStyle('cell', parent=styles['Normal'], fontSize=9.5, fontName='Helvetica', leading=13)
formatted_data = [table_data[0]]
for row in table_data[1:]:
formatted_data.append([
Paragraph(f'<b>{row[0]}</b>', ParagraphStyle('n', parent=styles['Normal'], fontSize=10, fontName='Helvetica-Bold', alignment=TA_CENTER, textColor=colors.HexColor('#1a3c6e'))),
Paragraph(f'<b>{row[1]}</b>', ParagraphStyle('n', parent=styles['Normal'], fontSize=9.5, fontName='Helvetica-Bold', textColor=colors.HexColor('#1a3c6e'))),
Paragraph(row[2], cell_style),
])
summary_table = Table(formatted_data, colWidths=[1.2*cm, 4.8*cm, 10.5*cm])
summary_table.setStyle(TableStyle([
('BACKGROUND', (0,0), (-1,0), colors.HexColor('#1a3c6e')),
('TEXTCOLOR', (0,0), (-1,0), colors.white),
('FONTNAME', (0,0), (-1,0), 'Helvetica-Bold'),
('FONTSIZE', (0,0), (-1,0), 10),
('ALIGN', (0,0), (0,-1), 'CENTER'),
('VALIGN', (0,0), (-1,-1), 'MIDDLE'),
('ROWBACKGROUNDS', (0,1), (-1,-1), [colors.HexColor('#f0f4fa'), colors.white]),
('GRID', (0,0), (-1,-1), 0.5, colors.HexColor('#c0cce0')),
('TOPPADDING', (0,0), (-1,-1), 6),
('BOTTOMPADDING', (0,0), (-1,-1), 6),
('LEFTPADDING', (0,0), (-1,-1), 8),
('RIGHTPADDING', (0,0), (-1,-1), 6),
]))
story.append(summary_table)
story.append(sp(0.3))
# ══════════════════════════════════════════════
# MEMORY AID
# ══════════════════════════════════════════════
story.append(section_bar("MEMORY AID"))
story.append(sp(0.2))
mem_data = [[
Paragraph('<b>H</b>', ParagraphStyle('m', parent=styles['Normal'], fontSize=22, fontName='Helvetica-Bold', textColor=colors.HexColor('#1a3c6e'), alignment=TA_CENTER)),
Paragraph('<b>C</b>', ParagraphStyle('m', parent=styles['Normal'], fontSize=22, fontName='Helvetica-Bold', textColor=colors.HexColor('#2e6da4'), alignment=TA_CENTER)),
Paragraph('<b>P</b>', ParagraphStyle('m', parent=styles['Normal'], fontSize=22, fontName='Helvetica-Bold', textColor=colors.HexColor('#3a7fc1'), alignment=TA_CENTER)),
Paragraph('<b>E</b>', ParagraphStyle('m', parent=styles['Normal'], fontSize=22, fontName='Helvetica-Bold', textColor=colors.HexColor('#2980b9'), alignment=TA_CENTER)),
Paragraph('<b>S</b>', ParagraphStyle('m', parent=styles['Normal'], fontSize=22, fontName='Helvetica-Bold', textColor=colors.HexColor('#1f618d'), alignment=TA_CENTER)),
Paragraph('<b>N</b>', ParagraphStyle('m', parent=styles['Normal'], fontSize=22, fontName='Helvetica-Bold', textColor=colors.HexColor('#154360'), alignment=TA_CENTER)),
Paragraph('<b>S</b>', ParagraphStyle('m', parent=styles['Normal'], fontSize=22, fontName='Helvetica-Bold', textColor=colors.HexColor('#1b4f72'), alignment=TA_CENTER)),
],[
Paragraph('History', ParagraphStyle('ms', parent=styles['Normal'], fontSize=8.5, fontName='Helvetica', alignment=TA_CENTER, textColor=colors.HexColor('#333333'))),
Paragraph('Community\nDiagnosis', ParagraphStyle('ms', parent=styles['Normal'], fontSize=8.5, fontName='Helvetica', alignment=TA_CENTER, textColor=colors.HexColor('#333333'))),
Paragraph('Planning &\nEvaluation', ParagraphStyle('ms', parent=styles['Normal'], fontSize=8.5, fontName='Helvetica', alignment=TA_CENTER, textColor=colors.HexColor('#333333'))),
Paragraph('Evaluation\nof Risk', ParagraphStyle('ms', parent=styles['Normal'], fontSize=8.5, fontName='Helvetica', alignment=TA_CENTER, textColor=colors.HexColor('#333333'))),
Paragraph('Syndrome\nID', ParagraphStyle('ms', parent=styles['Normal'], fontSize=8.5, fontName='Helvetica', alignment=TA_CENTER, textColor=colors.HexColor('#333333'))),
Paragraph('Natural\nHistory', ParagraphStyle('ms', parent=styles['Normal'], fontSize=8.5, fontName='Helvetica', alignment=TA_CENTER, textColor=colors.HexColor('#333333'))),
Paragraph('Search for\nCauses', ParagraphStyle('ms', parent=styles['Normal'], fontSize=8.5, fontName='Helvetica', alignment=TA_CENTER, textColor=colors.HexColor('#333333'))),
]]
col_w = W / 7
mem_table = Table(mem_data, colWidths=[col_w]*7)
mem_table.setStyle(TableStyle([
('BACKGROUND', (0,0), (-1,0), colors.HexColor('#eef3fb')),
('BACKGROUND', (0,1), (-1,1), colors.HexColor('#f8faff')),
('ALIGN', (0,0), (-1,-1), 'CENTER'),
('VALIGN', (0,0), (-1,-1), 'MIDDLE'),
('TOPPADDING', (0,0), (-1,-1), 8),
('BOTTOMPADDING', (0,0), (-1,-1), 8),
('BOX', (0,0), (-1,-1), 1, colors.HexColor('#c0cce0')),
('INNERGRID', (0,0), (-1,-1), 0.3, colors.HexColor('#d0daea')),
]))
story.append(mem_table)
story.append(sp(0.3))
# ══════════════════════════════════════════════
# EXAM TIPS BOX
# ══════════════════════════════════════════════
tips_data = [[Paragraph(
'<b>EXAM TIPS</b><br/><br/>'
'• Morris described 7 uses — always mention his name<br/>'
'• IEA gave 3 aims — differentiate aims from uses<br/>'
'• For Use 2: know the term "diagnostic tool of community medicine"<br/>'
'• For Use 6: the IHD sudden death example is highly examinable<br/>'
'• For Use 7: give 4 specific discoveries (rubella, thalidomide, smoking, oxygen-retrolental fibroplasia)<br/>'
'• The ultimate aim is to "promote health and well-being of society as a whole"',
ParagraphStyle('tip', parent=styles['Normal'], fontSize=10, leading=16,
fontName='Helvetica', textColor=colors.HexColor('#1a3c6e'),
leftIndent=6, rightIndent=6))]]
tips_table = Table(tips_data, colWidths=[W])
tips_table.setStyle(TableStyle([
('BACKGROUND', (0,0), (-1,-1), colors.HexColor('#fffbe6')),
('BOX', (0,0), (-1,-1), 1.5, colors.HexColor('#e6b800')),
('TOPPADDING', (0,0), (-1,-1), 12),
('BOTTOMPADDING', (0,0), (-1,-1), 12),
('LEFTPADDING', (0,0), (-1,-1), 14),
('RIGHTPADDING', (0,0), (-1,-1), 14),
]))
story.append(tips_table)
story.append(sp(0.4))
# Footer
story.append(hr())
story.append(Paragraph(
"Source: Park's Textbook of Preventive and Social Medicine | Prepared by Orris Medical Education",
note_style))
doc.build(story)
print(f"PDF created: {OUTPUT}")
python /home/daytona/workspace/epidemiology-pdf/uses_of_epidemiology.py
Uses of Epidemiology Exam Prep
PDF Document · PDF
- Definition of epidemiology in a highlighted box
- 3 Aims of IEA clearly listed
- All 7 Uses of Epidemiology (Morris) - each in its own color-coded block with:
- Explanation
- Bullet points
- Exam-relevant examples
- Quick Revision Table - all 7 uses at a glance
- Memory Aid - the H-C-P-E-S-N-S visual block
- Exam Tips box - key points that frequently appear in university exams (e.g., IHD sudden death example, rubella/thalidomide, Morris vs. IEA distinction)
Discuss the epidemiology and prevention of the coronary heart disease. Discuss the contributions of the national program for its prevention.
Epidemiology and Prevention of Coronary Heart Disease (CHD)
Definition
"Impairment of heart function due to inadequate blood flow to the heart compared to its needs, caused by obstructive changes in the coronary circulation to the heart."
EPIDEMIOLOGY OF CHD
Clinical Presentations
- Angina pectoris of effort
- Myocardial infarction (specific to CHD)
- Irregularities of the heart (arrhythmias)
- Cardiac failure
- Sudden death
Measuring the Burden of CHD
| Measure | Key Data |
|---|---|
| Proportional mortality ratio | ~30% of deaths in men, ~25% in women in western countries |
| Loss of life expectancy | CHD cuts life expectancy by 3.4 to 9.4 years in men |
| CHD incidence rate | Sum of fatal and non-fatal attack rates; mortality used as crude indicator |
| Prevalence rate | Estimated by ECG (evidence of infarction) + history of prolonged chest pain |
Global and Indian Burden
- CHD is the cause of 25-30% of deaths in most industrialized countries
- In India:
- Urban prevalence: 6.4% (6.1% males, 6.7% females)
- Rural prevalence: 2.5% (2.1% males, 2.7% females)
- Urban > Rural because lifestyle changes have affected urban populations more
- 25.1% of total deaths in urban areas attributable to circulatory system diseases
- In 2016, an estimated 16,08,700 people died of CHD in India (10,00,800 men; 6,07,800 women)
- Crude death rate: 121.5 per 1,00,000 population
Risk Factors
TABLE: Risk Factors for CHD
| Not Modifiable | Modifiable |
|---|---|
| Age | Cigarette smoking |
| Sex (male > female) | High blood pressure (hypertension) |
| Family history | Elevated serum cholesterol |
| Genetic factors | Diabetes mellitus |
| Personality (Type A) (?) | Obesity, Sedentary habits, Stress |
Detailed Risk Factors
- Risk increases with age
- Males have significantly higher CHD mortality than females (hormonal basis - estrogen is protective in females)
- Post-menopausal women show increased CHD risk
- Strong, consistent, dose-response relationship with CHD
- Risk is 2-3x higher in smokers than non-smokers
- Smoking cessation reduces risk significantly
- LDL cholesterol - atherogenic; high LDL increases CHD risk
- HDL cholesterol - protective; high HDL reduces CHD risk ("reverse cholesterol transport")
- Total cholesterol levels positively correlate with CHD risk
- Apolipoproteins (Apo A-I and Apo-B) are better predictors than HDL/LDL alone
- Even a 2-3 mmHg reduction in mean population BP can produce a large reduction in cardiovascular complications
- Risk of CHD is 2-3 times higher in diabetics than non-diabetics
- CHD is responsible for 30-50% of deaths in diabetics over age 40
- Sedentary lifestyle associated with greater risk of early CHD
- Regular physical exercise increases HDL, decreases weight and blood pressure
- Independently associated with CHD; also aggravates hypertension, diabetes, and dyslipidaemia
- Characterized by: competitive drive, restlessness, hostility, sense of urgency/impatience
- Type A individuals are more coronary-prone than Type B (calm, philosophical)
- Family history of CHD increases risk of premature CHD
- Genetic factors are the most important determinants of an individual's total cholesterol (TC) and LDL levels
- Alcohol: High intake (>75g/day) is an independent risk factor for CHD and hypertension
- Oral contraceptives: Increase risk of MI, especially in women who also smoke
- Miscellaneous: Dietary fibre, sucrose, soft water have been debated
PREVENTION OF CHD
A. Population Strategy (Mass Approach)
Specific Interventions:
- Reduce total fat intake to 20-30% of total energy
- Saturated fats: <10% of total energy; replaced partly by mono/polyunsaturated fats
- Dietary cholesterol: <100 mg per 1000 kcal/day
- Increase complex carbohydrates (vegetables, fruits, whole grains, legumes)
- Avoid alcohol; reduce salt intake to ≤5g/day
- Goal: achieve a smoke-free society
- Strategy includes: health education, legislative restrictions, fiscal measures (taxation), smoking cessation programmes
- A reduction of even 2-3 mmHg in mean population BP produces large cardiovascular benefits
- Approach: prudent diet (reduced salt, no excess alcohol), regular physical activity, weight control
- Regular physical activity should be part of normal daily life
- Children should be encouraged to take up activities they can continue throughout life
Primordial Prevention
- A novel approach: preventing the emergence of CHD risk factors and unhealthy lifestyles before they appear or become endemic
- Particularly applies to developing countries (including India)
- These countries should preserve their traditional eating patterns and lifestyles associated with low CHD risk
B. High-Risk Strategy
- Simple tests: blood pressure measurement, serum cholesterol measurement
- High-risk individuals: smokers, family history of CHD, diabetes, obesity, young women on oral contraceptives
- Treat elevated blood pressure
- Help patients permanently quit smoking (nicotine chewing gum can be used)
- Reduce serum cholesterol in those with raised levels
- Well-planned studies (Oslo Heart Study, Lipid Research Clinics Study) demonstrated feasibility
Limitation of high-risk strategy: More than half of CHD cases occur in people who are not apparently at special risk - this is a key limitation. Intervention may reduce disease in the high-risk group but may not reduce disease in the general population to the same extent.
C. Secondary Prevention
- Aims to prevent recurrence and progression of CHD in those already diagnosed
- All three strategies are complementary - but the population strategy has the greatest potential
- CABG (Coronary Artery Bypass Grafting): mortality 1-3% in healthy patients, rises to 4-8% in older/previously operated patients
- PTCA (Percutaneous Transluminal Coronary Angioplasty): for focal stenosis; restenosis reduced with intracoronary stent (15-20%)
- PTCA superior to medical therapy for symptom relief but NOT in preventing infarction or death
NATIONAL/INTERNATIONAL PREVENTION PROGRAMMES
Key Risk Factor Intervention Trials
- Best known large prospective cohort study
- Established the major risk factors of CHD: elevated serum cholesterol, smoking, hypertension, sedentary habits
- Four main targets for intervention: reduce cholesterol, cease smoking, control BP, promote physical activity
- Intensive mass education campaigns against cardiovascular risk factors conducted in 2 towns; 1 town served as control
- Result: In control community, risk increased over 2 years; in intervention communities, a sustained decrease occurred
- Net difference in estimated total risk between control and intervention: 23-28%
- County with particularly high CHD rates (185,000 inhabitants)
- Two aims: (a) reduce risk factors (smoking, BP, serum cholesterol); (b) promote early diagnosis, treatment, and rehabilitation
- Strategy: mass community action against risk factors
- A control population was established in a neighbouring county
- Results showed significant reduction in CHD mortality and risk factors
- Multifactorial intervention trial targeting smoking, BP, and cholesterol simultaneously
- Demonstrated that primary prevention can achieve substantial reduction in CHD incidence
- High-risk intervention study
- Demonstrated feasibility of reducing CHD risk factors in high-risk individuals
- Showed that reducing serum cholesterol reduces CHD mortality
SUMMARY OF PREVENTION STRATEGIES
| Level | Strategy | Approach |
|---|---|---|
| Primordial | Prevent emergence of risk factors | Preserve healthy lifestyles in developing countries |
| Primary (Population) | Reduce risk factors in whole population | Diet, smoking cessation, BP control, physical activity |
| Primary (High-Risk) | Identify and treat high-risk individuals | BP screening, cholesterol testing, counselling |
| Secondary | Prevent recurrence/progression | CABG, PTCA, drugs, lifestyle modification |