
concepts of heart conduction and depolarisation and repolarisation concepts in ecg graph in physiology in detail way
normal ECG waves P QRS T intervals with cardiac action potential
"electrocardiography"[MeSH Terms] AND "repolarization"
normal electrocardiogram P wave QRS complex T wave PR interval
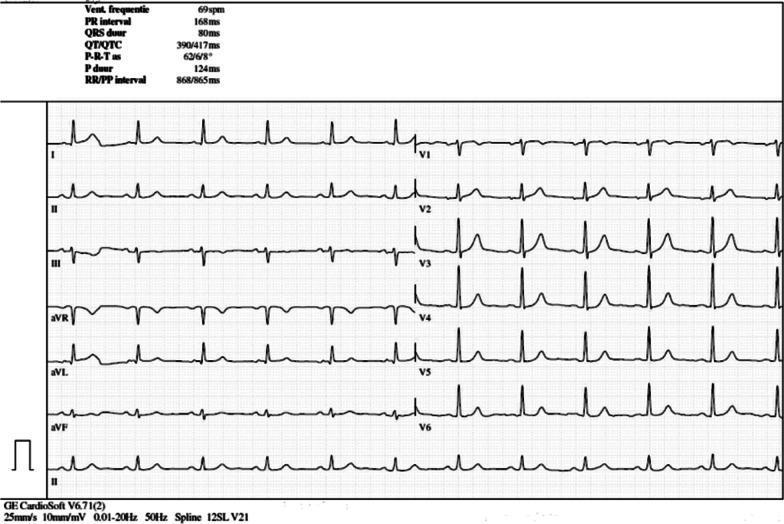
A 12-lead electrocardiogram (ECG) printed on standard grid paper (25 mm/s, 10 mm/mV). The tracing demonstrates a normal sinus rhythm at a ventricular rate of 69 bpm. P waves are present before every QRS complex with a PR interval of 168 ms. The QRS complexes are narrow (80 ms) with a normal axis. In the limb leads (I, II, III, aVR, aVL, aVF), the waveforms show consistent morphology and appropriate polarity. The precordial leads (V1-V6) show expected R-wave progression, with V4-V6 demonstrating prominent R-wave amplitudes. T waves are concordant with the QRS complexes in most leads, though minor T-wave inversion is visible in V1 and V2. Automated measurements provided at the top of the tracing include: Heart rate 69 bpm, PR interval 168 ms, QRS duration 80 ms, QT/QTc 390/417 ms, and P duration 124 ms. This ECG serves as a baseline 'reassuring' study for a patient undergoing immunotherapy, showing no acute ST-segment changes or arrhythmias.
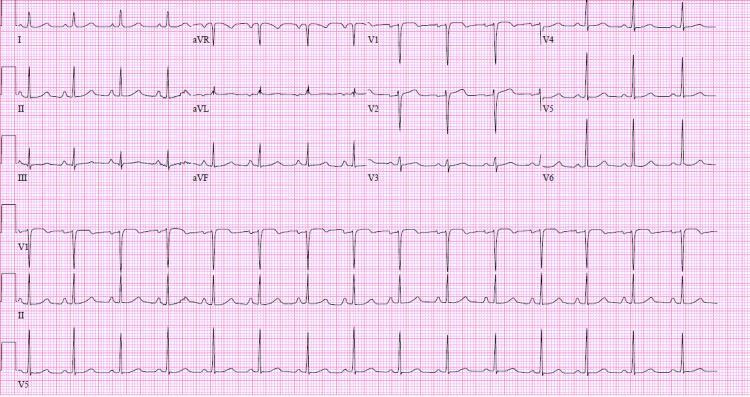
This diagnostic image is a 12-lead electrocardiogram (ECG) displayed in a standard format with three rhythm strips (V1, II, and V5) at the bottom. The tracing demonstrates a normal sinus rhythm following pharmacological cardioversion with flecainide. Key visual features include visible P waves preceding every QRS complex with a consistent PR interval. The QRS complexes are narrow (<120 ms), and the QRS axis is normal, characterized by positive deflections in leads I and aVF. T-wave morphology appears appropriate without acute ST-segment elevations or depressions. In the precordial leads, there is normal R-wave progression from V1 to V6. This tracing is clinically significant in a cardiology context for verifying the restoration of sinus rhythm and monitoring the effects of Class IC antiarrhythmic therapy, such as changes in the QRS duration or PR interval. The ECG reflects stable cardiac electrical activity in a patient previously treated for atrial tachycardia.
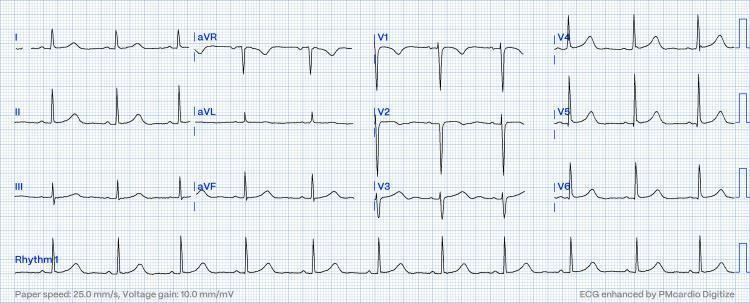
A standard 12-lead electrocardiogram (ECG) displayed on a grid with a paper speed of 25.0 mm/s and a voltage gain of 10.0 mm/mV. The tracing demonstrates a regular sinus rhythm with a physiologic heart rate. Distinct P waves are visible before every QRS complex, indicating a 1:1 atrioventricular conduction with a normal PR interval. The limb leads (I, II, III, aVR, aVL, aVF) show upright P and T waves in leads I and II, with a predominantly positive QRS in lead II consistent with a normal cardiac axis. The precordial leads (V1-V6) exhibit characteristic R-wave progression, transitioning from a small R-wave and deep S-wave in V1-V2 to a tall R-wave and minimal S-wave in V5-V6. No acute ST-segment elevations or T-wave inversions are present, signifying a resolution of previous conduction disturbances such as pseudo-Mobitz type II AV block. This diagnostic image serves as an educational example of a normal resting 12-lead ECG post-clinical intervention.
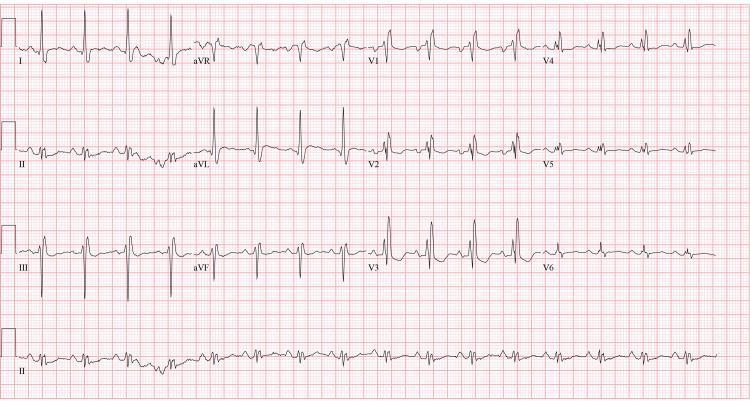
A 12-lead electrocardiogram (ECG) displayed in a standard 4x3 layout with a rhythm strip (Lead II) at the bottom. The tracing exhibits a regular normal sinus rhythm with consistent P-wave morphology preceding each QRS complex. Significant conduction abnormalities are present, most notably a widened QRS duration (>120 ms) with a classic RSR' pattern (rsR') in the right precordial leads V1-V3 and broad, slurred S-waves in the lateral leads (I, aVL, V5-V6), characteristic of a right bundle branch block (RBBB). Additionally, the ECG demonstrates nonspecific ST-segment and T-wave abnormalities, including mild ST-segment depression and T-wave inversions/flattening across various leads. The PR interval appears within normal limits. This diagnostic image serves as an educational example of intraventricular conduction delay and secondary repolarization changes in the context of clinical cardiovascular evaluation.
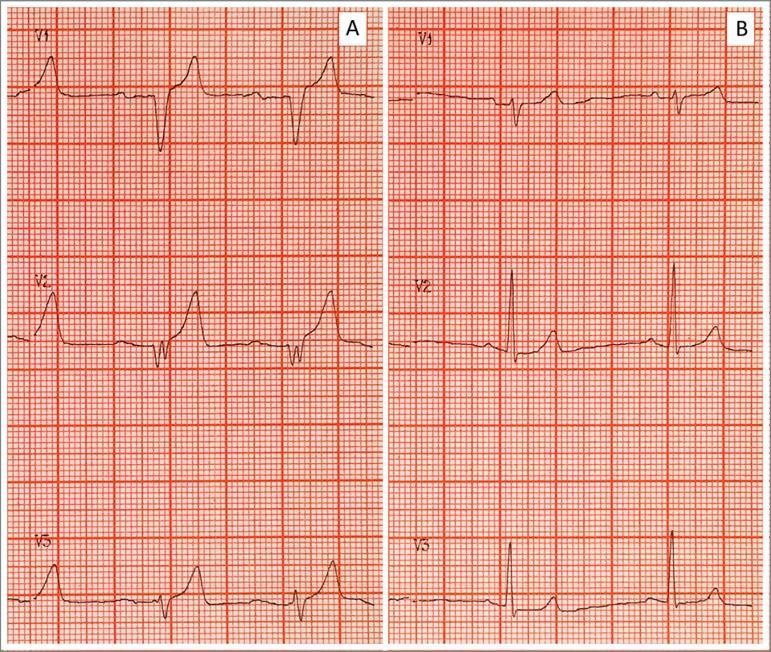
Side-by-side comparison of two electrocardiogram (ECG) tracings (A and B) demonstrating the classic cardiotoxic evolution and subsequent resolution of severe hyperkalemia. Panel A (Pretreatment) displays several pathognomonic findings including prominent, tall, tented, or 'peaked' T-waves; significant flattening and widening of the P-waves; a prolonged PR interval; and a widened QRS complex with a 'sine-wave' appearance in certain leads. These features reflect impaired atrial and ventricular conduction and delayed repolarization associated with elevated serum potassium (e.g., 9.25 mEq/L). Panel B (Post-treatment) shows the results of medical intervention (such as calcium gluconate, insulin/glucose, and bicarbonate), characterized by the normalization of the ECG morphology. Key changes in Panel B include the return of distinct P-waves, narrowing of the QRS complex to normal duration, and a reduction in T-wave amplitude to a typical physiological morphology. The images are shown on standard ECG grid paper, facilitating the assessment of interval and complex durations.
ventricular action potential and ECG relationship, monophasic action potential, QRS, T wave
sequence of ventricular depolarization and relation of action potential to ECG waves
Cardiac Conduction, Depolarisation and Repolarisation in the ECG
1. The cardiac conduction system
Pathway of the impulse
| Structure | Approx. conduction velocity | Role |
|---|---|---|
| SA node | very slow (~0.05 m/s) | Primary pacemaker, intrinsic rate ~60-100/min |
| Atrial muscle | ~0.3-0.5 m/s | Spreads the impulse across both atria |
| AV node | ~0.05 m/s (slowest) | Delays the impulse by about 0.1 s so the atria finish contracting before the ventricles start |
| His-Purkinje | 2-4 m/s (fastest) | Brings the impulse to all ventricular regions almost at once |
| Ventricular muscle | ~0.3-1 m/s | Spreads the impulse from endocardium to epicardium |
- Hierarchy of pacemakers. The SA node has the fastest intrinsic rate, so it suppresses the others (overdrive suppression). The AV node and bundle fire at about 40-60/min. The Purkinje system fires at about 15-40/min. Guyton calls the last of these "ventricular escape" when the node above fails.
- Why the AV delay matters. It lets the ventricles fill before they contract.
- Why the ventricles contract together. Costanzo notes that the QRS lasts about as long as the P wave even though the ventricles are much larger. The His-Purkinje system conducts much faster than atrial tissue (Costanzo Physiology 7th Ed, p. 148).
2. Cellular basis: two kinds of action potential
A. SA node (pacemaker) action potential
- Phase 4 (pacemaker potential). The "funny" current (I_f, an inward Na⁺ current) opens when the cell hyperpolarises. This produces slow diastolic depolarisation. Later, T-type and then L-type Ca²⁺ channels contribute.
- Phase 0 (upstroke). L-type Ca²⁺ channels open, so the upstroke is slow. Fast Na⁺ channels are not involved.
- Phase 3 (repolarisation). K⁺ channels open and K⁺ leaves the cell. The membrane returns to the maximum diastolic potential.
- There is no true plateau (phases 1 and 2 are absent).
- Sympathetic (β1): increases I_f and I_Ca. Phase 4 becomes steeper and the threshold is reached sooner, so heart rate rises.
- Parasympathetic (M2): decreases I_f, increases the K⁺-ACh current, and decreases I_Ca. The cell hyperpolarises, phase 4 is flatter, and heart rate falls.
- Guyton gives the numbers: vagal stimulation hyperpolarises sinus nodal fibres to about −65 to −75 mV instead of −55 to −60 mV. The AV node is also slowed, and strong vagal stimulation can block it completely (Guyton and Hall, Ch. 10).
B. Ventricular (and Purkinje) action potential: fast response
| Phase | Event | Ion movement |
|---|---|---|
| 0 | Rapid upstroke (depolarisation) | Fast Na⁺ influx |
| 1 | Brief early repolarisation | Na⁺ channels inactivate, transient K⁺ efflux |
| 2 | Plateau | Ca²⁺ influx (L-type) balanced by K⁺ efflux |
| 3 | Rapid repolarisation | Ca²⁺ channels close, K⁺ efflux (I_K) |
| 4 | Resting potential (about −85 to −90 mV) | I_K1 holds the membrane near the K⁺ equilibrium potential |
3. How depolarisation and repolarisation generate ECG waves
The dipole concept
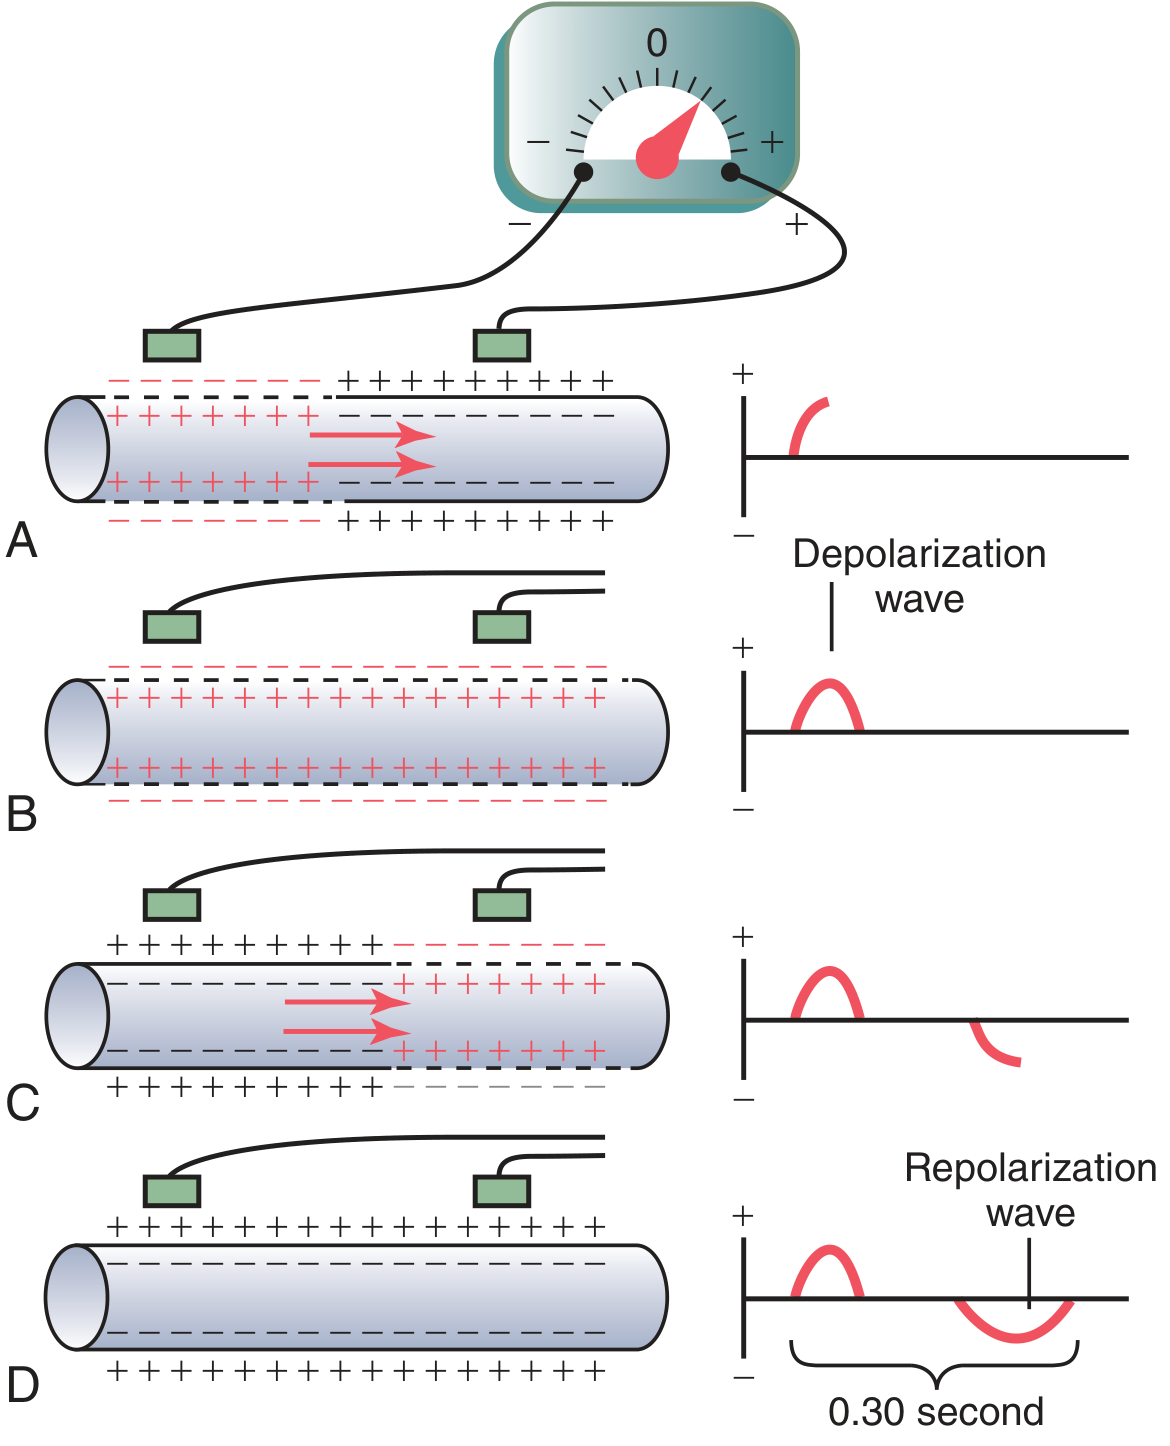
- A: Depolarisation has covered half the fibre. The outside of the depolarised part is negative and the outside of the resting part is positive. The recording is a positive deflection, and it peaks at the halfway point.
- B: The whole fibre is depolarised. Both electrodes sit in equally negative areas, so the trace returns to zero baseline.
- C: Repolarisation has covered half the fibre. The polarity is reversed, so there is a negative deflection.
- D: The fibre is fully repolarised. The trace returns to zero.
- "No potential is recorded in the ECG when the ventricular muscle is either completely polarized or completely depolarized." Only partial depolarisation produces a signal.
- The rule for direction is: a wave of depolarisation travelling toward a positive electrode gives an upward deflection. A wave of repolarisation travelling toward a positive electrode gives a downward deflection.
Relation of the ventricular action potential to QRS and T (Figure 11.3)
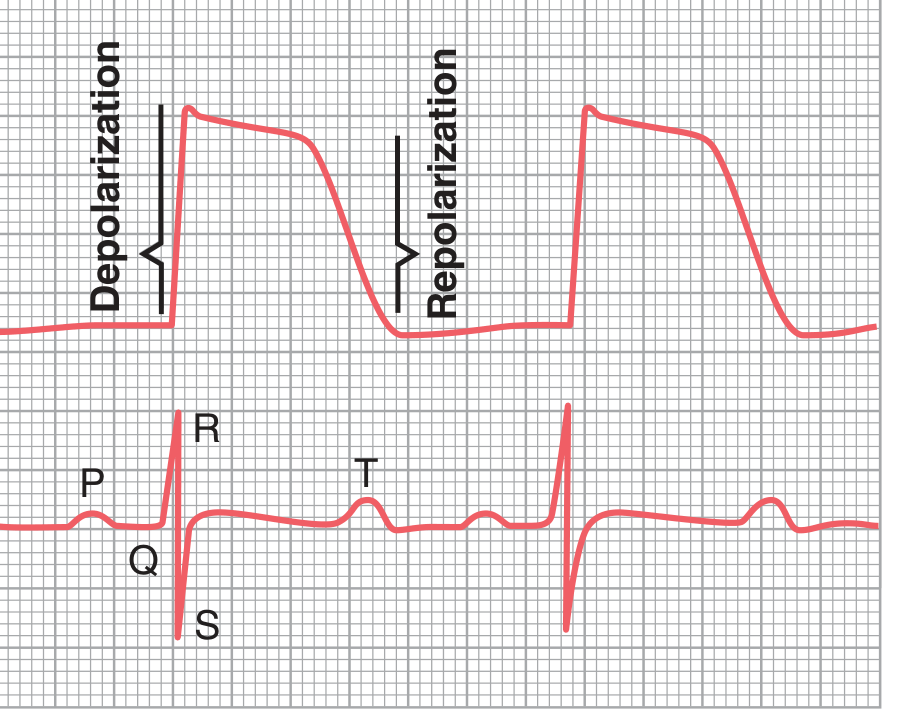
- QRS coincides with the upstroke (phase 0) of the ventricular action potential.
- The ST segment coincides with the plateau (phase 2). All ventricular cells are depolarised, so there is no net current and the segment is isoelectric.
- The T wave coincides with phase 3, the rapid repolarisation.
- The QT interval therefore approximates the total duration of the ventricular action potential.
4. The ECG waves, step by step
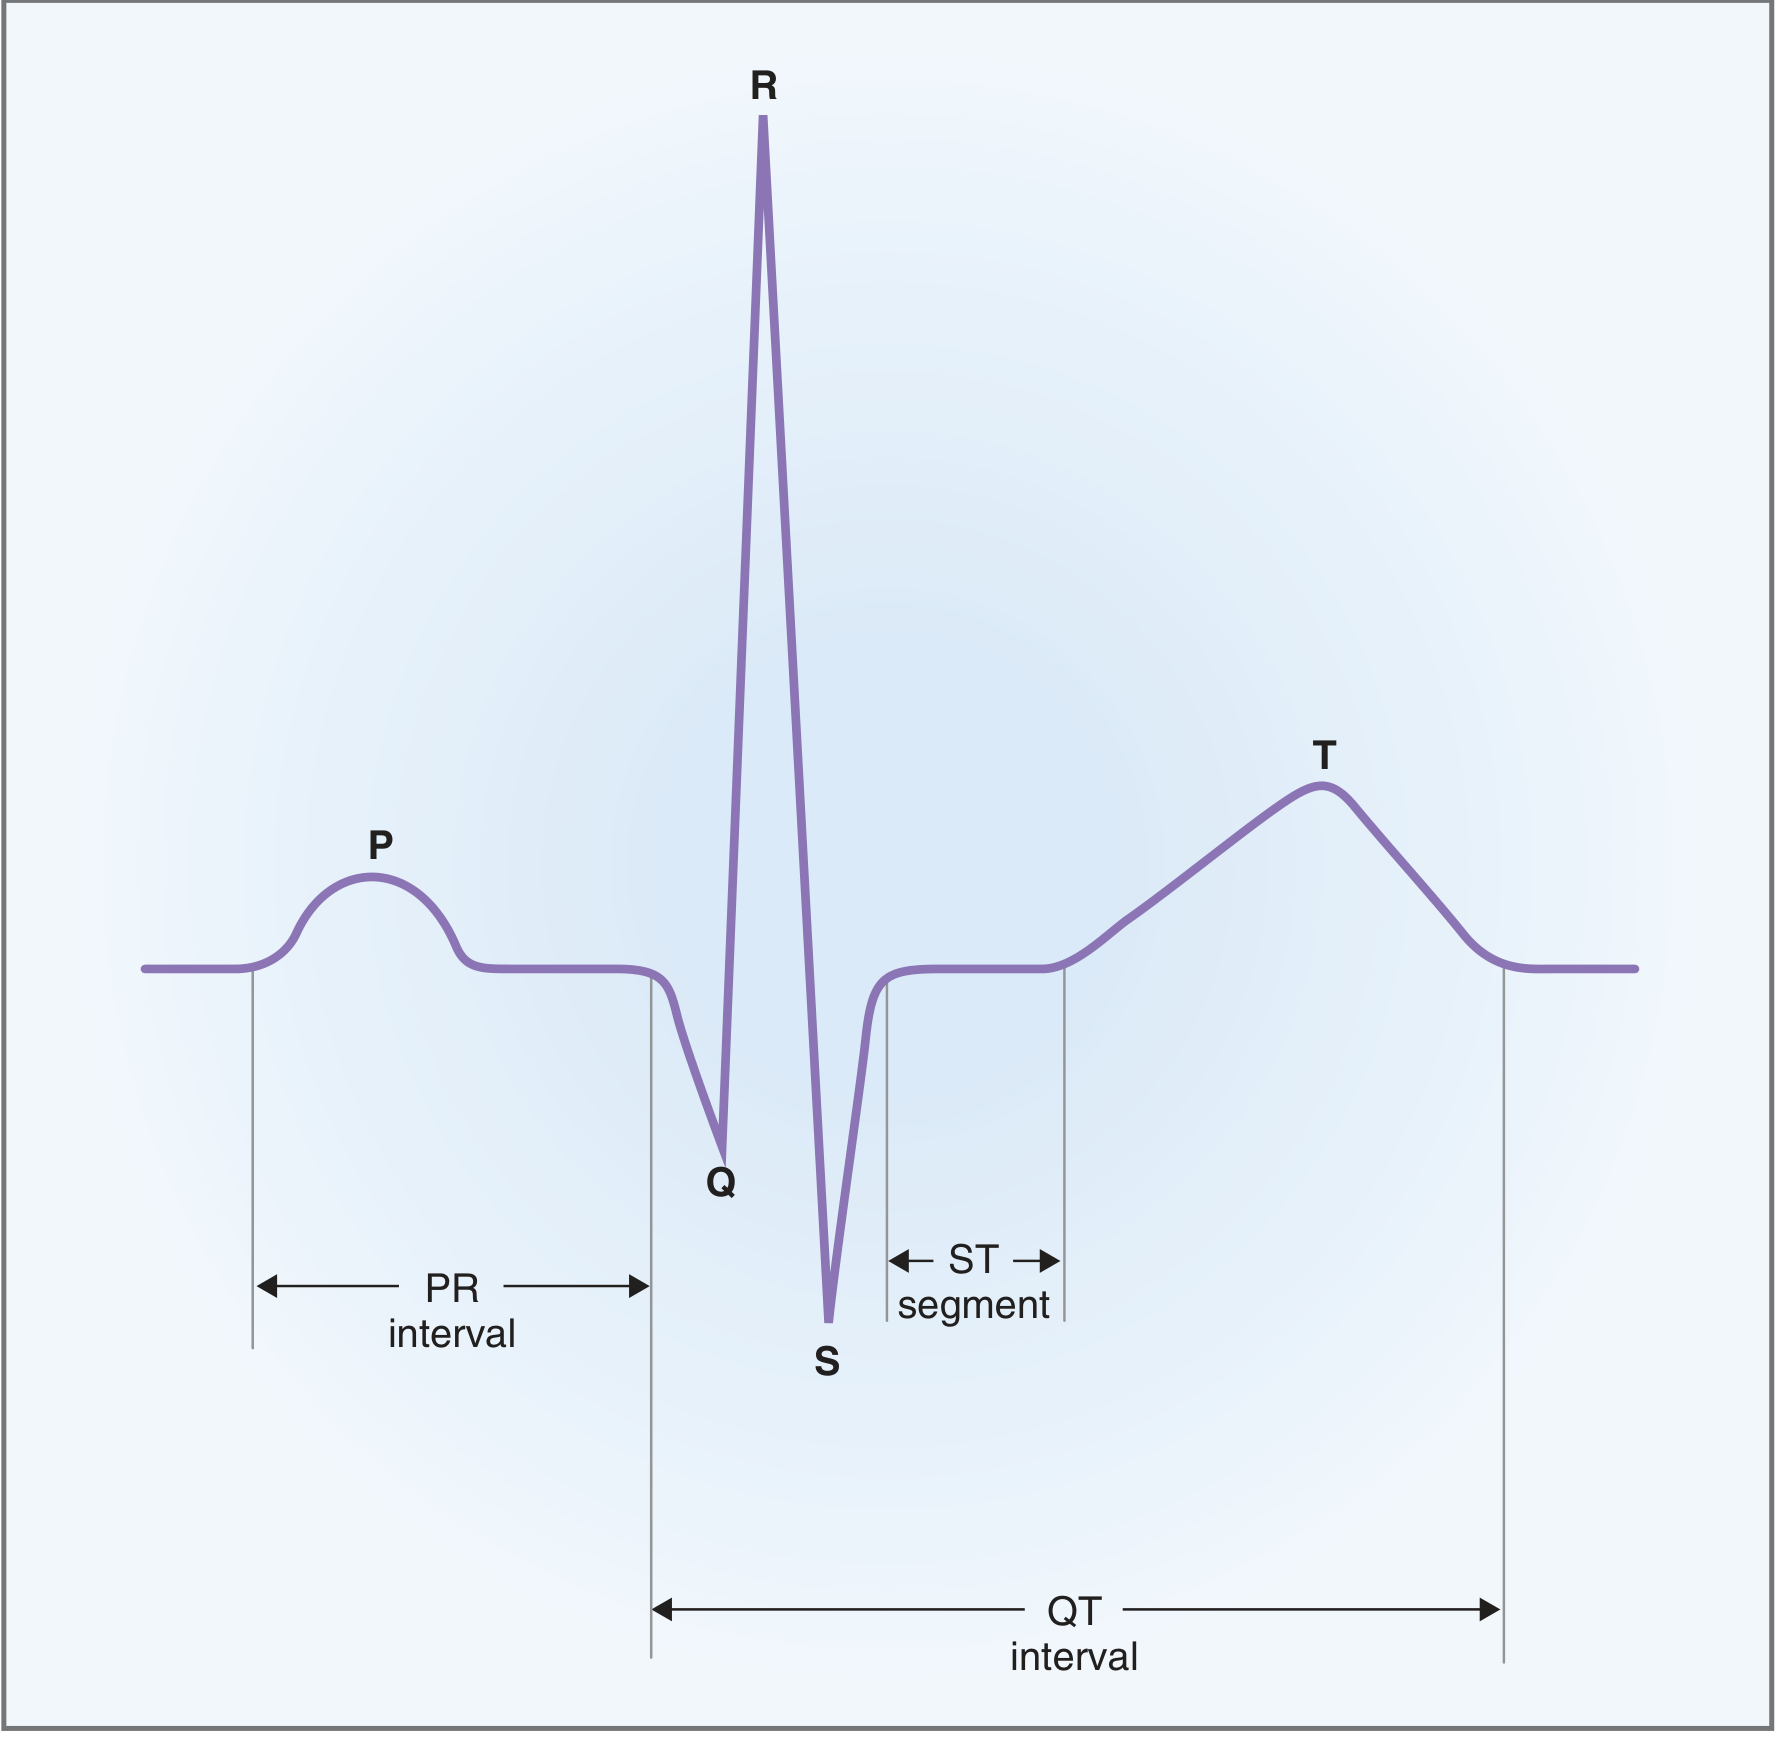
P wave (atrial depolarisation)
- The impulse spreads from the SA node, right atrium to left atrium, toward the AV node.
- This points toward lead II, so the P wave is upright in lead II and inverted in aVR.
- Duration is under 0.12 s. A wide P wave suggests slowed atrial conduction or left atrial enlargement.
- Atrial repolarisation (the atrial T wave, Ta) is opposite in direction and low in amplitude. It is hidden in the QRS complex (Guyton and Costanzo).
PR segment and PR interval
- The PR segment is isoelectric. It reflects conduction through the AV node, bundle of His and bundle branches. These structures are too small to generate a surface signal.
- The PR interval runs from the start of the P wave to the start of the QRS. Normal is 0.12-0.20 s (about 160 ms in Costanzo).
- Sympathetic stimulation speeds AV conduction and shortens the PR interval. Parasympathetic stimulation slows it and lengthens the PR interval.
QRS complex (ventricular depolarisation)
- Q wave. The interventricular septum depolarises from left to right. This gives a small initial negative deflection in the lateral leads.
- R wave. The main free walls of both ventricles and the apex depolarise, from endocardium to epicardium. The left ventricle dominates because it has more muscle, giving a large positive deflection. The mean vector points down and to the left (about +60°).
- S wave. The posterobasal left ventricle and the upper septum depolarise last. The vector points up and back, giving a negative deflection.
ST segment
- This is the period from the end of the S wave to the start of the T wave, with the J point at its start.
- All ventricular cells are in the plateau phase, so the segment is isoelectric. ST elevation or depression indicates an injury current, as in ischaemia.
T wave (ventricular repolarisation)
- Phase 3 repolarisation is a slower, more dispersed process than depolarisation, so the T wave is broader and rounder than the QRS.
- The T wave is upright in leads where the QRS is upright. This looks like a paradox, because a repolarisation wave moving toward an electrode should give a negative deflection. The explanation is that repolarisation runs in the opposite direction to depolarisation, from epicardium to endocardium. Epicardial action potentials are shorter than endocardial ones, so the epicardium recovers first. A repolarisation wave moving away from the electrode (endocardium to epicardium in the net sense) gives a positive deflection. The result is that the T wave has the same polarity as the QRS.
- The T wave is "known as a repolarization wave." Ventricular muscle repolarises 0.25-0.35 s after depolarisation (Guyton).
U wave
- A small wave after the T wave. It is thought to reflect late repolarisation of Purkinje fibres or mid-myocardial cells, or after-potentials. It becomes prominent in hypokalaemia (Harriet Lane Handbook, Basic ECG Principles).
QT interval
- It runs from the start of the QRS to the end of the T wave, so it spans total ventricular depolarisation plus repolarisation (Costanzo).
- It is rate dependent, so it is corrected: QTc = QT / √RR (Bazett). A normal QTc is under about 0.44 s.
- A prolonged QT (long QT syndromes, certain drugs, low K⁺, Mg²⁺ or Ca²⁺) can cause early after-depolarisations and torsades de pointes.
5. Timing summary
| ECG feature | Electrical event | Mechanical event |
|---|---|---|
| P wave | Atrial depolarisation | Atrial contraction begins |
| PR segment | AV node, His-Purkinje conduction | Atrial contraction finishing, ventricles filling |
| QRS | Ventricular depolarisation (phase 0) | Ventricular contraction begins |
| ST segment | Plateau (phase 2) | Ventricles contracted (ejection) |
| T wave | Ventricular repolarisation (phase 3) | Relaxation begins |
| TP segment | Resting (phase 4) | Diastole |
6. Heart rate and refractory period
- Heart rate = 1 / R-R interval. For example, an R-R of 0.8 s gives 75 beats/min (Costanzo).
- A faster heart rate shortens the action potential and therefore the refractory periods. The myocardium becomes excitable earlier and more often, which can contribute to arrhythmias.
7. Common clinical correlations
| Condition | Effect on conduction or repolarisation | ECG finding |
|---|---|---|
| First-degree AV block | Slowed AV nodal conduction | PR > 0.20 s |
| Bundle branch block | Delayed depolarisation of one ventricle | Wide QRS, with secondary ST-T changes |
| Hyperkalaemia | Reduced resting potential, faster repolarisation | Peaked T waves, wide P and QRS, sine-wave pattern in severe cases |
| Hypokalaemia | Delayed repolarisation | ST depression, flat T wave, prominent U wave |
| Hypocalcaemia | Prolonged plateau (phase 2) | Prolonged QT |
| Ischaemia or infarction | Injury currents, altered repolarisation | ST elevation or depression, T inversion, Q waves |
| Vagal stimulation | Slower SA and AV node | Bradycardia, long PR |
8. Recent literature check
Quick recap
- The SA node fires and the impulse spreads through both atria. This gives the P wave.
- The AV node delays the impulse by about 0.1 s. This is the PR segment.
- The His-Purkinje system activates both ventricles almost at once. This gives the QRS.
- All ventricular cells sit in the plateau. This is the ST segment.
- The ventricles repolarise from epicardium to endocardium. This gives the T wave.
- The cells return to resting potential. This is the TP segment.
Explain 1 to 5
Sections 1 to 5, explained in detail
1. The conduction system
Why a conduction system exists
- A built-in pacemaker.
- A fixed order of activation: atria first, then ventricles.
- A delay between atrial and ventricular contraction.
- Near-simultaneous activation of the ventricles, so they contract as one unit.
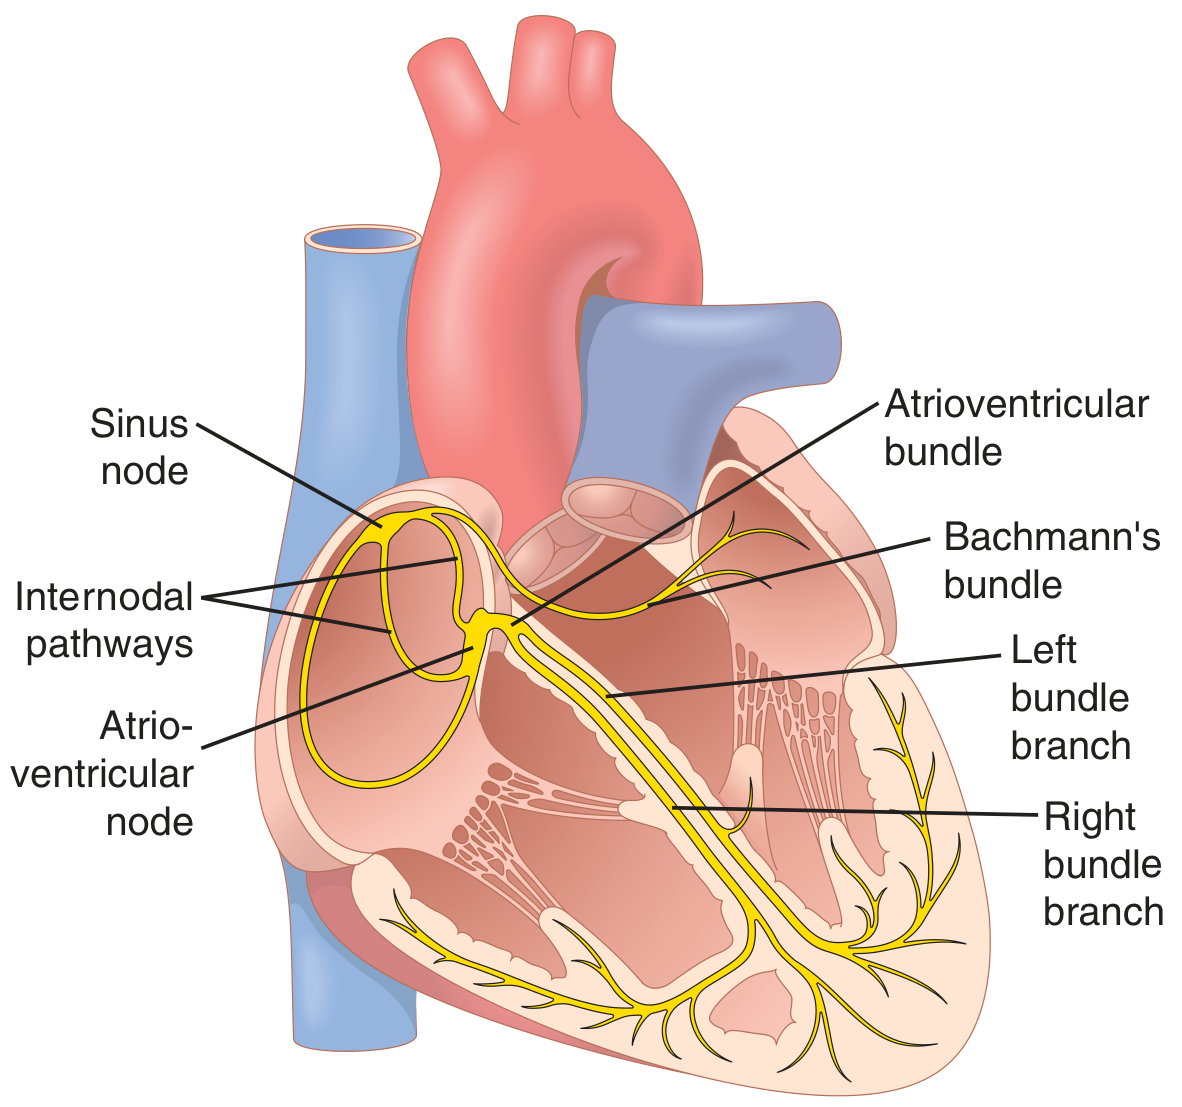
Structure by structure
- It is a flattened strip of specialised muscle about 3 mm wide, 15 mm long and 1 mm thick. It sits in the superior posterolateral right atrium, just below the opening of the superior vena cava.
- Its fibres are only 3-5 μm across, compared with 10-15 μm for atrial fibres. They have almost no contractile filaments.
- They connect directly to atrial fibres, so any action potential that starts here spreads straight into the atrial wall (Guyton and Hall, Ch. 10).
- It paces the heart because it has the fastest intrinsic rate (about 60-100/min).
- The anterior, middle (Wenckebach) and posterior (Thorel) pathways carry the impulse quickly through the right atrium to the AV node (Barash, Clinical Anesthesia).
- Bachmann's bundle is a branch of the anterior pathway. It carries the impulse across to the left atrium.
- Ganong notes that depolarisation spreads radially through the atria and converges on the AV node. Atrial depolarisation is complete in about 0.1 s.
- It sits in the floor of the right atrium near the septum, close to the opening of the coronary sinus.
- It conducts very slowly. This is the AV nodal delay of about 0.1 s (Ganong).
- The delay lets the atria finish emptying into the ventricles before ventricular contraction begins.
- It also protects the ventricles from very fast atrial rhythms, because it cannot conduct every impulse in atrial fibrillation or flutter.
- The bundle of His passes through the fibrous skeleton from the atria into the ventricles. This is the only normal electrical link between the two, since the fibrous skeleton insulates the rest.
- The bundle divides into the right and left bundle branches. The left branch splits into anterior and posterior fascicles.
- The branches run subendocardially down either side of the septum and meet the Purkinje system. Its fibres spread to all parts of the ventricular myocardium (Ganong).
- From the top of the septum, the impulse reaches all parts of the ventricles in about 0.08-0.1 s.
Conduction speeds (Ganong, Table 29-1)
| Tissue | Conduction rate (m/s) |
|---|---|
| SA node | 0.05 |
| Atrial pathways | 1 |
| AV node | 0.05 |
| Bundle of His | 1 |
| Purkinje system | 4 |
| Ventricular muscle | 1 |
Pacemaker hierarchy
- SA node: about 60-100/min.
- AV node and bundle: about 40-60/min.
- Purkinje fibres: about 15-40/min.
- The fastest pacemaker suppresses the rest. If the SA node fails, the next one takes over as an escape rhythm. Guyton describes this as "ventricular escape" when the vagus has blocked the AV node.
Autonomic control
- Vagal stimulation releases acetylcholine. It increases K⁺ permeability and hyperpolarises the cell. In the SA node the potential falls to about −65 to −75 mV instead of −55 to −60 mV, so the rate slows. In the AV node it slows conduction, and strong stimulation blocks it.
- Sympathetic stimulation releases norepinephrine, which acts on β1 receptors. It raises SA node rate, speeds AV conduction and strengthens contraction. Maximal stimulation can nearly triple the heart rate (Guyton).
2. Cellular basis: the action potentials
Why two types matter
- Pacemaker cells (SA node, AV node) depolarise using Ca²⁺. They have no stable resting potential.
- Working muscle and Purkinje cells depolarise using Na⁺. They have a stable resting potential and a long plateau.
SA node action potential
- Phase 4, diastolic depolarisation. The inward "funny" current (I_f) slowly pushes the potential upward. Ca²⁺ channels contribute later in this phase.
- Phase 0. The potential reaches threshold. L-type Ca²⁺ channels open and the upstroke is slow. Fast Na⁺ channels play no part in the upstroke, because they are inactivated at this less negative potential.
- Phase 3. K⁺ channels open, K⁺ leaves, and the cell repolarises to its most negative potential. Then phase 4 begins again.
- The slope of phase 4.
- The maximum diastolic potential.
- The threshold potential.
Ventricular action potential
| Phase | What happens | Ions |
|---|---|---|
| 0 | Rapid upstroke | Fast Na⁺ channels open, Na⁺ enters |
| 1 | Small early dip | Na⁺ channels close, transient K⁺ efflux |
| 2 | Plateau | Ca²⁺ enters through L-type channels, balanced by K⁺ leaving |
| 3 | Rapid repolarisation | Ca²⁺ channels close, K⁺ leaves |
| 4 | Resting potential (−85 to −90 mV) | K⁺ conductance dominates |
- It makes the action potential last 0.25-0.35 s, far longer than in skeletal muscle.
- It brings Ca²⁺ into the cell, which triggers contraction.
- It produces a long refractory period, so the heart cannot be tetanised and has time to relax and refill.
3. How depolarisation and repolarisation create ECG waves
The core idea
The single fibre model (Guyton Fig. 11.2)
- Resting fibre. The outside is positive everywhere, so there is no difference and the trace is flat.
- Depolarisation moving toward the right electrode (A). The depolarised area is negative outside and the resting area is positive outside. The right electrode sees positivity ahead of the wave, so the trace goes up. It peaks when half the fibre is depolarised.
- Fully depolarised (B). Both electrodes sit on negative outside surfaces, so the trace returns to zero.
- Repolarisation moving the same way (C). The recovered area is positive outside again, and the arrangement is opposite to A. The trace goes down.
- Fully repolarised (D). The trace returns to zero.
Rules to remember
- A depolarisation wave moving toward a positive electrode gives an upward deflection. Moving away gives a downward one (Ganong).
- A repolarisation wave gives the opposite deflection to a depolarisation wave moving in the same direction.
- No signal appears when the muscle is entirely polarised or entirely depolarised. Guyton: "Only when the muscle is partly polarized and partly depolarized does current flow."
- The size of the deflection depends on how much muscle is being activated and on the angle between the wave direction and the lead axis.
Linking the action potential to the ECG (Guyton Fig. 11.3)
- The QRS appears at the beginning of the monophasic action potential, during the upstroke.
- The ST segment lies over the plateau.
- The T wave appears at the end, during repolarisation.
- Because the plateau has no net difference between cells, the ECG is flat there.
4. The ECG waves in detail
Spread of activation (Ganong)
- Depolarisation of the ventricular muscle starts on the left side of the interventricular septum and moves first to the right across the mid septum.
- It spreads down the septum to the apex.
- It returns along the ventricular walls to the AV groove, going from endocardium to epicardium.
- The last areas depolarised are the posterobasal left ventricle, the pulmonary conus and the uppermost septum.
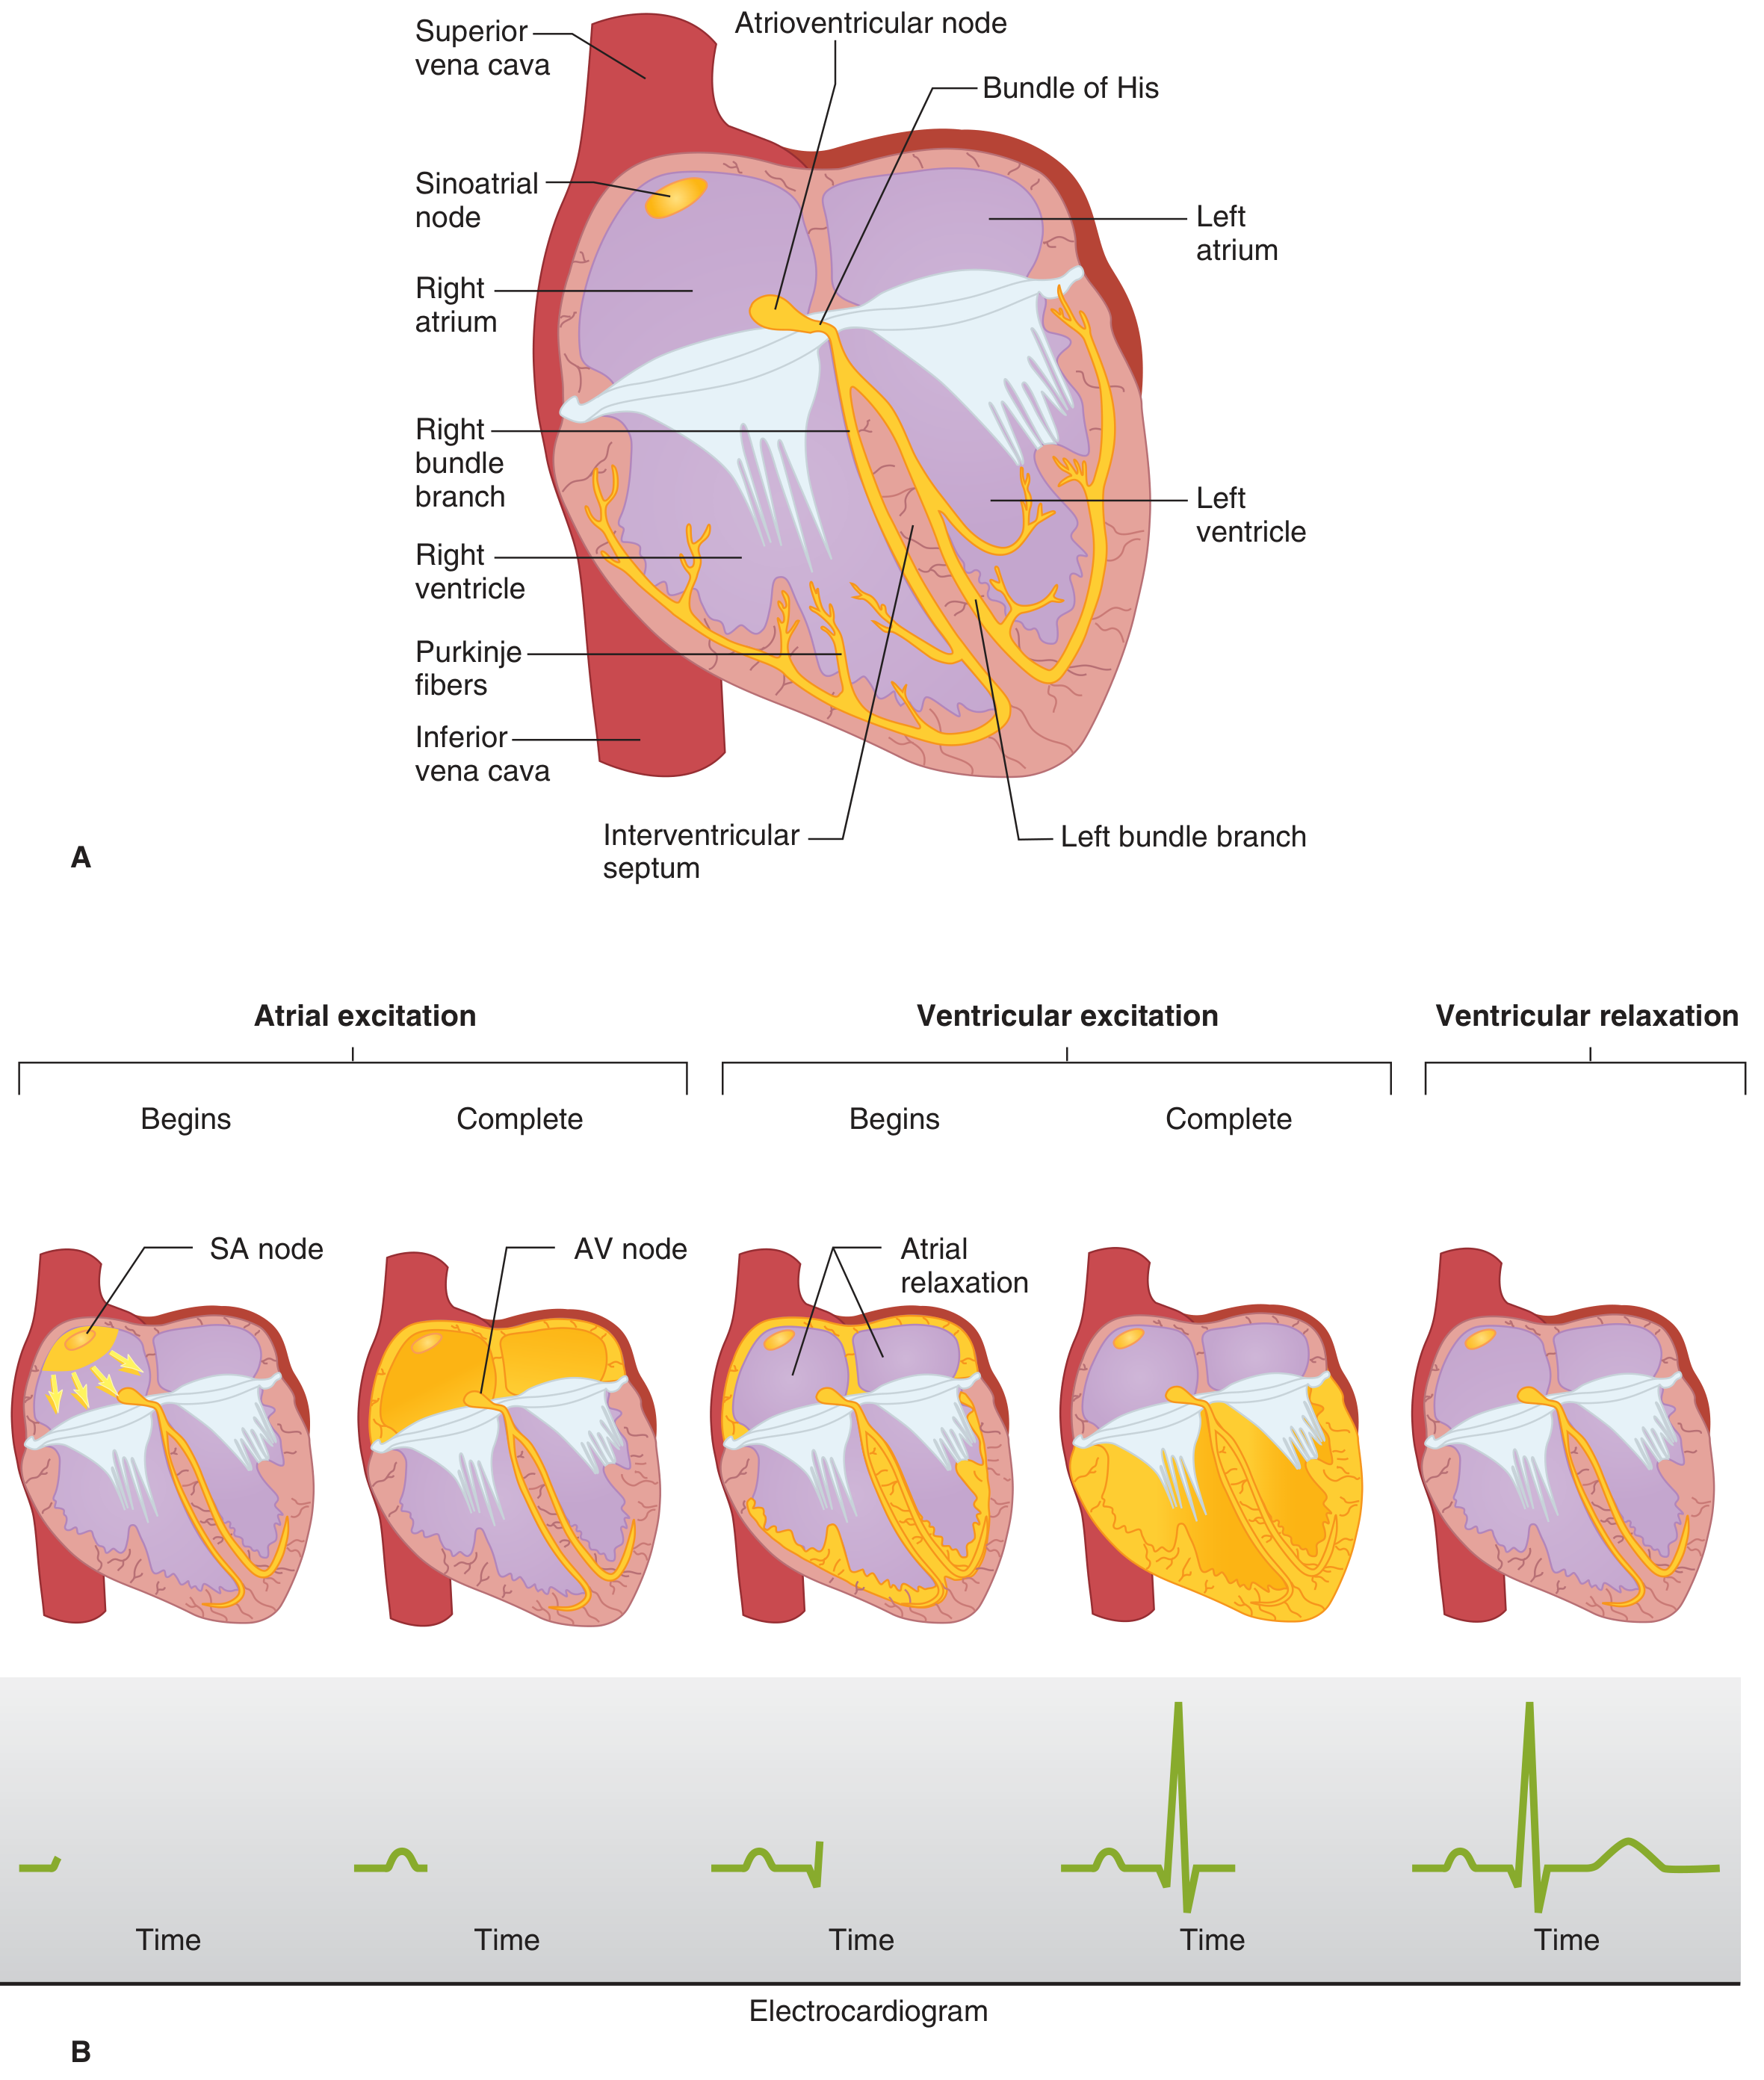
Wave by wave
- It represents atrial depolarisation. The mean vector points down and to the left, toward the AV node and the left leg.
- It is upright in lead II and inverted in aVR.
- The P wave length reflects atrial conduction time. If atrial conduction slows, the P wave widens (Costanzo).
- Atrial repolarisation is not seen on a normal ECG because it is buried in the QRS complex (Costanzo and Guyton).
- The PR segment is flat and corresponds to AV node conduction (and His-Purkinje conduction).
- The PR interval includes the P wave and the PR segment. Costanzo gives it as normally about 160 ms. It shortens with sympathetic stimulation and lengthens with parasympathetic stimulation.
- A longer interval means first-degree AV block.
- It represents ventricular depolarisation. The three waves follow the sequence above:
- Q: the septum depolarises left to right, giving a small initial negative deflection in the left-facing leads.
- R: the main free walls and apex depolarise. The left ventricle has more mass and dominates, so the net vector points down and to the left and the R wave is tall.
- S: the late posterobasal areas depolarise, with a vector pointing up and back.
- The QRS lasts about as long as the P wave although the ventricles are larger. This is because the His-Purkinje system conducts so fast (Costanzo).
- Normal duration is under about 0.10-0.12 s. A QRS of 0.12 s or longer is abnormal (Rosen's Emergency Medicine). A wide QRS means the impulse is travelling cell to cell rather than through Purkinje fibres, as in bundle branch block.
- It lies between the end of the QRS and the start of the T wave. It corresponds to the plateau, phase 2 (Costanzo).
- It is flat because all the ventricular cells are at about the same potential.
- It shifts in ischaemia because injured cells have a different resting potential and plateau, which creates a current even when the rest of the muscle is at plateau.
- It represents ventricular repolarisation. It is slower and broader than the QRS because repolarisation is spread out over time and not as sharply coordinated as depolarisation.
- It normally points in the same direction as the QRS in most leads. The reason is that repolarisation does not follow the same path as depolarisation. It proceeds from the epicardium to the endocardium, because epicardial action potentials are shorter. A repolarisation wave moving in the opposite direction to the depolarisation wave gives a deflection of the same sign.
- Guyton says the T wave arises 0.25-0.35 s after depolarisation in ventricular muscle.
- A small wave after the T wave, thought to reflect late repolarisation. It becomes prominent in hypokalaemia (Harriet Lane Handbook).
- It runs from the start of the QRS to the end of the T wave. Costanzo: first ventricular depolarisation to last ventricular repolarisation. It approximates the length of the ventricular action potential.
- It changes with heart rate, so it is corrected (QTc, e.g. Bazett's formula). Costanzo notes that cycle length is the R-R interval and heart rate = 1 / cycle length.
Intervals versus segments
5. Timing summary: electrical and mechanical events together
| ECG feature | Electrical event | Mechanical event |
|---|---|---|
| P wave | Atrial depolarisation | Atrial contraction begins |
| PR segment | AV node conduction | Atrial systole ends; ventricular filling is completed |
| QRS | Ventricular depolarisation (phase 0) | Ventricular contraction begins |
| ST segment | Plateau (phase 2) | Isovolumetric contraction, then ejection |
| T wave | Ventricular repolarisation (phase 3) | Ventricular relaxation begins |
| TP segment | Resting (phase 4) | Diastole, ventricular filling |
- The SA node fires and the P wave appears.
- The 0.1 s AV delay gives the flat PR segment.
- The QRS shows the ventricles being activated in under 0.1 s, and they contract.
- The ST segment is flat during the plateau.
- The T wave marks repolarisation and the start of relaxation.
- The TP segment is a flat baseline until the next SA node discharge.