
I wanna learn ECG from basic to complex give me everything on it
normal ECG waveform PQRST labeled diagram
ECG leads placement chest electrodes
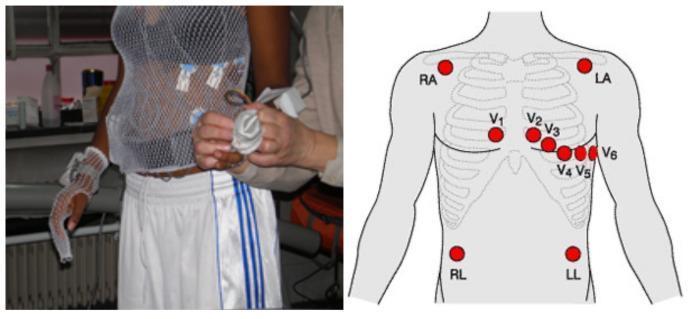
This composite educational material consists of a clinical photograph and a corresponding anatomical diagram illustrating the placement of a standard 12-lead electrocardiogram (ECG) for a cardiac stress test. On the left, a clinical photograph shows a female athlete wearing a white, see-through tubular mesh top designed to secure ECG electrodes and wiring against the skin during physical exertion. The electrodes are visible beneath the mesh, connected to thin leads. On the right, a schematic anatomical diagram of the human torso displays the precise locations for ten electrodes. The limb leads are labeled RA (Right Arm), LA (Left Arm), RL (Right Leg), and LL (Left Leg). The six precordial leads (V1–V6) are shown in their standard positions: V1 and V2 at the fourth intercostal space on either side of the sternum, V4 at the fifth intercostal space in the midclavicular line, and V3, V5, and V6 following the anatomical contour of the chest. This resource demonstrates the clinical preparation required for ergospirometry and cardiovascular monitoring.
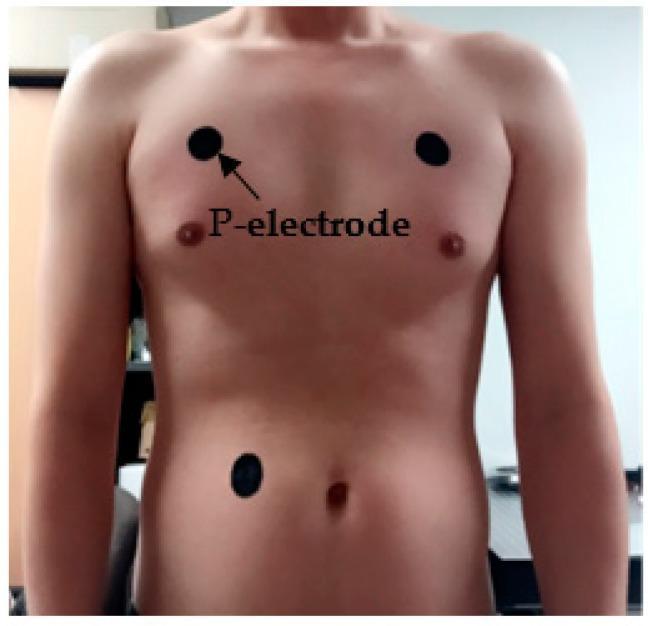
A clinical photograph of a human torso demonstrating the application and placement of carbon-paste patch electrodes (P-electrodes) for electrocardiogram (ECG) monitoring. The image shows three circular, dark-colored (carbon-based) electrodes adhered to the skin. Two electrodes are positioned on the upper chest bilaterally, located superior and slightly lateral to the nipples in the pectoral region to serve as positive and negative leads. A third electrode, acting as a ground, is placed on the left side of the abdomen, lateral to the umbilicus and inferior to the ribcage. The labels identify these as 'P-electrodes,' which are flexible, conformal wearable sensors made from conductive paste. The visual emphasizes the specific anatomical landmarks used for 3-lead ECG measurement setup. This content is relevant for biomedical engineering and cardiology education, focusing on wearable health technology, signal acquisition, and electrode-skin interface stability.
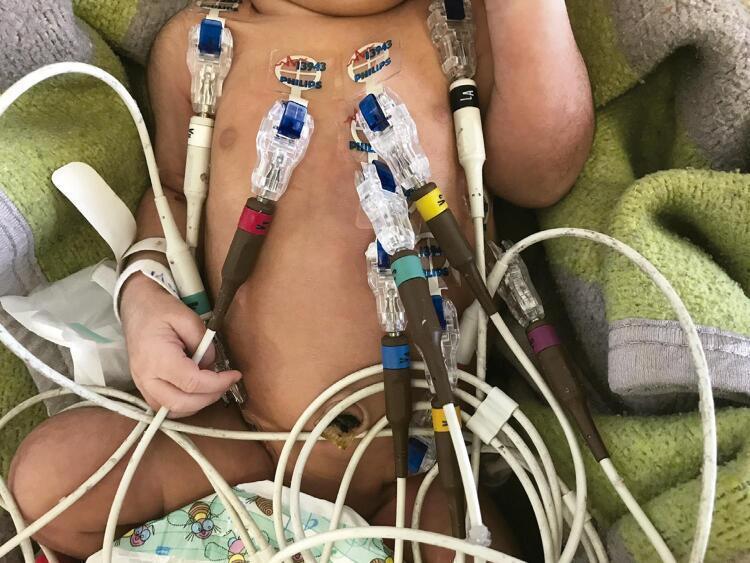
This clinical photograph demonstrates the specific electrode placement for a 12-lead electrocardiogram (ECG) on a neonate. To minimize motion artifact and signal noise common in newborns, the limb leads are repositioned: electrodes are placed on the right and left shoulders instead of the arms, and on the right and left iliac crests instead of the lower limbs. Precordial electrodes V1 through V6 are arranged across the anterior chest wall following standard anatomical landmarks. The image shows clear adhesive solid gel tab electrodes (Philips brand) connected via a system of color-coded brown 'grabber' style connectors (red, yellow, green, blue, and purple) to white insulated lead wires. This procedural setup illustrates specialized pediatric cardiovascular monitoring techniques designed to ensure high-quality diagnostic signals while accommodating neonatal anatomy and movement.
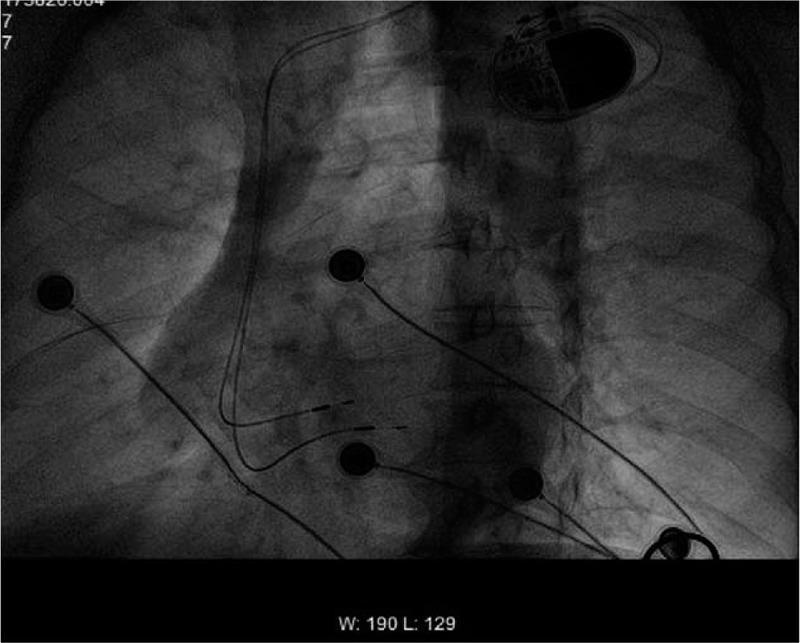
This diagnostic image is a fluoroscopic radiograph (radioscopy) of the chest in a left anterior oblique (LAO) projection, demonstrating the placement of a cardiac rhythm management device. A dual-chamber pacemaker generator is visible in the upper right pectoral region. Two electrode leads extend from the generator into the heart. One lead is positioned specifically at the interventricular septum, likely targeting the His bundle or left bundle branch region for physiological pacing, while the other lead provides backup or additional chamber sensing. Multiple external circular radiopaque ECG monitoring electrodes are also visible across the chest wall. The anatomical landmarks include the cardiac silhouette, the spinal column, and the rib cage. This image serves as an educational example of physiological pacing lead placement, specifically illustrating the orientation of 3830-style pacing leads directed toward the septum to treat conduction system disorders like atrioventricular block.
atrial fibrillation ECG rhythm strip
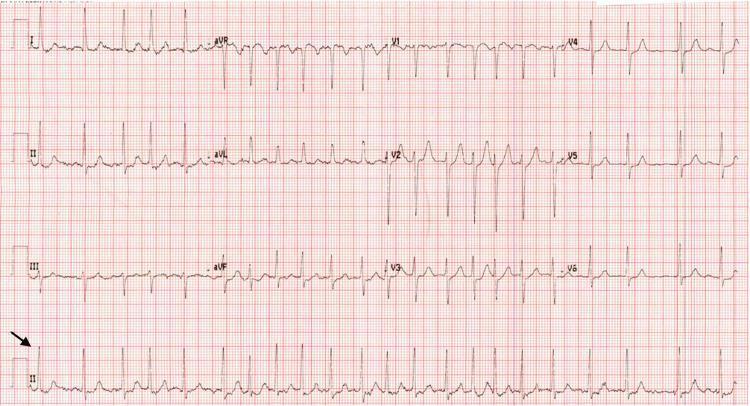
This diagnostic image is a 12-lead electrocardiogram (ECG) printed on standard grid paper, demonstrating new-onset atrial fibrillation. The ECG displays the standard limb leads (I, II, III), augmented limb leads (aVR, aVL, aVF), and precordial leads (V1-V6), with a rhythm strip for lead II at the bottom. The tracing is characterized by an irregularly irregular rhythm and the absence of discernible P waves. In their place, the baseline exhibits fine, irregular fibrillatory (f) waves, most prominently seen in lead V1 and the rhythm strip (indicated by a black arrow). The QRS complexes appear narrow and vary in their R-R intervals, a hallmark of irregular ventricular response in atrial fibrillation. Precordial leads V1 through V6 show a progression of R-wave amplitude. There is no evidence of significant ST-segment elevation or depression, suggesting an absence of acute myocardial infarction. This visual serves as a classic educational example of atrial fibrillation pathophysiology and diagnostic ECG features.
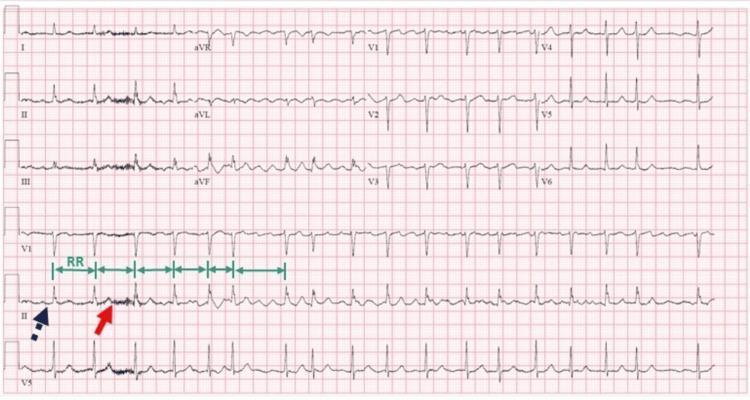
This diagnostic image is a 12-lead electrocardiogram (ECG) printed on standard grid paper, demonstrating classic features of atrial fibrillation. The tracing shows a rhythm characterized by 'irregularly irregular' R-R intervals, which are explicitly marked with green bidirectional arrows in the rhythm strip to highlight the variability in heart rate. A defining feature of this ECG is the complete absence of organized P waves preceding the QRS complexes. Instead, the baseline exhibits fibrillatory waves—small, rapid, and irregular oscillations—most clearly visible in the rhythm strip of Lead II (indicated by a solid red arrow) and Lead V1. The purple dashed arrow highlights the flat or undulating baseline where a P wave would normally be expected in sinus rhythm. The QRS complexes appear narrow, suggesting normal ventricular conduction despite the supraventricular arrhythmia. This visual material is a primary educational resource for cardiology and internal medicine, illustrating the fundamental diagnostic criteria for atrial fibrillation.
myocardial infarction ST elevation ECG
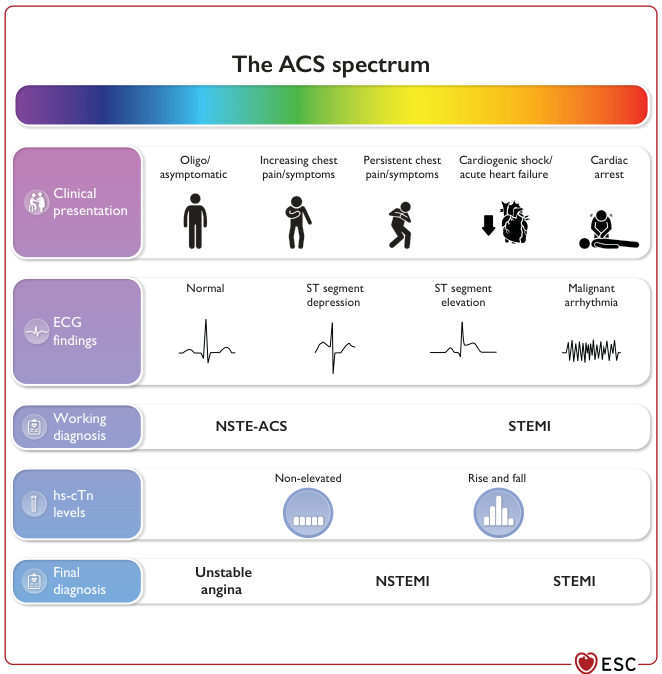
Summary : This figure illustrates the spectrum of Acute Coronary Syndromes (ACS), detailing the progression from mild or asymptomatic presentations to severe outcomes such as cardiac arrest. It organizes ACS into clinical presentation, ECG findings, working diagnosis, high-sensitivity cardiac troponin (hs-cTn) levels, and final diagnosis, showing how these elements interrelate across the ACS continuum.
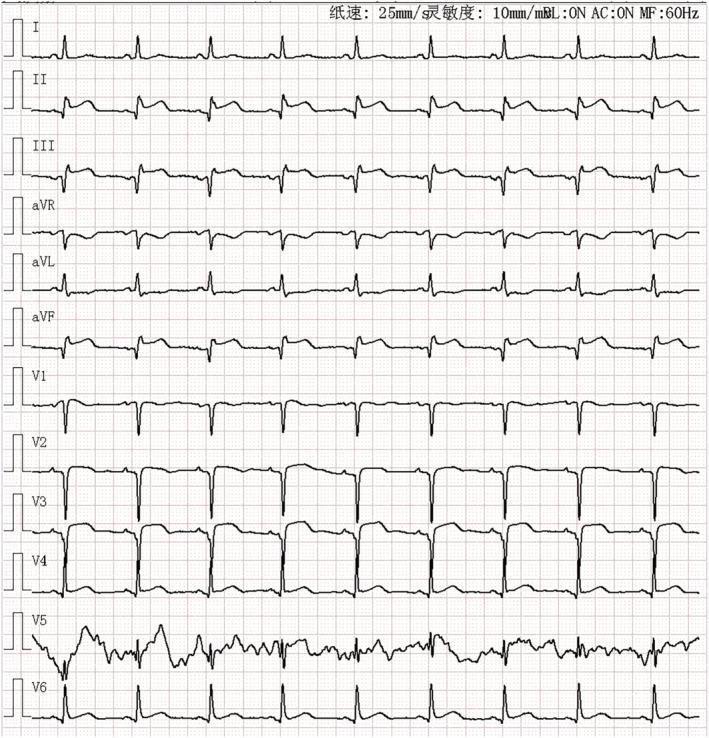
This diagnostic image is a 12-lead electrocardiogram (ECG) printed on standard grid paper (25 mm/s, 10 mm/mV). The tracing demonstrates significant ST-segment elevation in both the anterior leads (V1-V6) and the inferior leads (II, III, and aVF). In the inferior leads (II, III, aVF), pathological Q waves are clearly visible alongside the ST-segment elevation, suggesting a possible evolving or prior inferior myocardial infarction. The anterior leads, particularly V1 through V4, show prominent ST-segment elevation and developing Q waves, consistent with an acute anterior ST-elevation myocardial infarction (STEMI). Reciprocal ST-segment depression is noted in lead aVL. The rhythm appears to be sinus, though baseline artifacts are present in lead V5. This ECG illustrates extensive cardiac ischemia and injury involving multiple myocardial territories, which is clinically significant for the diagnosis of multi-vessel involvement or a proximal coronary artery occlusion.
heart block AV block ECG first second third degree
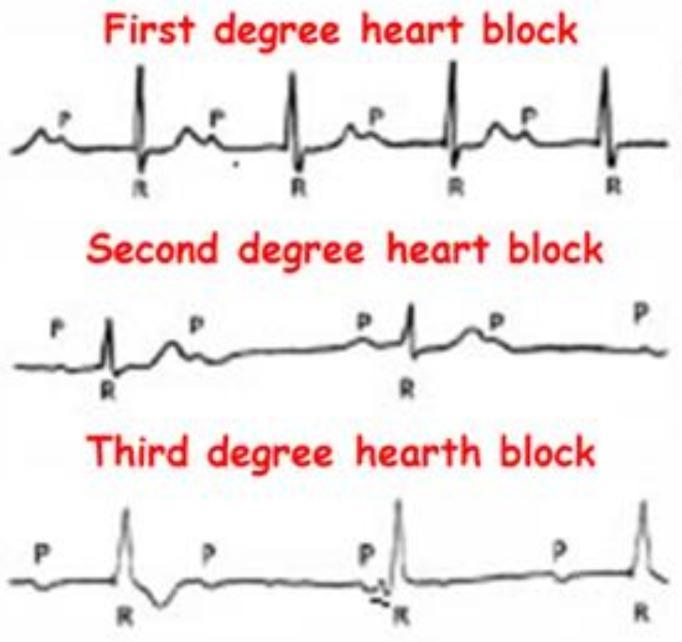
This Comparison Chart illustrates the electrocardiographic (ECG) characteristics of Atrioventricular (AV) blocks. It features three stacked rhythm strips categorized as First, Second, and Third-degree heart blocks, emphasizing the relationship between P waves (atrial depolarization) and QRS complexes (ventricular depolarization). The 'First degree heart block' panel demonstrates a consistent 1:1 P-to-QRS ratio with a fixed, prolonged PR interval. The 'Second degree heart block' panel shows intermittent conduction failure, where specific P waves are not followed by a QRS complex. The 'Third degree heart block' panel depicts complete AV dissociation, where P waves and QRS complexes occur independently and at different rates, indicating a total interruption of impulse transmission and the presence of a ventricular escape rhythm. This diagnostic illustration is designed for cardiovascular education to help students and clinicians distinguish between different stages of cardiac conduction system disease and their associated clinical significance.
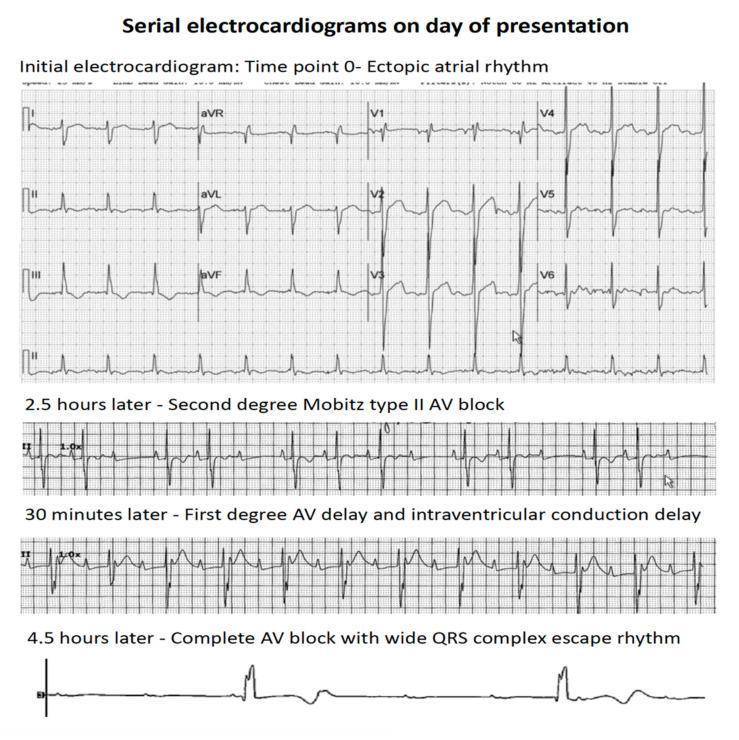
This diagnostic image consists of a series of four electrocardiogram (ECG) rhythm strips demonstrating the rapid clinical progression of atrioventricular (AV) conduction abnormalities over a period of 4.5 hours. The top panel, labeled 'Time point 0', shows an ectopic atrial rhythm with organized P-wave activity and narrow QRS complexes. The second strip, recorded 2.5 hours later, displays a second-degree Mobitz type II AV block, characterized by intermittently dropped QRS complexes without preceding PR interval lengthening. The third strip, 30 minutes later, indicates a first-degree AV delay (prolonged PR interval) and intraventricular conduction delay (widened QRS). The final rhythm strip at 4.5 hours shows third-degree (complete) AV block, characterized by complete AV dissociation and a slow, wide QRS complex ventricular escape rhythm. This progression illustrates acute cardiac conduction system failure, typically associated with myocardial infiltration or severe injury, as seen in patients with leukemic infiltration of the heart.
ventricular fibrillation tachycardia ECG
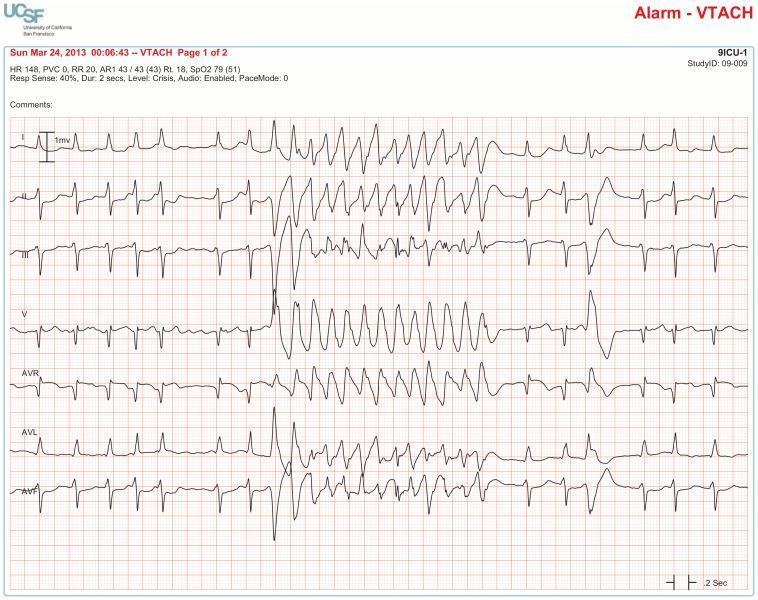
This diagnostic image displays a 10-second multi-lead electrocardiogram (ECG) rhythm strip illustrating a true positive ventricular tachycardia (VT) alarm. Seven leads are shown in sequence: I, II, III, V, aVR, aVL, and aVF. The initial segment of the tracing demonstrates an underlying rhythm of atrial fibrillation characterized by irregularly irregular R-R intervals and a rapid ventricular rate (approximately 140 bpm). An isolated ventricular premature contraction (VPC) is visible midway through the strip. This VPC exhibits a morphology identical to the subsequent run of wide-complex tachycardia, which confirms the diagnosis of ventricular tachycardia. During the VT episode, the QRS complexes become significantly widened and aberrant, occurring at a rapid, regular rate before spontaneously terminating and returning to the underlying atrial fibrillation. This tracing is a critical educational example used to distinguish true ventricular arrhythmias from artifact by correlating ectopic beat morphology with the onset of the tachycardia across multiple simultaneous leads.
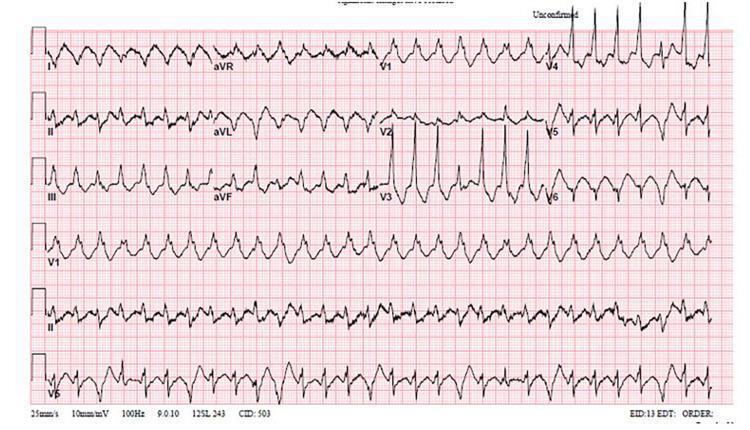
This diagnostic image is a 12-lead electrocardiogram (ECG) demonstrating a chaotic and highly irregular cardiac rhythm. The tracing is characterized by a lack of organized electrical activity, with no identifiable P waves, distinct QRS complexes, or T waves across most leads. The morphology varies significantly between leads, exhibiting both coarse and fine fibrillatory waves with inconsistent amplitudes and frequencies. In certain precordial leads, specifically V3 through V5, there are brief segments of rapid, wide-complex oscillations that suggest a transitional phase or a degenerating monomorphic ventricular tachycardia. However, the dominant finding is the asynchronous and disorganized electrical pattern pathognomonic for ventricular fibrillation. This ECG is a critical clinical finding in cardiovascular medicine, illustrating a life-threatening arrhythmia that requires immediate defibrillation. It serves as an educational tool for advanced cardiac life support (ACLS) training to distinguish organized ventricular tachycardia from the disorganized electrical state of ventricular fibrillation.
left bundle branch block right bundle branch ECG QRS morphology
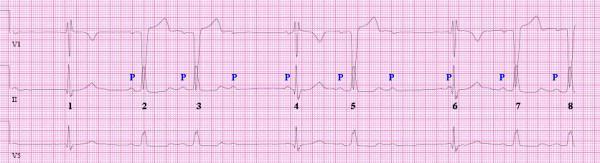
Diagnostic electrocardiogram (ECG) rhythm strip displaying leads V1, II, and V5, demonstrating a complex conduction disturbance involving alternating bundle branch block morphologies and atrioventricular (AV) block. The tracing shows eight numbered QRS complexes. Complexes 2, 3, 5, 7, and 8 exhibit a wide QRS morphology characteristic of Left Bundle Branch Block (LBBB), associated with visible preceding P waves (labeled 'P') and a first-degree AV block. Conversely, complexes 1, 4, and 6 demonstrate a Right Bundle Branch Block (RBBB) morphology. Notably, complex 1 lacks a preceding P wave, and the PR intervals for complexes 4 and 6 are significantly shorter than those of the LBBB complexes, suggesting that the RBBB morphology represents ventricular escape beats in the setting of high-grade or complete AV conduction block. This visual evidence is critical for teaching the identification of advanced infra-nodal conduction system disease and the differentiation between conducted beats and escape rhythms in the presence of bi-fascicular or trifascicular block.
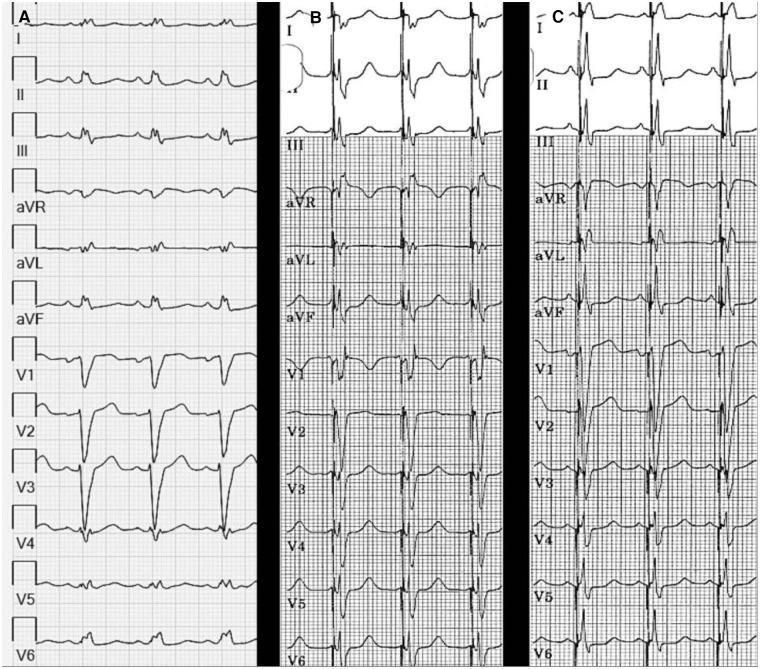
A comparison of three 12-lead electrocardiogram (ECG) strips (labeled A, B, and C) illustrating the effects of Left Bundle Branch Area Pacing (LBBAP) on ventricular activation. Panel A displays baseline sinus rhythm with Left Bundle Branch Block (LBBB), characterized by a wide QRS duration (156 ms), dominant S waves in V1-V3, and broad R waves in I, aVL, and V6. Panel B shows LBBAP with a short Atrioventricular (AV) delay of 40 ms, resulting in a reduced QRS duration of 128 ms and a Right Bundle Branch Block (RBBB) morphology in lead V1 (rSR' pattern), indicating left ventricular capture. Panel C demonstrates the normalization of the QRS complex (120 ms) by increasing the AV delay to 80 ms. This adjustment facilitates physiological fusion between the paced left ventricular activation and intrinsic anterograde conduction through the right bundle. The sequence highlights the transition from wide-complex dyssynchrony to a more narrow, synchronized ventricular activation pattern, with associated improvements in T-wave morphology and ST-segment alignment across the limb and precordial leads.
ECG axis deviation left right hexaxial
Complete ECG Guide: Basic to Complex
PART 1 - THE BASICS: What is an ECG?
PART 2 - THE ELECTRICAL SYSTEM OF THE HEART
The Conduction Pathway (in order):
- SA Node (sinoatrial node) - the natural pacemaker, fires 60-100 bpm, sits in the right atrium
- Atria - depolarize from the SA node impulse → produces the P wave
- AV Node - receives the impulse and deliberately slows it down (allows ventricular filling). This delay = the PR interval
- Bundle of His - carries signal from AV node into the ventricles
- Left + Right Bundle Branches - split the signal to both ventricles
- Purkinje Fibers - distribute the signal rapidly to all ventricular muscle → produces the QRS complex
- Ventricular repolarization → produces the T wave
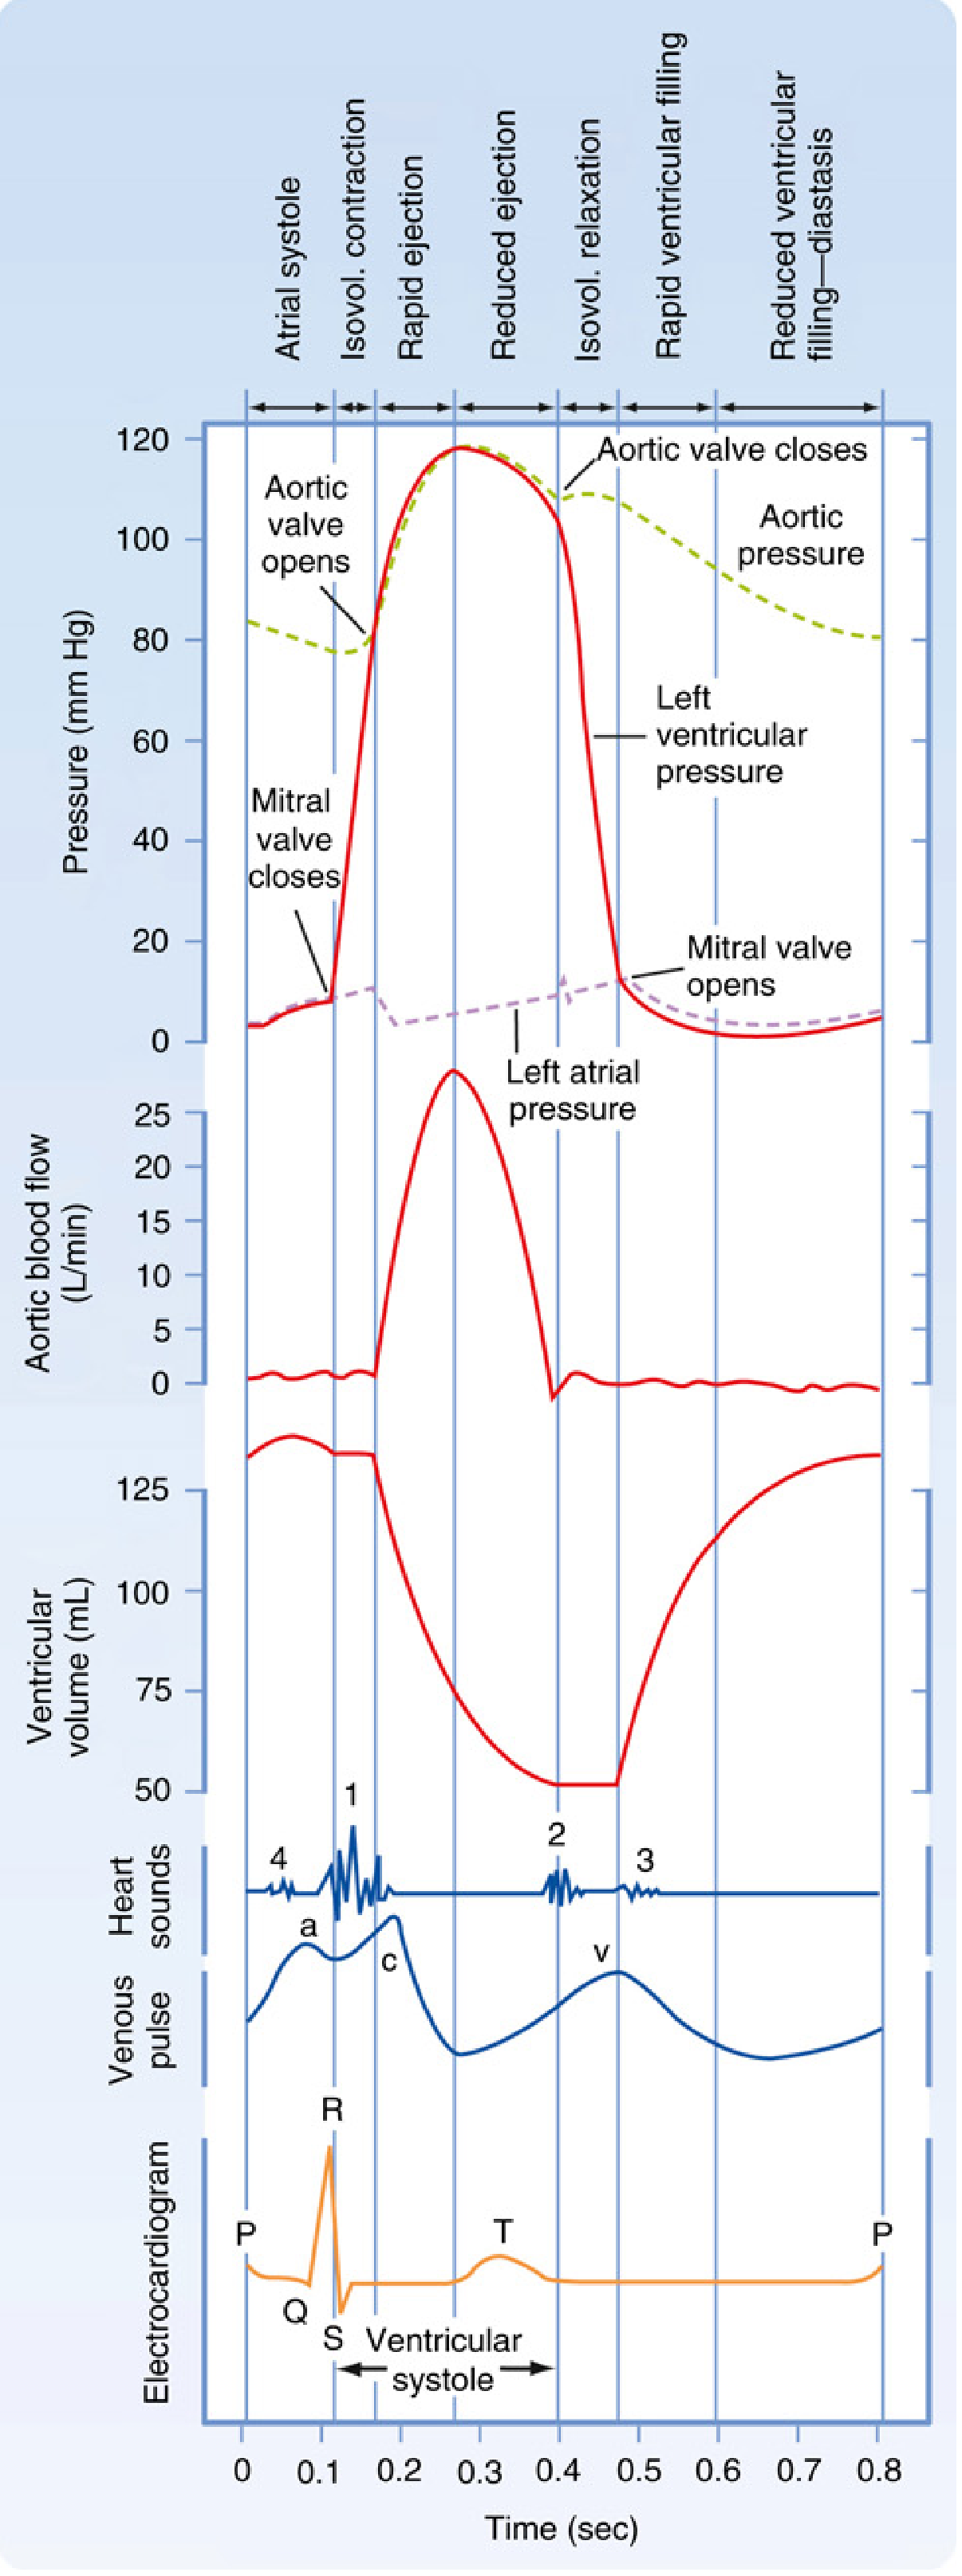
PART 3 - THE WAVES, INTERVALS, AND SEGMENTS
The Named Deflections
| Wave/Complex | What it represents | Key features |
|---|---|---|
| P wave | Atrial depolarization | Small, rounded, upright in II; duration < 0.12 s |
| Q wave | Initial negative deflection of QRS (septal depolarization) | Pathological if > 40 ms wide or > 25% of R height |
| R wave | First positive deflection of QRS | Ventricular depolarization |
| S wave | Negative deflection after R wave | Follows R wave |
| T wave | Ventricular repolarization | Upright in most leads; same direction as QRS |
| U wave | Slow repolarization (Purkinje fibers?) | Small; prominent in hypokalemia |
The Critical Intervals
| Interval | Measurement | Normal Duration |
|---|---|---|
| PR interval | Start of P to start of QRS | 0.12 - 0.20 s (3-5 small boxes) |
| QRS duration | Start to end of QRS | < 0.12 s (< 3 small boxes) |
| QT interval | Start of QRS to end of T wave | Rate-dependent (QTc < 0.44 s men, < 0.46 s women) |
| ST segment | End of QRS to start of T wave | Should be isoelectric (flat baseline) |
| R-R interval | One QRS to next | Inversely proportional to heart rate |
The ECG Grid
- Small box = 1 mm = 0.04 s (horizontal) = 0.1 mV (vertical)
- Large box = 5 mm = 0.20 s
- 5 large boxes = 1 second
PART 4 - THE 12 LEADS: What Each One "Sees"
Limb Leads (Frontal Plane)
| Lead | What it sees | Normal QRS |
|---|---|---|
| I | Left side of heart (lateral) | Upright |
| II | Inferior-left | Upright (used for rhythm strips) |
| III | Inferior | Variable |
| aVR | Right shoulder (cavity) | Negative QRS (looking into the cavity) |
| aVL | Left shoulder (lateral) | Variable |
| aVF | Feet (inferior) | Upright |
Precordial Leads (Horizontal Plane)
| Lead | Position | Region |
|---|---|---|
| V1 | 4th ICS, right sternal border | Septal / right ventricle |
| V2 | 4th ICS, left sternal border | Septal |
| V3 | Between V2 and V4 | Anterior |
| V4 | 5th ICS, midclavicular line | Anterior |
| V5 | Anterior axillary line | Lateral |
| V6 | Midaxillary line | Lateral |
Grouping Leads by Territory (key for MI localization)
| Territory | Leads | Coronary Artery |
|---|---|---|
| Inferior | II, III, aVF | RCA |
| Anterior | V1-V4 | LAD |
| Lateral | I, aVL, V5-V6 | LCx |
| Posterior | V7-V9 (or reciprocal in V1-V3) | RCA/LCx |
PART 5 - HOW TO CALCULATE HEART RATE
300 - 150 - 100 - 75 - 60 - 50 (1 box - 2 boxes - 3 boxes - 4 boxes - 5 boxes - 6 boxes)
- Normal: 60-100 bpm
- Tachycardia: > 100 bpm
- Bradycardia: < 60 bpm
PART 6 - SYSTEMATIC ECG READING (The 5-Step Method)
Step 1: Rate
- Fast or slow? Calculate using boxes method above.
Step 2: Rhythm
- Is it regular or irregular?
- Is there a P before every QRS? Is there a QRS after every P?
- Is the pacemaker the SA node? (sinus rhythm = upright P in II, negative in aVR)
Step 3: Axis
- Normal axis: -30° to +90°
- Quick method: Look at leads I and aVF
- Both positive → Normal axis
- I positive, aVF negative → Left axis deviation (LAD)
- I negative, aVF positive → Right axis deviation (RAD)
- Both negative → Extreme axis (northwest)
Step 4: Intervals
- PR interval normal? (0.12-0.20 s)
- QRS duration normal? (< 0.12 s)
- QT interval corrected? (QTc < 440-460 ms)
Step 5: Morphology
- ST segment changes (elevation/depression)
- T wave changes (inversion, peaked)
- Pathological Q waves
- Bundle branch block patterns
- Hypertrophy criteria
PART 7 - NORMAL SINUS RHYTHM
- Rate 60-100 bpm
- Regular R-R intervals
- Upright P wave in lead II, negative in aVR
- PR interval 0.12-0.20 s
- Every P followed by a QRS
- QRS < 0.12 s
PART 8 - ARRHYTHMIAS
8.1 - Sinus Arrhythmias
| Arrhythmia | Rate | Key Feature |
|---|---|---|
| Sinus tachycardia | >100 bpm | Normal P waves, regular, physiological response |
| Sinus bradycardia | <60 bpm | Normal P waves, regular; athletes, vagal tone, hypothyroidism |
| Sinus arrhythmia | Variable | Rate varies with breathing (faster on inhale, slower on exhale) - NORMAL |
8.2 - Supraventricular Arrhythmias
Atrial Fibrillation (AF)
- No P waves - replaced by irregular fibrillatory (f) waves
- Irregularly irregular R-R intervals
- Narrow QRS (unless aberrant conduction)
- Ventricular rate 100-170 bpm if uncontrolled
Atrial Flutter
- Regular "sawtooth" flutter waves at 250-350/min (usually 300/min)
- Ventricular rate usually 150/min (2:1 block)
- Regular or regularly irregular rhythm
SVT (Supraventricular Tachycardia)
- Sudden onset/offset ("paroxysmal")
- Rate 150-250 bpm
- Narrow QRS
- P waves may be absent, buried in QRS, or retrograde (negative in II)
- Most common: AVNRT (AV node re-entry)
8.3 - Ventricular Arrhythmias
Premature Ventricular Complexes (PVCs)
- Wide QRS (> 0.12 s), bizarre morphology
- No preceding P wave
- Full compensatory pause
- T wave opposite to QRS direction
Ventricular Tachycardia (VT)
- Rate > 100 bpm, usually 120-200 bpm
- Wide, bizarre QRS (> 0.12 s)
- Regular rhythm
- AV dissociation (P waves march through independently)
- Life-threatening - requires urgent treatment
Ventricular Fibrillation (VF)
- Completely chaotic, disorganized electrical activity
- No recognizable P, QRS, or T waves
- Irregular oscillations of varying amplitude
- Cardiac arrest - immediate defibrillation required
8.4 - Heart Blocks (Conduction Disturbances)
First-Degree AV Block
- PR interval > 0.20 s (> 5 small boxes)
- Every P is followed by a QRS
- Not a true "block" - just slowed conduction
- Often benign; can be caused by increased vagal tone, digoxin, inferior MI
Second-Degree AV Block - Mobitz Type I (Wenckebach)
- Progressive PR prolongation until a P wave is dropped (QRS dropped)
- Then the cycle resets
- Grouped beating pattern
- Usually benign; block is at the AV node level
Second-Degree AV Block - Mobitz Type II
- Constant PR interval then sudden dropped QRS (no warning)
- More serious - block is infranodal (His-Purkinje level)
- Risk of progressing to complete heart block
- Often requires pacemaker
Third-Degree (Complete) AV Block
- Complete AV dissociation - P waves and QRS complexes march independently
- P waves have their own rate (usually 60-100/min)
- QRS has its own rate (escape rhythm: junctional 40-60/min; ventricular 20-40/min)
- Wide QRS = ventricular escape (worse prognosis)
- Medical emergency - requires pacemaker
PART 9 - BUNDLE BRANCH BLOCKS
Key Rule for Bundle Branch Blocks: "WiLLiaM MaRRoW"
| Block | Lead V1 | Lead V6 |
|---|---|---|
| LBBB (Left BBB) | W pattern (rS) | M pattern (broad R) |
| RBBB (Right BBB) | M pattern (RSR' = "rabbit ears") | W pattern (rSR') |
Right Bundle Branch Block (RBBB)
- RSR' in V1 ("rabbit ears" or M-shaped)
- Wide S wave in I, aVL, V5-V6
- Secondary ST/T changes opposite to QRS
- Can be normal variant (incomplete RBBB)
Left Bundle Branch Block (LBBB)
- Broad, notched R in V5-V6, I, aVL
- Deep S or QS in V1
- No septal Q waves in lateral leads
- Always pathological - always investigate
- Changes the entire ECG interpretation (ST/T changes no longer reliable for ischemia)
PART 10 - MYOCARDIAL ISCHEMIA AND INFARCTION
Ischemia vs Injury vs Infarction
| Stage | ECG Finding | Reversibility |
|---|---|---|
| Ischemia | T wave inversion | Reversible |
| Injury | ST elevation | Usually reversible with reperfusion |
| Infarction | Pathological Q waves | Permanent |
ST-Elevation MI (STEMI)
- Hyperacute T waves (peaked, broad)
- ST elevation (convex/"tombstone" shape in large MI)
- Pathological Q waves develop
- ST returns to baseline
- T wave inversion (can persist weeks-months)
STEMI Localization
| Location | Elevated Leads | Artery |
|---|---|---|
| Inferior | II, III, aVF | RCA (85%) |
| Anterior | V1-V4 | LAD |
| Lateral | I, aVL, V5-V6 | LCx |
| Posterior | Tall R in V1-V2 + ST depression V1-V3 | RCA/LCx |
| RV infarct | ST elevation in V4R | RCA |
Non-STEMI / Unstable Angina
- ST depression ≥ 0.5-1 mm in 2+ leads
- T wave inversion in 2+ leads
- Elevated troponins distinguish NSTEMI from unstable angina
Pathological Q Waves
- Width ≥ 0.04 s (1 small box)
- Depth ≥ 25% of R wave amplitude
- Present in V1-V3 (any Q wave is abnormal there)
- Indicate prior/old transmural infarction
PART 11 - HYPERTROPHY PATTERNS
Left Ventricular Hypertrophy (LVH)
- S in V1 + R in V5 (or V6) ≥ 35 mm
- Or R in aVL ≥ 11 mm
Right Ventricular Hypertrophy (RVH)
- Right axis deviation (RAD)
- Dominant R wave in V1 (R > S)
- Deep S waves in V5-V6
- Associated with: pulmonary hypertension, COPD, pulmonary stenosis
PART 12 - ELECTROLYTE AND METABOLIC CHANGES ON ECG
Hyperkalemia (High K+)
- Peaked, narrow, "tented" T waves (earliest sign)
- PR prolongation → P wave flattening → absent P waves
- Wide QRS (sine wave pattern)
- Eventually: VF/asystole
Hypokalemia (Low K+)
- ST depression
- T wave flattening/inversion
- Prominent U waves (U wave > T wave)
- Prolonged QU interval (mimics long QT)
Hypercalcemia
- Short QT interval (shortened ST segment)
Hypocalcemia
- Prolonged QT interval (lengthened ST segment)
Long QT Syndrome
- QTc > 440 ms (men), > 460 ms (women)
- Risk of torsades de pointes (polymorphic VT)
- Causes: congenital channelopathies, drugs (antiarrhythmics, antipsychotics, antibiotics), electrolyte abnormalities
PART 13 - OTHER IMPORTANT ECG PATTERNS
Pericarditis
- Diffuse ST elevation (concave/"saddle-shaped") in multiple leads (not fitting one artery territory)
- PR depression in multiple leads (very specific)
- No reciprocal ST depression (differentiates from STEMI)
- Evolves through 4 stages
Pulmonary Embolism
- Sinus tachycardia (most common)
- S1Q3T3 pattern: Large S in I, Q wave and T inversion in III
- Right heart strain: new RBBB, right axis deviation
- T inversion in V1-V4
Wolff-Parkinson-White (WPW)
- Delta wave (slurred upstroke of QRS)
- Short PR interval (< 0.12 s)
- Wide QRS (pseudo BBB)
- Due to accessory pathway bypassing AV node
- Risk: AF with rapid conduction down accessory pathway → VF
Brugada Syndrome
- Coved ST elevation in V1-V2 (≥ 2 mm downsloping ST)
- RBBB-like pattern
- Normal QT
- Risk of sudden cardiac death in young males
- Often unmask with sodium channel blockers or fever
Digitalis Effect
- "Reverse tick" or "scooped" ST depression (like a tick mark flipped)
- T wave changes, short QT
- PR prolongation
- Toxicity: PVCs, AV block, bidirectional VT
PART 14 - QUICK REFERENCE CHEAT SHEET
| Finding | Think of |
|---|---|
| Irregularly irregular + no P waves | AF |
| Sawtooth flutter waves | Atrial flutter |
| Narrow complex tachycardia | SVT |
| Wide QRS tachycardia | VT until proven otherwise |
| PR > 0.20 s | 1st degree AV block |
| Progressive PR then dropped beat | Wenckebach (Mobitz I) |
| Sudden dropped beat, PR constant | Mobitz II |
| P and QRS march independently | Complete heart block |
| RSR' in V1 | RBBB |
| Broad R in V5-V6, no lateral Q waves | LBBB |
| ST elevation fitting one territory + reciprocal changes | STEMI |
| Diffuse concave ST elevation + PR depression | Pericarditis |
| Short PR + delta wave + wide QRS | WPW |
| Peaked T waves | Hyperkalemia |
| Prominent U waves | Hypokalemia |
| Long QT | Torsades risk |
| S1Q3T3 + tachycardia | PE |
| Coved ST V1-V2 | Brugada |
PART 15 - ADVANCED: ECG AXIS IN DETAIL
| Lead I | aVF | Axis |
|---|---|---|
| Positive | Positive | Normal (-30° to +90°) |
| Positive | Negative | Left axis deviation |
| Negative | Positive | Right axis deviation |
| Negative | Negative | Extreme ("northwest") axis |
Learning Path Summary
Waveform identification → Grid/measurements → Lead anatomy → Rate calculation → Normal sinus rhythm
AF, AV blocks, bundle branch blocks → STEMI localization → LVH/RVH
Electrolyte changes → Special syndromes (WPW, Brugada, Long QT) → Complex arrhythmias → Posterior/RV MI → Axis calculations