Give a detailed explanation of all types and categories of edema and its causes, pathophysiology, and examples. with realistic and understandable examples

Reading File
Finding Sources
Finding Sources
Searching Images

edema types pitting non-pitting pathophysiology diagram
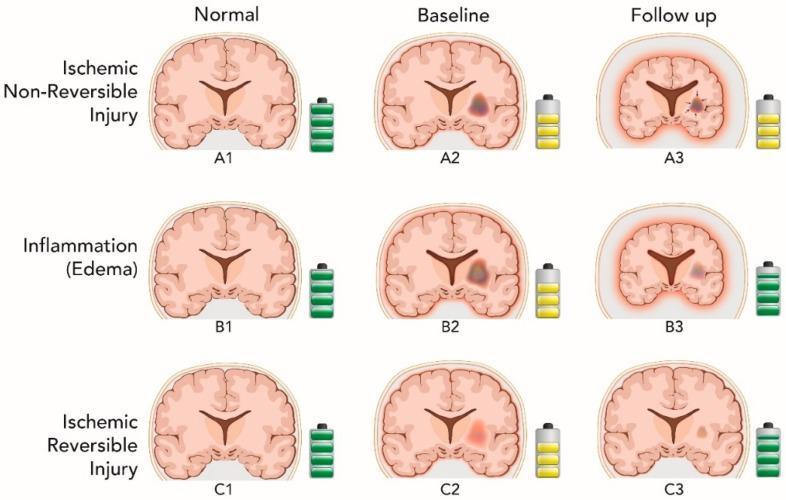
This Comparison Chart illustrates three conceptual pathophysiology mechanisms explaining White Matter Hyperintensity (WMH) regression and its impact on brain volume and cognitive performance. The diagram is organized into a 3x3 grid across categories of injury: Ischemic Non-Reversible (Row A), Inflammation/Edema (Row B), and Ischemic Reversible (Row C), tracked from 'Normal' to 'Baseline' to 'Follow up.' Battery icons adjacent to each brain signify cognitive performance levels. Row A demonstrates mechanical lesion contraction (black arrows in A3) leading to reduced overall brain volume (atrophy) with stagnant cognitive performance. Row B shows WMH resolution as edema clears, also resulting in decreased brain volume but showing cognitive improvement. Row C illustrates the most favorable outcome, where WMH volume regresses while both global brain volume and cognitive performance increase, suggesting neural recovery. Key visual elements include the relative sizing of brain outlines to represent atrophy or expansion and the intensity of periventricular/subcortical shading to represent WMH lesions.
This Comparison Chart illustrates three conceptual pathophysiology mechanisms explaining White Matter Hyperintensity (WMH) regression and its impact on brain volume and cognitive performance. The diagram is organized into a 3x3 grid across categories of injury: Ischemic Non-Reversible (Row A), Inflammation/Edema (Row B), and Ischemic Reversible (Row C), tracked from 'Normal' to 'Baseline' to 'Follow up.' Battery icons adjacent to each brain signify cognitive performance levels. Row A demonstrates mechanical lesion contraction (black arrows in A3) leading to reduced overall brain volume (atrophy) with stagnant cognitive performance. Row B shows WMH resolution as edema clears, also resulting in decreased brain volume but showing cognitive improvement. Row C illustrates the most favorable outcome, where WMH volume regresses while both global brain volume and cognitive performance increase, suggesting neural recovery. Key visual elements include the relative sizing of brain outlines to represent atrophy or expansion and the intensity of periventricular/subcortical shading to represent WMH lesions.

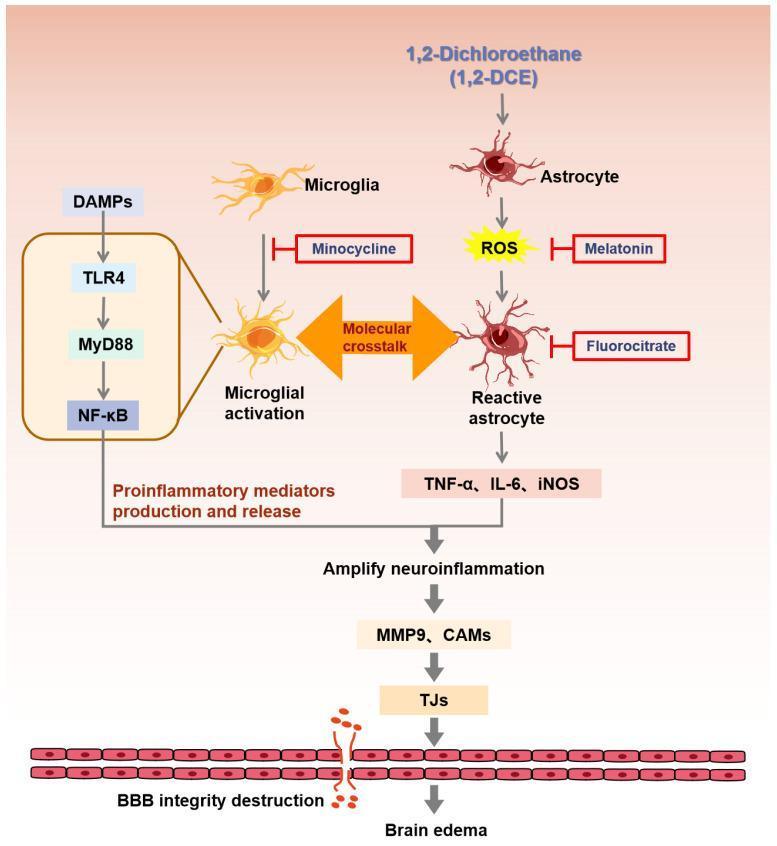
This pathophysiology diagram illustrates the molecular signaling pathways of 1,2-Dichloroethane (1,2-DCE) induced neuroinflammation and brain edema. The schematic depicts 1,2-DCE exposure triggering two parallel cellular responses: microglial activation and astrocyte transformation into reactive astrocytes. Microglia activation is shown occurring via the TLR4/MyD88/NF-κB pathway stimulated by DAMPs, while astrocytes generate reactive oxygen species (ROS). A central feature of the diagram is the 'molecular crosstalk' between these two cell types, which amplifies the neuroinflammatory response. This cascade leads to the overproduction and release of proinflammatory mediators, including TNF-α, IL-6, and iNOS. These cytokines further increase the levels of MMP-9 and cell-adhesion molecules (CAMs), which target and degrade tight junction proteins (TJs) in the blood-brain barrier (BBB). The final stages of the process show BBB integrity destruction leading to cerebral edema. The diagram also identifies potential therapeutic inhibitors: minocycline (blocking microglial activation), and melatonin or fluorocitrate (inhibiting reactive astrocyte pathways).
This pathophysiology diagram illustrates the molecular signaling pathways of 1,2-Dichloroethane (1,2-DCE) induced neuroinflammation and brain edema. The schematic depicts 1,2-DCE exposure triggering two parallel cellular responses: microglial activation and astrocyte transformation into reactive astrocytes. Microglia activation is shown occurring via the TLR4/MyD88/NF-κB pathway stimulated by DAMPs, while astrocytes generate reactive oxygen species (ROS). A central feature of the diagram is the 'molecular crosstalk' between these two cell types, which amplifies the neuroinflammatory response. This cascade leads to the overproduction and release of proinflammatory mediators, including TNF-α, IL-6, and iNOS. These cytokines further increase the levels of MMP-9 and cell-adhesion molecules (CAMs), which target and degrade tight junction proteins (TJs) in the blood-brain barrier (BBB). The final stages of the process show BBB integrity destruction leading to cerebral edema. The diagram also identifies potential therapeutic inhibitors: minocycline (blocking microglial activation), and melatonin or fluorocitrate (inhibiting reactive astrocyte pathways).

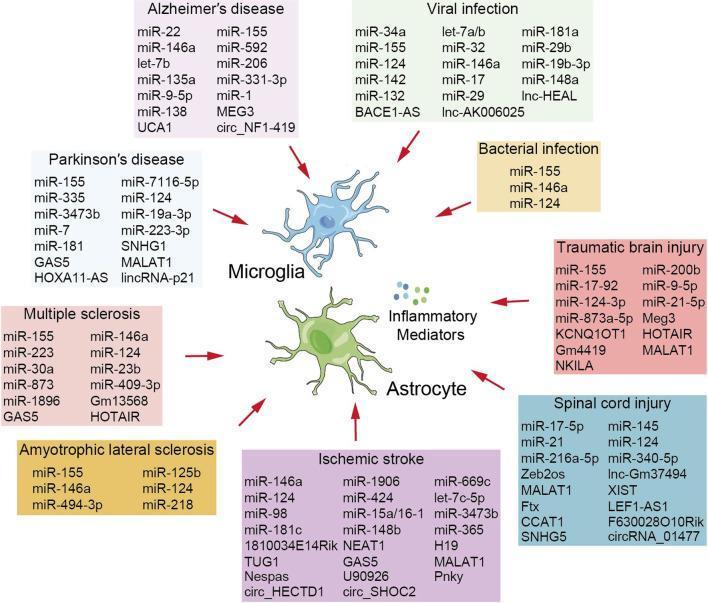
This medical pathophysiology diagram summarizes the role of non-coding RNAs (ncRNAs) in neuroinflammation across various central nervous system (CNS) conditions. The central focus features two key glial cell types: a blue-colored Microglia and a green, star-shaped Astrocyte, with 'Inflammatory Mediators' (represented as blue and green clusters) positioned between them. Surrounding these central elements are nine labeled boxes representing neurological diseases and injuries: Alzheimer’s disease, Parkinson’s disease, Multiple sclerosis, Amyotrophic lateral sclerosis, Ischemic stroke, Traumatic brain injury, Spinal cord injury, Viral infection, and Bacterial infection. Each box contains a detailed list of associated miRNAs (e.g., miR-155, miR-124, miR-146a), lncRNAs (e.g., MALAT1, GAS5, HOTAIR), and circRNAs (e.g., circ_NF1-419). Red arrows point from each disease box toward the microglia and astrocytes, illustrating how these ncRNAs act as regulatory factors that control glial activation and the release of inflammatory mediators in both chronic neurodegenerative diseases and acute neurological injuries.
This medical pathophysiology diagram summarizes the role of non-coding RNAs (ncRNAs) in neuroinflammation across various central nervous system (CNS) conditions. The central focus features two key glial cell types: a blue-colored Microglia and a green, star-shaped Astrocyte, with 'Inflammatory Mediators' (represented as blue and green clusters) positioned between them. Surrounding these central elements are nine labeled boxes representing neurological diseases and injuries: Alzheimer’s disease, Parkinson’s disease, Multiple sclerosis, Amyotrophic lateral sclerosis, Ischemic stroke, Traumatic brain injury, Spinal cord injury, Viral infection, and Bacterial infection. Each box contains a detailed list of associated miRNAs (e.g., miR-155, miR-124, miR-146a), lncRNAs (e.g., MALAT1, GAS5, HOTAIR), and circRNAs (e.g., circ_NF1-419). Red arrows point from each disease box toward the microglia and astrocytes, illustrating how these ncRNAs act as regulatory factors that control glial activation and the release of inflammatory mediators in both chronic neurodegenerative diseases and acute neurological injuries.

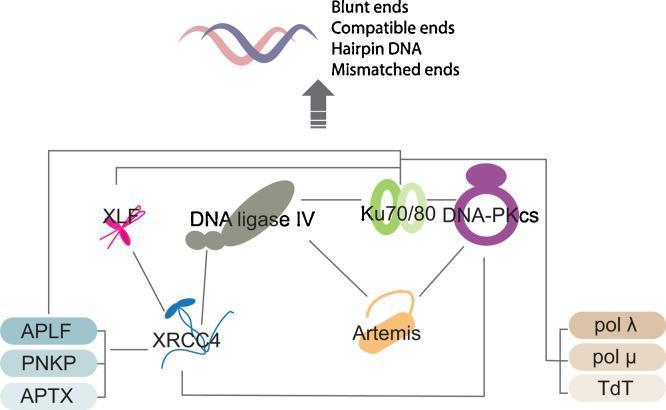
This pathophysiology diagram illustrates the Non-Homologous End Joining (NHEJ) pathway, a critical DNA double-strand break repair mechanism. At the top, a double-helix DNA strand is shown with annotations for various lesion types, including blunt ends, compatible ends, hairpin DNA, and mismatched ends. A central interaction network below depicts the protein assembly required for repair. Key core components are visually represented: the Ku70/80 heterodimer (green interlinked ovals), DNA-PKcs (purple ring-like structure), and DNA ligase IV (grey irregular shape). These are connected via lines indicating protein-protein interactions with additional regulatory factors: XLF (pink), XRCC4 (blue), and Artemis (orange). Secondary processing factors are grouped on the periphery: APLF, PNKP, and APTX on the left; and polymerases (pol λ, pol μ) and TdT on the right. The diagram serves as an educational map of molecular signaling, highlighting the complex recruitment and interaction of ligases, kinases, and nucleases in maintaining genomic stability.
This pathophysiology diagram illustrates the Non-Homologous End Joining (NHEJ) pathway, a critical DNA double-strand break repair mechanism. At the top, a double-helix DNA strand is shown with annotations for various lesion types, including blunt ends, compatible ends, hairpin DNA, and mismatched ends. A central interaction network below depicts the protein assembly required for repair. Key core components are visually represented: the Ku70/80 heterodimer (green interlinked ovals), DNA-PKcs (purple ring-like structure), and DNA ligase IV (grey irregular shape). These are connected via lines indicating protein-protein interactions with additional regulatory factors: XLF (pink), XRCC4 (blue), and Artemis (orange). Secondary processing factors are grouped on the periphery: APLF, PNKP, and APTX on the left; and polymerases (pol λ, pol μ) and TdT on the right. The diagram serves as an educational map of molecular signaling, highlighting the complex recruitment and interaction of ligases, kinases, and nucleases in maintaining genomic stability.

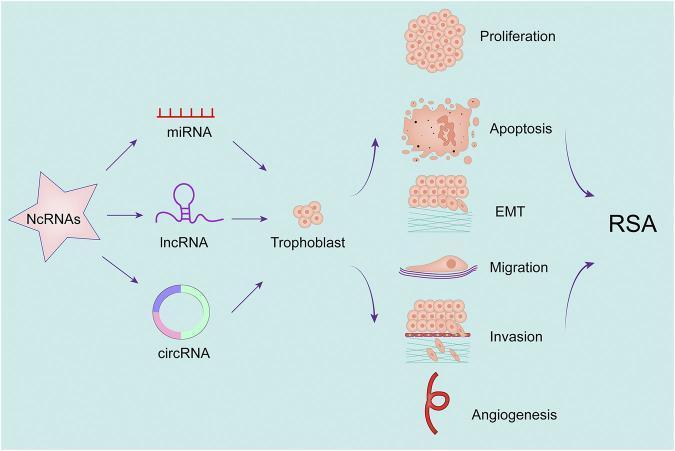
A pathophysiology diagram illustrating the regulatory role of non-coding RNAs (ncRNAs) on placental trophoblast function and their clinical association with Recurrent Spontaneous Abortion (RSA). The flow begins on the left with three types of ncRNAs—miRNA (linear structure), lncRNA (hairpin loop), and circRNA (circular loop)—which are shown to target and modulate Trophoblast cells. The diagram then delineates six downstream cellular and physiological processes: Proliferation, Apoptosis, Epithelial-Mesenchymal Transition (EMT), Migration, Invasion, and Angiogenesis. These processes are represented by distinct icons, such as a dense cell cluster for proliferation, fragmented cells for apoptosis, and a looping vessel for angiogenesis. The visual logic utilizes directional arrows to link these biological changes to RSA. Specifically, increased apoptosis and altered migration are directly linked to RSA with pointing arrows, while proliferation, EMT, invasion, and angiogenesis are shown with arrows curving away, suggesting that the inhibition or dysfunction of these processes contributes to the pathology of recurrent abortion.
A pathophysiology diagram illustrating the regulatory role of non-coding RNAs (ncRNAs) on placental trophoblast function and their clinical association with Recurrent Spontaneous Abortion (RSA). The flow begins on the left with three types of ncRNAs—miRNA (linear structure), lncRNA (hairpin loop), and circRNA (circular loop)—which are shown to target and modulate Trophoblast cells. The diagram then delineates six downstream cellular and physiological processes: Proliferation, Apoptosis, Epithelial-Mesenchymal Transition (EMT), Migration, Invasion, and Angiogenesis. These processes are represented by distinct icons, such as a dense cell cluster for proliferation, fragmented cells for apoptosis, and a looping vessel for angiogenesis. The visual logic utilizes directional arrows to link these biological changes to RSA. Specifically, increased apoptosis and altered migration are directly linked to RSA with pointing arrows, while proliferation, EMT, invasion, and angiogenesis are shown with arrows curving away, suggesting that the inhibition or dysfunction of these processes contributes to the pathology of recurrent abortion.

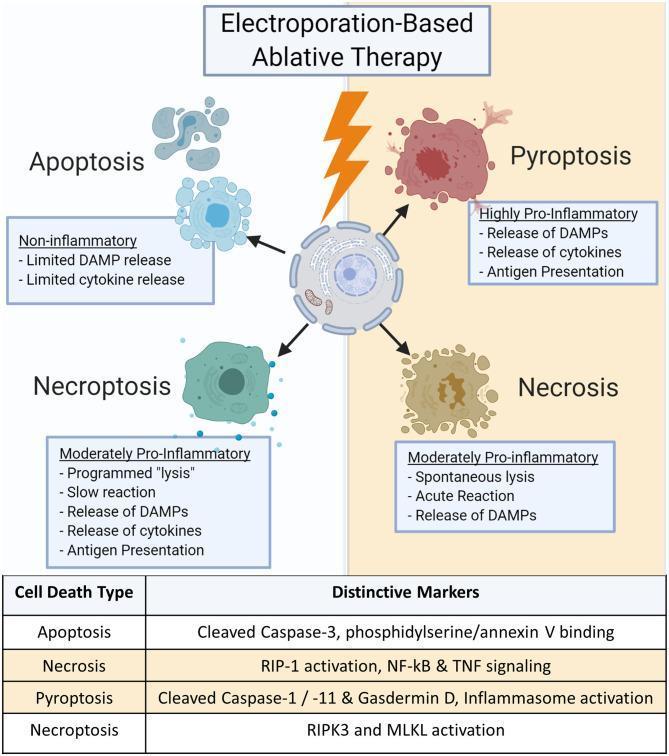
This pathophysiology diagram illustrates the four primary types of cell death initiated by electroporation-based ablative therapy: Apoptosis, Pyroptosis, Necroptosis, and Necrosis. A central cell subjected to an electrical pulse branches into these distinct pathways, categorized by their inflammatory impact and biochemical markers. Apoptosis is described as non-inflammatory with limited DAMP and cytokine release, characterized by cleaved Caspase-3 and annexin V binding. Pyroptosis is highly pro-inflammatory, involving Caspase-1/-11, Gasdermin D, and inflammasome activation, leading to cytokine release and antigen presentation. Necroptosis is a moderately pro-inflammatory, programmed lysis involving RIPK3 and MLKL activation. Necrosis is a moderately pro-inflammatory, spontaneous lysis involving RIP-1, NF-kB, and TNF signaling. The visual contrasts the morphology of each type, from the organized blebbing of apoptosis to the violent rupture of pyroptosis and the acute disintegration of necrosis. A summary table provides a quick reference for the distinctive molecular markers associated with each cellular subroutine, emphasizing the clinical relevance of selecting specific death pathways for effective tumor treatment and immune response modulation.

This pathophysiology diagram illustrates the four primary types of cell death initiated by electroporation-based ablative therapy: Apoptosis, Pyroptosis, Necroptosis, and Necrosis. A central cell subjected to an electrical pulse branches into these distinct pathways, categorized by their inflammatory impact and biochemical markers. Apoptosis is described as non-inflammatory with limited DAMP and cytokine release, characterized by cleaved Caspase-3 and annexin V binding. Pyroptosis is highly pro-inflammatory, involving Caspase-1/-11, Gasdermin D, and inflammasome activation, leading to cytokine release and antigen presentation. Necroptosis is a moderately pro-inflammatory, programmed lysis involving RIPK3 and MLKL activation. Necrosis is a moderately pro-inflammatory, spontaneous lysis involving RIP-1, NF-kB, and TNF signaling. The visual contrasts the morphology of each type, from the organized blebbing of apoptosis to the violent rupture of pyroptosis and the acute disintegration of necrosis. A summary table provides a quick reference for the distinctive molecular markers associated with each cellular subroutine, emphasizing the clinical relevance of selecting specific death pathways for effective tumor treatment and immune response modulation.

Reading File
Reading File
Reading File
Reading File
Finding Sources
Finding Sources
Reading File
Reading File
Loading Image
Reading File
Reading File
Finding Sources
Reading File
Loading Image
Loading Image
Reading File
Loading Image
Loading Image
I now have comprehensive content from authoritative textbooks and excellent diagrams. I have enough to write a thorough, detailed answer. Let me compile everything now.

Edema: A Comprehensive Guide to All Types, Categories, Causes, and Pathophysiology

Edema is the abnormal accumulation of excess fluid in the interstitial (extravascular) spaces of tissues or in body cavities. About 60% of lean body weight is water; two-thirds is intracellular, and most of the remaining third is interstitial fluid. Edema occurs when this interstitial compartment is overloaded beyond the lymphatic system's ability to drain it.
Robbins & Kumar Basic Pathology, p. 78: "Edema is an accumulation of interstitial fluid within tissues. Extravascular fluid can also collect in body cavities, where it is often referred to as an effusion."

The Fundamental Mechanism: Starling Forces
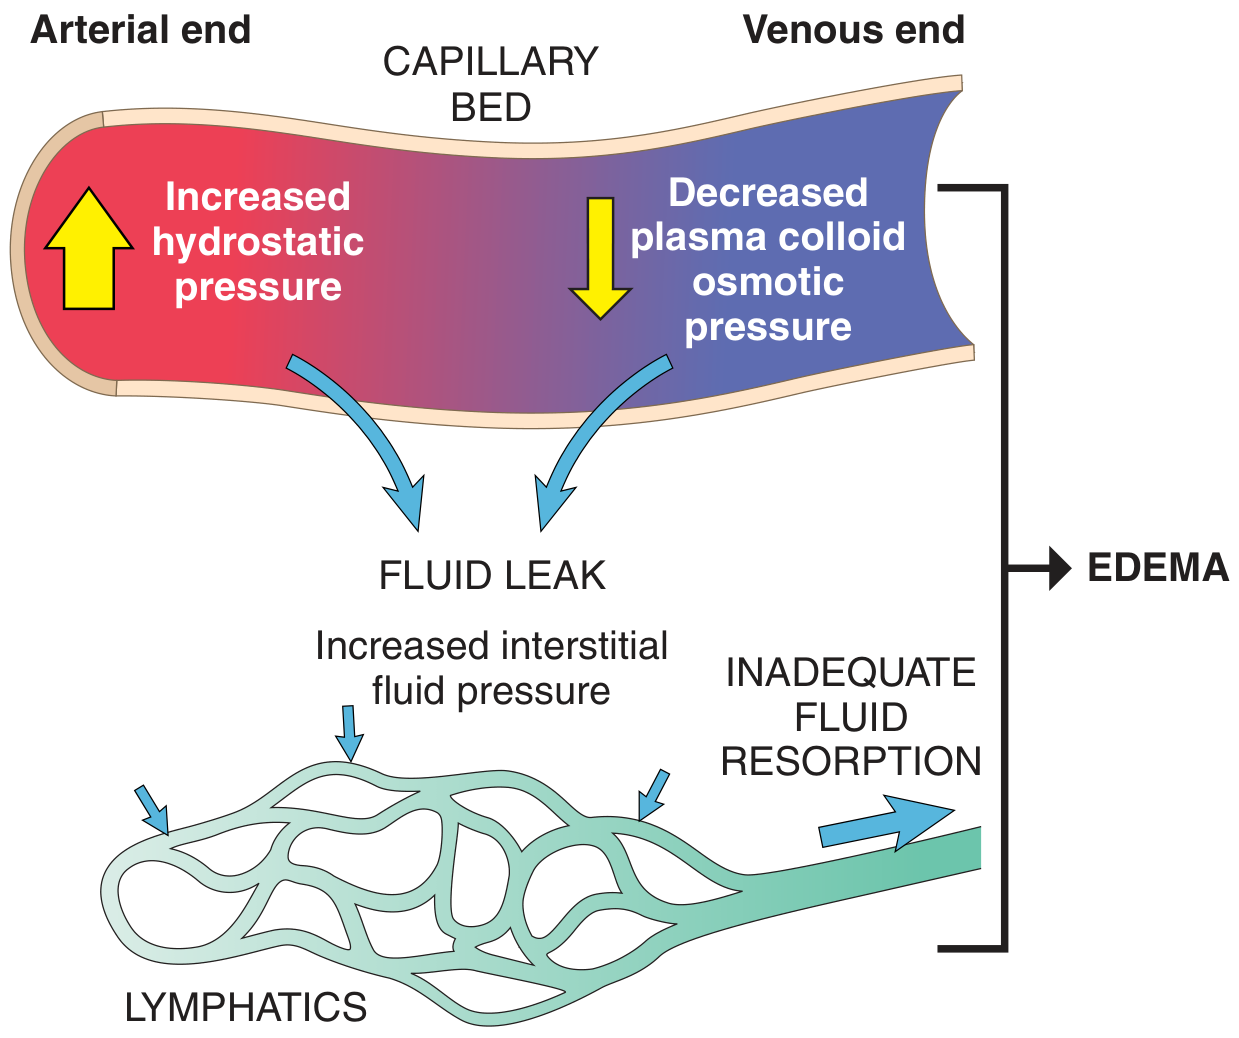
Everything about edema starts with the balance between two competing forces across the capillary wall:
Starling forces diagram showing capillary hydrostatic pressure, plasma colloid osmotic pressure, fluid leak, and lymphatic resorption leading to edema
FIG. 3.2 from Robbins Pathology - Factors influencing fluid movement across capillary walls
ForceEffectNormal Value
Capillary hydrostatic pressure (pushes fluid OUT of vessel)Drives filtration into interstitium~35 mmHg at arteriolar end, ~15 mmHg at venular end
Plasma colloid osmotic pressure (pulls fluid INTO vessel)Reabsorbs fluid back into capillary~28 mmHg (mainly from albumin)
At the arteriolar end, hydrostatic pressure exceeds osmotic pressure - fluid leaks out. At the venular end, osmotic pressure dominates - fluid is reabsorbed. The small net leak is returned to the bloodstream via lymphatics through the thoracic duct.
Edema results when any of these fail:
  1. Hydrostatic pressure rises too high
  2. Plasma osmotic pressure drops too low
  3. Vascular walls become abnormally leaky
  4. Lymphatic drainage is blocked
  5. Kidneys retain too much sodium and water

Classification 1: By Fluid Composition

Transudate

  • Protein-poor, low-specific-gravity fluid (SG < 1.012)
  • Results from mechanical imbalance (high pressure or low osmotic pull)
  • Clear, watery - like water leaking through a garden hose
  • Seen in: heart failure, nephrotic syndrome, cirrhosis

Exudate

  • Protein-rich, high-specific-gravity fluid (SG > 1.020)
  • Results from increased vascular permeability due to inflammation
  • Contains white blood cells, clotting proteins
  • Cloudy or turbid - like fluid in an infected blister
  • Seen in: pneumonia, peritonitis, allergic reactions

Classification 2: By Distribution

Localized Edema

Confined to one region or organ. The local phenomenon responsible should be identified first.
TypeLocationTypical Cause
Leg edema (unilateral)One limbDVT (deep vein thrombosis)
Periorbital edemaAround eyesNephrotic syndrome, allergic reaction
Pulmonary edemaLung interstitium/alveoliLeft heart failure
Cerebral edemaBrain parenchymaStroke, trauma, tumor
LymphedemaArm or legCancer surgery, filariasis
AscitesPeritoneal cavityCirrhosis

Generalized Edema (Anasarca)

Severe, whole-body edema with profound swelling of subcutaneous tissues and accumulation in all body cavities. Seen in end-stage heart failure, nephrotic syndrome, and starvation.

Classification 3: By Pitting vs. Non-Pitting

Pitting Edema

Press a finger into the swollen tissue for 5 seconds - a depression (pit) remains.
  • Fluid is not protein-bound and can be displaced
  • Seen in: heart failure, venous insufficiency, low albumin, renal failure
  • Graded 1+ to 4+ based on depth of pit (2 mm to >8 mm)
Example: A 65-year-old man with CHF has bilateral ankle swelling that leaves a 5-mm pit when pressed. He sleeps and the ankle edema migrates to sacral edema because of gravity.

Non-Pitting Edema

No pit forms on pressure.
  • Fluid is protein-rich or tissue has undergone fibrosis
  • Seen in: lymphedema, myxedema (hypothyroidism), chronic venous stasis with fibrosis
  • The tissue feels firm or rubbery, not soft
Example: A woman with hypothyroidism has puffy, firm eyelids and pretibial swelling that does not pit. This is myxedema - mucopolysaccharides deposited in the dermis hold water and resist displacement.

The Six Major Pathophysiologic Categories

1. Increased Hydrostatic Pressure
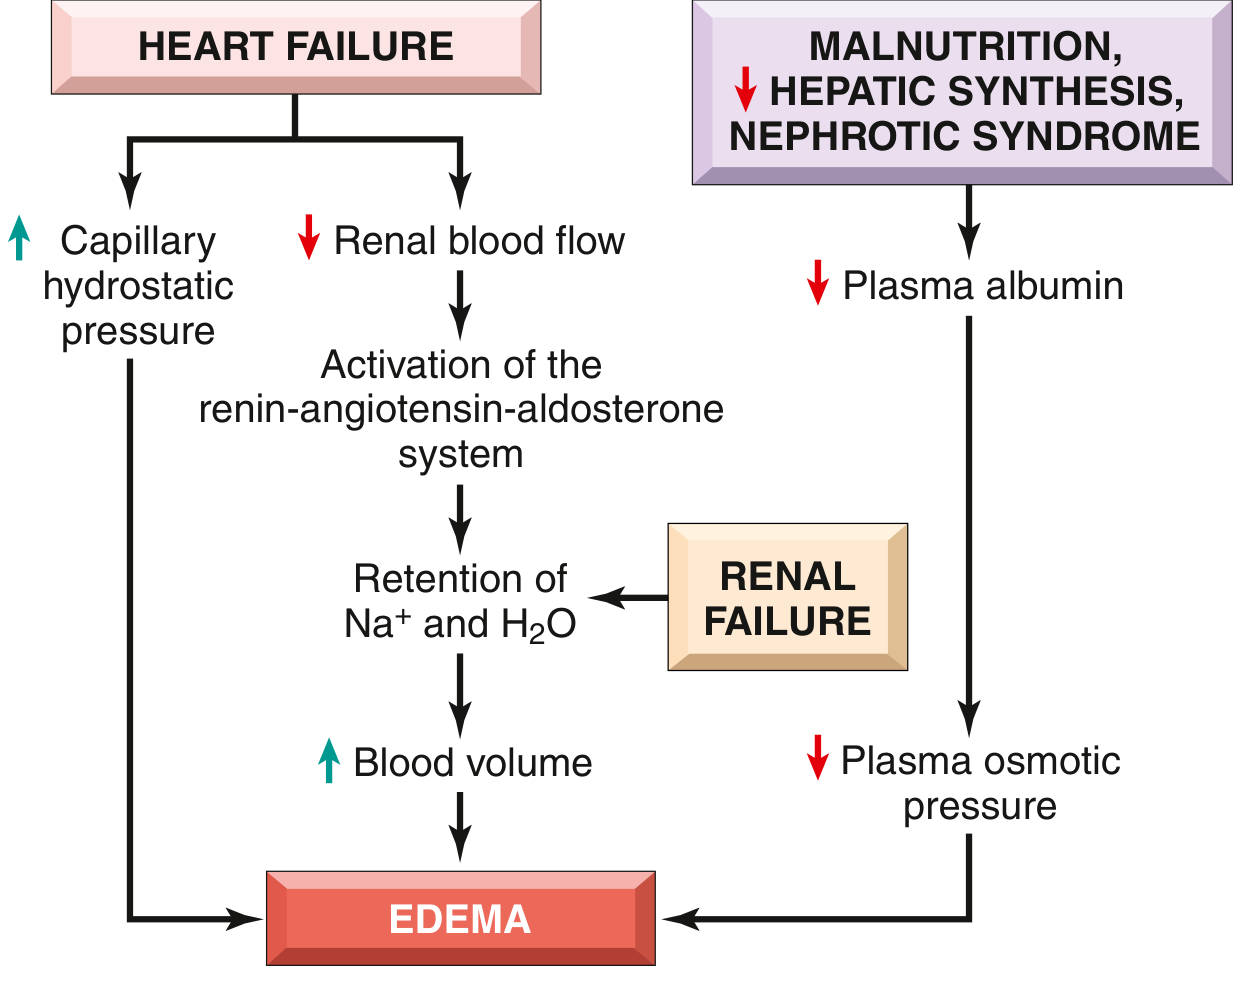
Mechanism: The "push" force is so high that even normal osmotic forces cannot pull fluid back in. Fluid pours into the interstitium faster than lymphatics can drain it.
Pathways leading to systemic edema from heart failure, renal failure, or reduced plasma osmotic pressure
FIG. 3.3 from Robbins - The cascade linking heart failure and renal failure to edema
Causes and Examples:
a) Congestive Heart Failure (CHF) The failing heart cannot pump blood forward efficiently. Blood "dams up" behind it in the venous system.
  • In right heart failure: blood backs up into systemic veins → elevated venous pressure → bilateral ankle/leg edema, ascites, jugular venous distension
  • In left heart failure: blood backs up into pulmonary veins → pulmonary edema (fluid in the lungs)
Cascade: Reduced cardiac output → decreased kidney perfusion → RAAS (renin-angiotensin-aldosterone system) activation → sodium and water retention → increased blood volume → worsening hydrostatic pressure → more edema. A vicious cycle.
Robbins, p. 79: "The failing heart often cannot increase its output in response to increases in cardiac filling, and a vicious cycle of fluid retention, increased venous hydrostatic pressures, and worsening edema ensues."
Realistic Example: Think of your heart as a water pump and your veins as pipes. If the pump weakens, water backs up in the pipes. Your ankles and feet swell by evening because you've been standing (gravity) and your venous pump can't push blood up fast enough. When you lie down, that fluid redistributes and can flow into your lungs, causing you to wake up gasping (paroxysmal nocturnal dyspnea).
b) Deep Vein Thrombosis (DVT) A blood clot in the leg vein blocks venous outflow. Hydrostatic pressure builds up distal to the clot.
Example: After a long-haul flight (10+ hours), a 45-year-old woman notices her left leg is swollen, warm, and tender but the right is fine. That asymmetry is a red flag for DVT - localized increased hydrostatic pressure from clot obstruction.
c) Liver Cirrhosis Portal hypertension (increased pressure in the portal vein) causes hydrostatic pressure to rise, pushing fluid out of portal capillaries into the peritoneal cavity → ascites.
d) Prolonged Standing / Dependency Even in a healthy person, standing for 8+ hours allows hydrostatic pressure to build in the leg capillaries. This causes mild dependent edema at the end of the day that resolves overnight when the legs are elevated.

2. Reduced Plasma Osmotic Pressure (Hypoalbuminemia)

Mechanism: Albumin is responsible for about half of all plasma protein and is the primary contributor to colloid osmotic pressure. When albumin levels fall, the "pulling" force weakens and fluid escapes into tissues.
Normal albumin: ~4.0 g/dL. Edema typically appears when albumin falls below ~2.5 g/dL.
Causes and Examples:
a) Nephrotic Syndrome Damage to the glomerular filtration barrier allows albumin to leak massively into urine (proteinuria > 3.5 g/day). Albumin is lost faster than the liver can make it.
Example: A 6-year-old boy presents with puffy eyelids in the morning and swollen belly. His mother notices his urine is foamy. Urine dipstick shows 3+ protein. This is classic nephrotic syndrome (minimal change disease in children). The foamy urine is protein; the puffy eyes appear first because the eyelid skin is loose connective tissue that fills easily with fluid.
Robbins, p. 80: "Edema resulting from renal dysfunction or nephrotic syndrome often manifests first in loose connective tissues (e.g., the eyelids, causing periorbital edema)."
b) Liver Cirrhosis (Hypoalbuminemia component) The liver synthesizes albumin. In cirrhosis, damaged hepatocytes cannot produce enough. Combined with portal hypertension, this causes both ascites and peripheral edema.
Example: A chronic alcoholic with end-stage cirrhosis has a massively distended belly (ascites - up to 20 liters of fluid), swollen legs, and looks malnourished. He has albumin of 1.8 g/dL.
c) Protein Malnutrition (Kwashiorkor) Severe dietary protein deficiency leads to low albumin. Classic in children in famine regions.
Example: A 2-year-old malnourished child in a food-insecure region has a swollen belly and puffy face despite appearing wasted in the limbs. This "pot-belly" is ascites from hypoalbuminemia, not fat. This is kwashiorkor.
d) Protein-Losing Enteropathy Inflammatory bowel disease or intestinal lymphangiectasia causes proteins to leak into the gut.

3. Increased Vascular Permeability (Inflammatory Edema)

Mechanism: Inflammatory mediators (histamine, bradykinin, serotonin, leukotrienes, substance P) cause endothelial cells to contract, creating gaps in capillary walls. Large protein molecules now pass through, dragging water with them. This produces a protein-rich exudate rather than a transudate.
Causes and Examples:
a) Acute Inflammation Any infected tissue becomes swollen because of increased vascular permeability. This is one of the five cardinal signs of inflammation (tumor = swelling).
Example: You sprain your ankle and it swells up within minutes. Mast cells release histamine, which widens intercellular gaps in capillary endothelium. Fluid and proteins pour out - the swelling is the exudate. It is warm, tender, and slightly red. This is acute inflammatory edema.
b) Allergic Reactions and Anaphylaxis Massive histamine release from mast cells causes widespread vascular leakage.
Example: A person stung by a bee develops a swollen, itchy welt at the site. In severe anaphylaxis, the same process becomes systemic - the throat swells (angioedema), blood pressure crashes because fluid pours out of the circulation.
c) Burns Thermal injury destroys capillary integrity over large areas. Huge volumes of protein-rich fluid leak out of the circulation into damaged tissues.
Example: A patient with 30% body-surface-area burns loses so much fluid into the burned tissue in the first 24 hours that they can go into hypovolemic shock despite appearing edematous. Burns units use the Parkland formula (4 mL × weight in kg × % burn = mL/24 hours) to replace this lost fluid.
d) ARDS (Acute Respiratory Distress Syndrome) Lung injury (from sepsis, aspiration, trauma) causes widespread alveolar capillary damage. Protein-rich fluid floods the alveoli - this is non-cardiogenic pulmonary edema.
Example: A 50-year-old with severe pneumonia develops worsening shortness of breath despite oxygen. Chest X-ray shows bilateral white-out (fluid in both lungs). His heart is fine - the problem is capillary leakiness from the infection. This is ARDS, a medical emergency.

4. Lymphatic Obstruction (Lymphedema)

Mechanism: Even when the Starling forces are balanced, small amounts of protein and fluid always leak into the interstitium. Lymphatics continuously drain this back to the circulation. If lymphatics are blocked, fluid - especially protein-rich fluid - accumulates and cannot be cleared. Over time, this protein triggers fibroblast proliferation and the tissue becomes firm and fibrotic (non-pitting).
Causes and Examples:
a) Cancer Surgery / Radiotherapy (Secondary Lymphedema) The most common cause in the developed world. When axillary lymph nodes are removed or irradiated during breast cancer treatment, lymphatic drainage from the arm is disrupted.
Example: A 52-year-old woman who had a mastectomy with axillary node dissection 2 years ago notices her right arm has been gradually swelling. It feels heavy, and her rings no longer fit. This is secondary lymphedema - the arm's lymph drainage has been surgically severed.
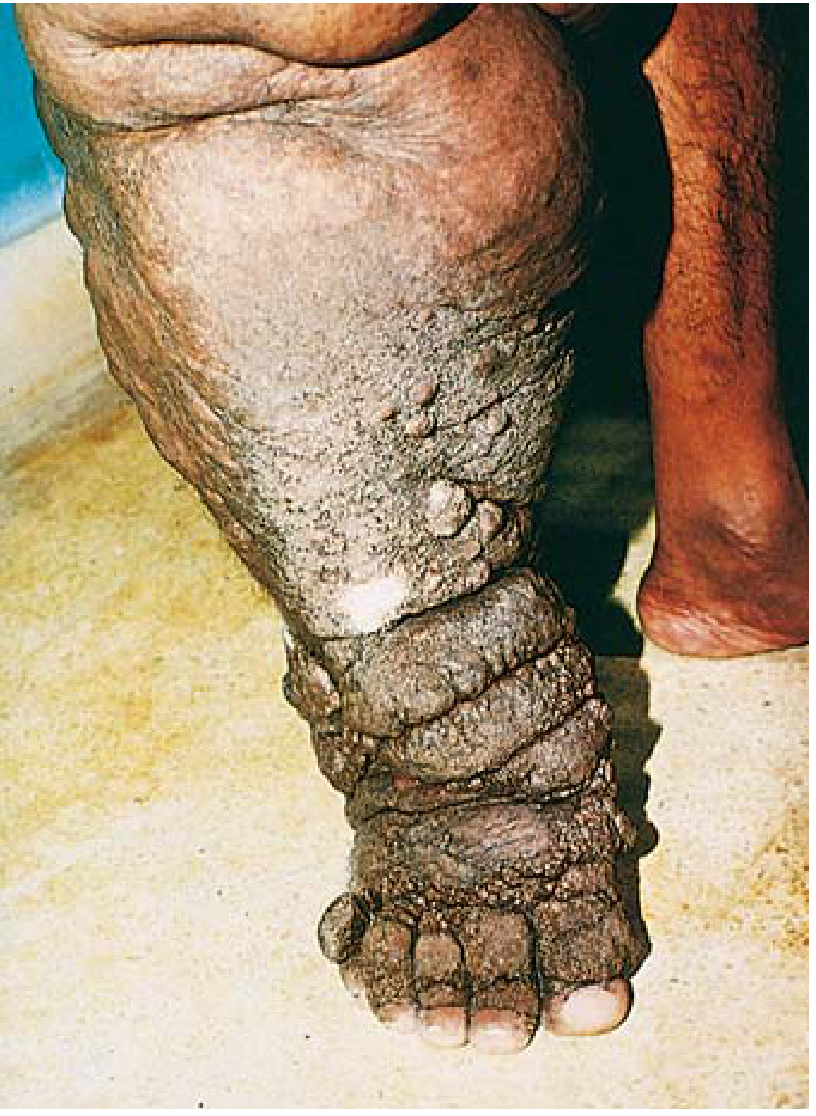
b) Filariasis (Tropical Elephantiasis) The parasitic worm Wuchereria bancrofti (transmitted by mosquitoes) lives in lymphatic vessels. Chronic infection causes fibrosis of the lymphatics and lymph nodes, most severely in the inguinal region.
Massive edema and elephantiasis of the leg caused by filarial infection (lymphatic obstruction)
eFIG. 3.2 from Robbins - Elephantiasis: the most dramatic example of lymphedema, caused by filarial parasites blocking inguinal lymphatics
Robbins, p. 80: "The parasitic infection filariasis can cause massive edema of the lower extremity and external genitalia (so-called 'elephantiasis') secondary to fibrosis of the inguinal lymphatics and lymph nodes."
Example: In tropical Africa and South Asia, repeated mosquito bites transmit the filarial worm. Over 10-15 years, the legs and genitals become grotesquely enlarged, with hardened, warty skin folds. The skin over the area becomes hypertropic, verrucous, and fibrotic.
c) Breast Cancer Skin Invasion (Peau d'Orange) When breast cancer infiltrates and blocks superficial lymphatics, the overlying skin develops a characteristic pitted appearance resembling orange peel - because each hair follicle becomes tethered while the surrounding skin swells.
d) Primary Lymphedema Congenital absence or hypoplasia of lymphatics. Milroy disease (hereditary lymphedema praecox) is an autosomal dominant condition.

5. Sodium and Water Retention (Renal Retention)

Mechanism: When the kidneys retain excess sodium (and water follows osmotically), the intravascular volume expands. This drives up capillary hydrostatic pressure AND dilutes plasma proteins, lowering osmotic pressure. Both forces push fluid into tissues.
Causes and Examples:
a) Renal Failure Damaged kidneys cannot excrete sodium normally. Fluid accumulates throughout the body.
Example: A patient with end-stage kidney disease on missed dialysis develops pulmonary edema over 2 days. His lungs fill with fluid not because his heart failed but because sodium and water have nowhere to go.
b) Primary Hyperaldosteronism (Conn's Syndrome) Excess aldosterone drives the collecting duct to retain maximum sodium.
c) Cushing's Syndrome / Corticosteroid Use Glucocorticoids have mineralocorticoid activity and cause sodium retention.
Example: A patient on high-dose prednisone for lupus develops a "moon face" and leg swelling - steroid-induced sodium retention and edema.
d) Pregnancy Progesterone-induced sodium retention, combined with the expanding uterus compressing the inferior vena cava (increasing hydrostatic pressure), makes ankle edema extremely common in the third trimester.

6. Idiopathic Edema

A syndrome, mainly in women of reproductive age (20-30 years), characterized by cyclic salt retention and edema with no identifiable structural cause. Some studies link it to intermittent diuretic abuse.
Katzung Pharmacology: "Idiopathic edema (fluctuating salt retention and edema) is a syndrome found most often in 20- to 30-year-old women. Despite intensive study, the pathophysiology remains obscure."

Special Types of Edema by Organ

Pulmonary Edema

The lungs are a critical target because the alveoli must remain air-filled for gas exchange.
Normal pulmonary capillary pressure: ~7 mmHg. Significant edema appears when pressure exceeds ~25-28 mmHg (the plasma colloid osmotic pressure) - this is the "safety factor."
Guyton and Hall Medical Physiology, p. 509: "In patients with chronic mitral stenosis, pulmonary capillary pressures of 40 to 45 mmHg have been measured without the development of lethal pulmonary edema" - because chronically elevated pressure causes lymphatics to expand 10-fold.
Guyton and Hall: "In acute left-sided heart failure, in which pulmonary capillary pressure occasionally does rise to 50 mmHg, death may ensue in less than 30 minutes as a result of acute pulmonary edema."
Two types:
CardiogenicNon-Cardiogenic (ARDS)
MechanismIncreased hydrostatic pressureIncreased permeability
Fluid typeTransudateExudate
Protein contentLowHigh
CauseLeft heart failure, mitral stenosisSepsis, aspiration, burns
PCWP>18 mmHgNormal (<18 mmHg)
Example: A patient with acute MI develops flash pulmonary edema. The left ventricle suddenly fails, blood backs up into pulmonary veins, pulmonary capillary pressure spikes above 28 mmHg, and fluid floods the alveoli. He cannot breathe. Sitting him upright (reduces venous return), giving furosemide (removes fluid), and supplemental oxygen are the immediate steps.

Cerebral Edema

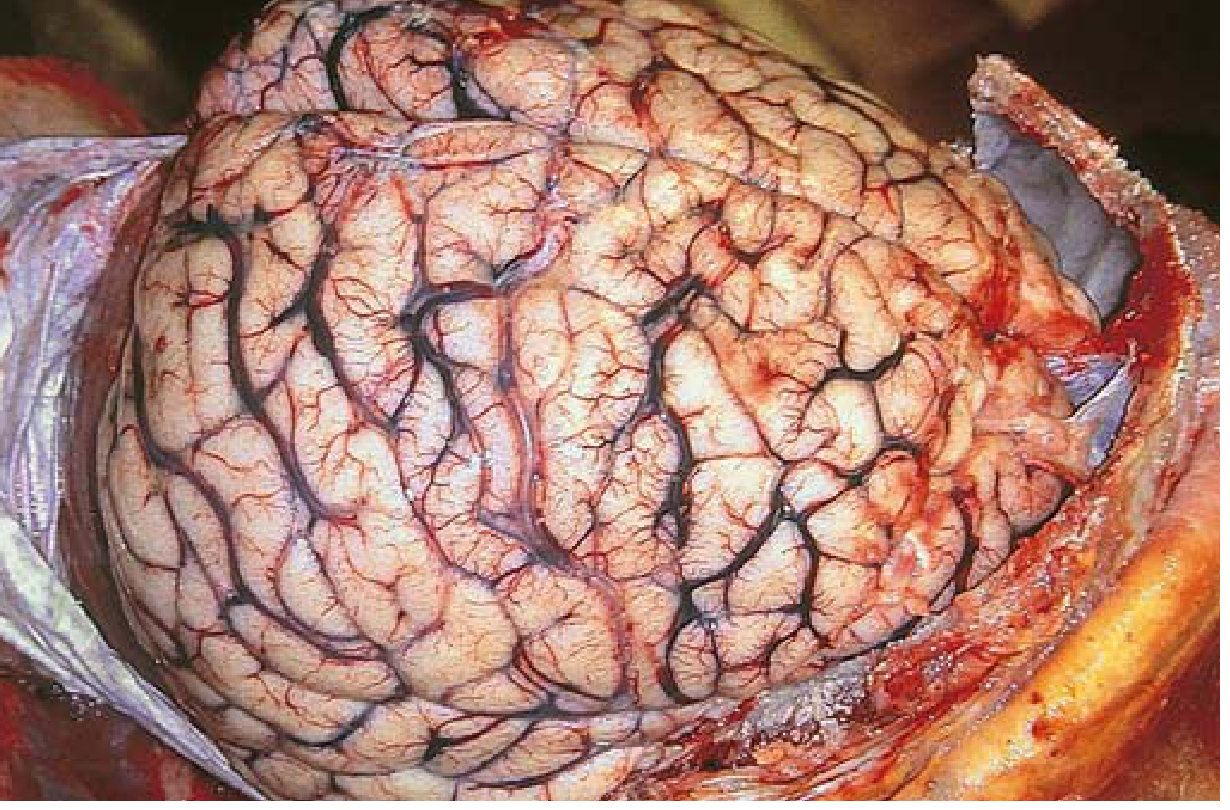
Cerebral edema: brain with flattened gyri pressed against skull from swelling
FIG. 21.2 from Robbins - Cerebral edema: flattened gyri and narrowed sulci as the swollen brain is compressed against the rigid skull
The skull is a rigid box. Any swelling inside it raises intracranial pressure (ICP), which can be fatal.
Two Subtypes:
a) Vasogenic Edema
  • Blood-brain barrier (BBB) is disrupted
  • Plasma proteins leak into the extracellular space of the brain
  • Fluid follows the protein into white matter
  • Causes: Brain tumors, abscesses, meningitis, head trauma, high-altitude cerebral edema (HACE)
  • MRI shows hyperintensity spreading through white matter
Example: A patient with a brain metastasis from lung cancer has headache and papilledema. The tumor secretes VEGF (vascular endothelial growth factor), which disrupts the BBB. Protein-rich fluid leaks into the surrounding white matter. Dexamethasone (steroid) reduces BBB permeability and is the emergency treatment.
b) Cytotoxic Edema
  • BBB is intact
  • Cells themselves swell due to failure of the Na⁺/K⁺ ATPase pump
  • Neurons and glia take up water intracellularly
  • Causes: Global ischemia, hypoxia, water intoxication, toxins
  • Involves gray and white matter
Robbins, p. 821: "Cytotoxic edema is an increase in intracellular fluid secondary to neuronal and glial cell injury, as might follow a generalized hypoxic or ischemic insult."
Example: After cardiac arrest and 5 minutes of no blood flow to the brain, neurons start swelling within minutes as ATP is depleted and the sodium pump fails. Water pours into cells. This is cytotoxic edema - the cells themselves become the edematous compartment.
c) Interstitial (Hydrocephalic) Edema
  • CSF pressure rises and cerebrospinal fluid transudes across the ependymal lining into periventricular white matter
  • Cause: Obstructive or communicating hydrocephalus
Clinical danger of cerebral edema: The swollen brain herniates through the foramen magnum ("coning"), compressing the brainstem. This disrupts the respiratory and cardiovascular centers - death follows within minutes if uncorrected.

Subcutaneous Edema

Dependent edema: Gravity drives fluid to the lowest parts.
  • Standing patient → fluid pools in ankles and lower legs
  • Bedridden patient → fluid pools in the sacrum and buttocks
Robbins, p. 80: "Edema is most pronounced in the legs with standing and the sacrum with recumbency, a relationship termed dependent edema."

Summary Table: All Major Edema Categories

CategoryFluid TypeMechanismProtein ContentClassic Example
Increased hydrostatic pressureTransudateVenous backpressureLowBilateral ankle edema in heart failure
HypoalbuminemiaTransudateLow osmotic pullLowPeriorbital edema in nephrotic syndrome
Increased permeabilityExudateLeaky capillary wallsHighSwollen sprained ankle; ARDS
Lymphatic obstructionProtein-richFailed lymph drainageHighElephantiasis; post-mastectomy arm swelling
Sodium/water retentionTransudateVolume overloadLowEdema in renal failure
IdiopathicMixedUnknownVariableCyclic edema in young women
Cerebral - vasogenicExudateBBB breakdownHighPeritumoral brain edema
Cerebral - cytotoxicIntracellularNa pump failureN/APost-cardiac arrest brain swelling

The Clinical Approach to Edema

Harrison's Principles of Internal Medicine 22E: "An important first question is whether the edema is localized or generalized. If generalized, one should determine if there is serious hypoalbuminemia (serum albumin <3.0 g/dL)... If hypoalbuminemia is not present, one should determine if there is evidence of heart failure severe enough to promote generalized edema."
Step-by-step clinical reasoning:
  1. Localized or generalized?
    • Localized → DVT, lymphedema, local inflammation
    • Generalized → think systemic disease
  2. Pitting or non-pitting?
    • Pitting → heart failure, renal, hepatic, hypoalbuminemia
    • Non-pitting → lymphedema, myxedema
  3. Check albumin:
    • Low albumin (<3.0 g/dL) → nephrotic syndrome, cirrhosis, malnutrition
  4. Check cardiac function:
    • Signs of heart failure? (elevated JVP, S3 gallop, basal crackles)
  5. Check renal function:
    • Oliguria, high creatinine? → renal failure

Sources

  • Robbins & Kumar Basic Pathology, pp. 78-81 (Chapter 3: Hemodynamic Disorders)
  • Robbins, Cotran & Kumar Pathologic Basis of Disease, pp. 43-54
  • Guyton and Hall Textbook of Medical Physiology, pp. 507-511 (Pulmonary Edema)
  • Harrison's Principles of Internal Medicine 22E, p. 326 (Approach to Edema)
  • Katzung's Basic and Clinical Pharmacology, 16th Edition (Edematous States, Idiopathic Edema)
This is a shared conversation. Sign in to Orris to start your own chat.