from Guyton and Hall textbook of medical physiology, 4th South Asia edition write a 5 mark short note on arrhythmia

Reading File
Finding Sources
Finding Sources
Finding Sources
Finding Sources
Finding Sources
Finding Sources
Finding Sources
Reading File
Reading File
Reading File
Reading File
Reading File
Searching Images

cardiac arrhythmia ECG types atrial fibrillation ventricular tachycardia
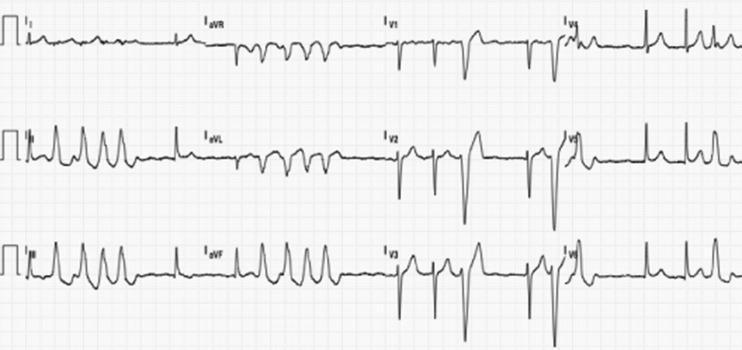
A multi-lead diagnostic electrocardiogram (ECG) rhythm strip illustrating complex cardiac arrhythmias. The baseline rhythm shows atrial fibrillation, characterized by an irregularly irregular ventricular rate and the absence of discernible, consistent P waves. Superimposed on this baseline is a run of nonsustained ventricular tachycardia (NSVT). The wide-complex tachycardia morphology demonstrates a left bundle branch block (LBBB) pattern, evident by the predominantly negative QRS deflection in leads V1 through V3 and a late QRS transition occurring around lead V4. The inferior leads (II, III, and aVF) show a positive QRS axis, indicating an inferior axis. These visual findings—LBBB morphology with an inferior axis and late transition—are clinically suggestive of an arrhythmia originating from the right ventricular outflow tract (RVOT). The T waves exhibit secondary repolarization changes, including inversions in leads with positive QRS complexes. This ECG serves as an educational example of identifying ventricular tachycardia origin sites based on QRS morphology and axis transition in the precordial leads.
A multi-lead diagnostic electrocardiogram (ECG) rhythm strip illustrating complex cardiac arrhythmias. The baseline rhythm shows atrial fibrillation, characterized by an irregularly irregular ventricular rate and the absence of discernible, consistent P waves. Superimposed on this baseline is a run of nonsustained ventricular tachycardia (NSVT). The wide-complex tachycardia morphology demonstrates a left bundle branch block (LBBB) pattern, evident by the predominantly negative QRS deflection in leads V1 through V3 and a late QRS transition occurring around lead V4. The inferior leads (II, III, and aVF) show a positive QRS axis, indicating an inferior axis. These visual findings—LBBB morphology with an inferior axis and late transition—are clinically suggestive of an arrhythmia originating from the right ventricular outflow tract (RVOT). The T waves exhibit secondary repolarization changes, including inversions in leads with positive QRS complexes. This ECG serves as an educational example of identifying ventricular tachycardia origin sites based on QRS morphology and axis transition in the precordial leads.

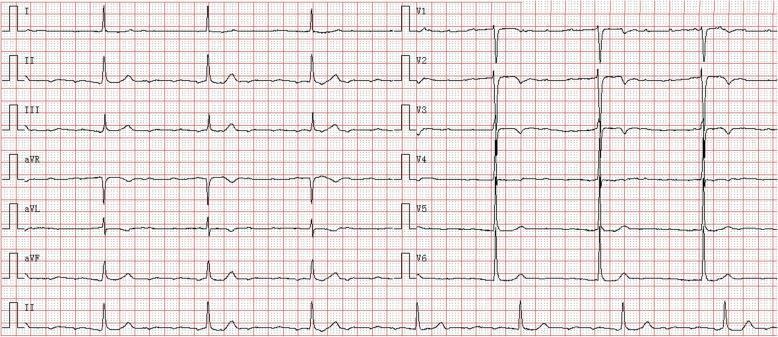
A 12-lead baseline electrocardiogram (ECG) recorded at 25 mm/s and 10 mm/mV, demonstrating complex cardiac conduction abnormalities. The tracing shows a rapid, irregular atrial arrhythmia, likely atrial fibrillation or high-frequency atrial tachycardia, with an atrial rate of approximately 180 beats per minute. Distinct P waves are absent, replaced by fibrillatory waves visible in the baseline, particularly in lead V1. Concurrent with this is a complete (third-degree) atrioventricular (AV) block, evidenced by the total dissociation between atrial activity and ventricular response. The ventricles are driven by a junctional escape rhythm, resulting in a slow, regular ventricular rate of approximately 43 beats per minute. The QRS complexes are relatively narrow (approximately 90 ms), consistent with a supra-Hisian escape focus. The tracing includes limb leads (I, II, III, aVR, aVL, aVF) and precordial leads (V1-V6), with a continuous lead II rhythm strip at the bottom. This visual record is characteristic of advanced conduction system disease, often associated with LMNA-related cardiomyopathies or other structural heart diseases.
A 12-lead baseline electrocardiogram (ECG) recorded at 25 mm/s and 10 mm/mV, demonstrating complex cardiac conduction abnormalities. The tracing shows a rapid, irregular atrial arrhythmia, likely atrial fibrillation or high-frequency atrial tachycardia, with an atrial rate of approximately 180 beats per minute. Distinct P waves are absent, replaced by fibrillatory waves visible in the baseline, particularly in lead V1. Concurrent with this is a complete (third-degree) atrioventricular (AV) block, evidenced by the total dissociation between atrial activity and ventricular response. The ventricles are driven by a junctional escape rhythm, resulting in a slow, regular ventricular rate of approximately 43 beats per minute. The QRS complexes are relatively narrow (approximately 90 ms), consistent with a supra-Hisian escape focus. The tracing includes limb leads (I, II, III, aVR, aVL, aVF) and precordial leads (V1-V6), with a continuous lead II rhythm strip at the bottom. This visual record is characteristic of advanced conduction system disease, often associated with LMNA-related cardiomyopathies or other structural heart diseases.

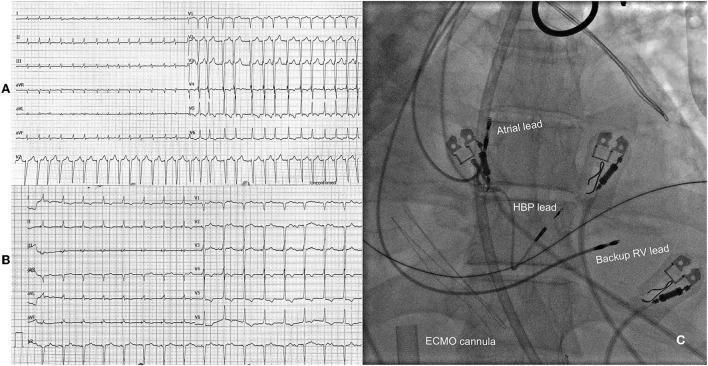
This composite educational image illustrates the management of refractory tachycardia-induced cardiomyopathy. Panel A presents a 12-lead electrocardiogram (ECG) showing atrial fibrillation with a rapid ventricular response (tachyarrhythmia). The tracing is characterized by absent P waves, irregular R-R intervals, and narrow QRS complexes at a rate of approximately 175 bpm. Panel B displays a follow-up ECG after an 'ablate and pace' intervention, specifically showing a more controlled rhythm resulting from atrioventricular (AV) node ablation and subsequent His bundle pacing (HBP). Panel C is a fluoroscopic angiogram in a post-procedural state, depicting the anatomical placement of cardiac pacing leads. Key landmarks include the atrial lead positioned superiorly, the HBP lead situated in the region of the His bundle, and a backup right ventricular (RV) lead. A large, radiopaque extracorporeal membrane oxygenation (ECMO) cannula is visible in the background, crossing the cardiac silhouette. This content demonstrates advanced electrophysiological strategies and mechanical circulatory support in the context of cardiogenic shock and refractory arrhythmia.

This composite educational image illustrates the management of refractory tachycardia-induced cardiomyopathy. Panel A presents a 12-lead electrocardiogram (ECG) showing atrial fibrillation with a rapid ventricular response (tachyarrhythmia). The tracing is characterized by absent P waves, irregular R-R intervals, and narrow QRS complexes at a rate of approximately 175 bpm. Panel B displays a follow-up ECG after an 'ablate and pace' intervention, specifically showing a more controlled rhythm resulting from atrioventricular (AV) node ablation and subsequent His bundle pacing (HBP). Panel C is a fluoroscopic angiogram in a post-procedural state, depicting the anatomical placement of cardiac pacing leads. Key landmarks include the atrial lead positioned superiorly, the HBP lead situated in the region of the His bundle, and a backup right ventricular (RV) lead. A large, radiopaque extracorporeal membrane oxygenation (ECMO) cannula is visible in the background, crossing the cardiac silhouette. This content demonstrates advanced electrophysiological strategies and mechanical circulatory support in the context of cardiogenic shock and refractory arrhythmia.

I have all the content I need. Let me now compose a comprehensive 5-mark short note on arrhythmia from Guyton and Hall.

Short Note on Arrhythmia

(Guyton and Hall Textbook of Medical Physiology, 4th South Asia Edition — Chapter 13)

Definition

Arrhythmia refers to any abnormality in the rate, rhythm, or sequence of cardiac impulse formation and conduction. Normal sinus rhythm in an adult is 60-100 beats/min; deviations from this pattern, or disruptions in conduction pathways, constitute arrhythmias.

Classification and Types

1. Tachycardia

Heart rate >100 beats/min in an adult. Causes include increased body temperature (rate rises ~10 beats/min per °F rise), sympathetic stimulation, blood loss, anemia, and myocardial weakness. The sinus node fires more rapidly due to increased metabolic rate or sympathetic drive.

2. Bradycardia

Heart rate <60 beats/min. Seen physiologically in trained athletes (due to large stroke volume causing vagal reflexes and downregulation of "funny" current ion channels). Pathologically, intense vagal stimulation from carotid sinus syndrome can stop the heart for 5-10 seconds and cause syncope.

3. Sinus Arrhythmia

A normal variation in which the heart rate fluctuates with the respiratory cycle - increasing during inspiration and decreasing during expiration. During deep breathing, the rate may vary by up to 30%. It results from alternating changes in sympathetic and parasympathetic tone to the sinus node during respiration.

4. Paroxysmal Tachycardia

Sudden episodes of rapid heart rhythm caused most often by reentrant circus movement in the atria, AV node, or ventricles. The paroxysm begins and ends abruptly. Paroxysmal atrial tachycardia can be terminated by vagal maneuvers (carotid sinus massage, Valsalva maneuver) or antiarrhythmic drugs that slow conduction or prolong the refractory period.

5. Ventricular Fibrillation

The most serious arrhythmia - almost invariably fatal if not stopped within 1-3 minutes. Disorganized, chaotic electrical activity causes multiple small portions of ventricular muscle to contract and relax asynchronously, so no coordinated pumping occurs. Unconsciousness follows within 4-5 seconds; irreversible tissue death begins within minutes. Triggered by electrical shock, myocardial ischemia, or ischemia of the conducting system.

6. Atrial Fibrillation

Chaotic, disorganized atrial electrical activity due to multiple simultaneous circus movements in the atria. Commonly caused by atrial dilation (from valve lesions or ventricular failure). Atria become ineffective as primer pumps, reducing cardiac efficiency by only 20-30%, so patients survive for years - unlike ventricular fibrillation. However, blood stagnation (especially in the left atrial appendage) predisposes to clot formation, with risk of stroke or systemic embolism. Treatment includes anticoagulants; high bleeding-risk patients may undergo left atrial appendage occlusion.

Mechanism: Circus Reentry

A key mechanism underlying many arrhythmias. After an impulse travels through the heart, it normally dies because all muscle is refractory. Reentry (circus movement) persists when:
  1. The conduction pathway is abnormally long (e.g., dilated heart)
  2. Conduction velocity is reduced (so the impulse returns after the refractory period ends)
  3. The refractory period is shortened (allowing premature re-excitation)
These conditions occur in dilated cardiomyopathy, ischemia, electrolyte disturbances, and drug toxicity.

ECG Features of Key Arrhythmias

ArrhythmiaECG Features
Sinus tachycardiaNormal P-QRS-T, rate >100 bpm
Sinus bradycardiaNormal P-QRS-T, rate <60 bpm
Paroxysmal atrial tachycardiaInverted P waves, rate ~150 bpm, abrupt onset
Ventricular fibrillationTotally irregular, bizarre waveforms; no identifiable P, QRS, or T
Atrial fibrillationAbsent P waves, fibrillatory baseline, irregularly irregular QRS

Clinical ECG image (atrial fibrillation with NSVT):

ECG showing atrial fibrillation with nonsustained ventricular tachycardia

Summary

Arrhythmias range from benign (sinus arrhythmia) to immediately life-threatening (ventricular fibrillation). The underlying mechanisms include abnormal automaticity, triggered activity, and circus reentry. Diagnosis relies on the ECG; management ranges from vagal maneuvers and antiarrhythmics to defibrillation for ventricular fibrillation.
(Guyton and Hall Textbook of Medical Physiology, Chapter 13 - Cardiac Arrhythmias and Their Electrocardiographic Interpretation)
This is a shared conversation. Sign in to Orris to start your own chat.