
Pre allantoic parts of hind gut
hindgut development allantois cloaca pre-allantoic parts diagram embryology
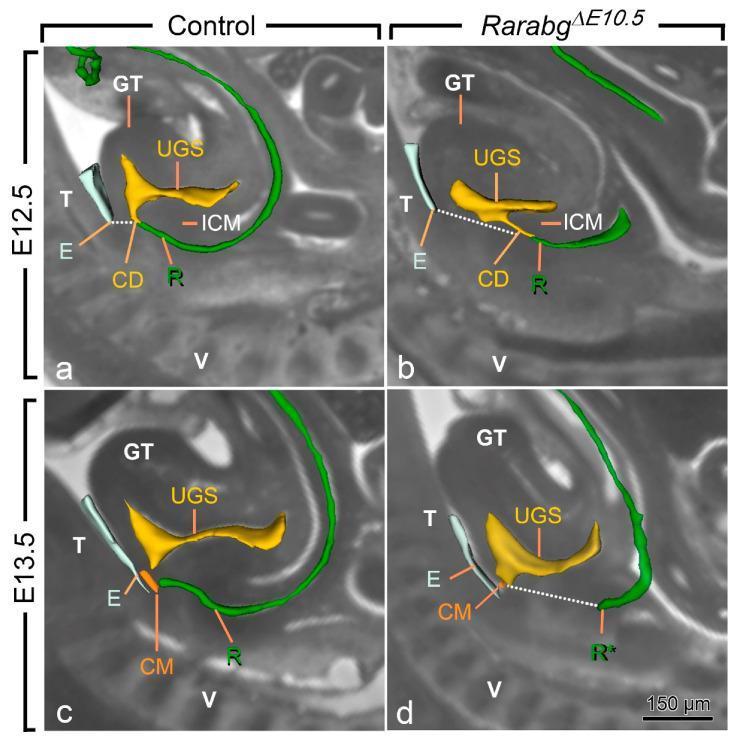
This comparative anatomical diagram utilizes sagittal High-Resolution Episcopic Microscopy (HREM) sections to illustrate the development of the cloaca in control and RarabgΔE10.5 mutant mouse embryos at developmental stages E12.5 and E13.5. The images emphasize the pathophysiology of anorectal malformations (ARM). Key anatomical labels include the urogenital sinus (UGS, yellow), rectum (R, green), cloacal duct (CD), and intra-cloacal mesenchyme (ICM). In control embryos (a, c), the UGS and rectum successfully separate and migrate toward the surface ectoderm. In mutant embryos (b, d), the UGS lumen is noticeably reduced at E12.5, and the ICM is hypoplastic. By E13.5, the mutant rectum (R*) fails to reach the ectodermal groove (E) and terminates blindly, separated from the surface by a thickened mesenchymal layer (indicated by dotted lines), while the UGS still communicates with the amniotic cavity at the cloacal membrane (CM). These findings demonstrate developmental arrest in cloacal septation and migration, providing a model for human anorectal agenesis.
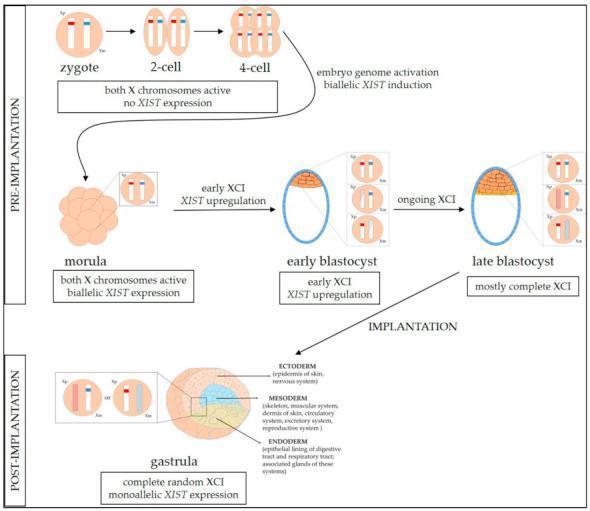
This embryology diagram illustrates the process of X chromosome inactivation (XCI) in a human female embryo from the pre-implantation stages to post-implantation gastrulation. The timeline begins with the zygote, progressing through 2-cell, 4-cell, and morula stages, where both the maternal (Xm) and paternal (Xp) X chromosomes are active and biallelic XIST expression begins. The transition to early and late blastocysts shows the initiation of random XCI, visualized by red or blue shading on one of the X chromosome representations to signify dampening or silencing. After implantation, the diagram depicts the gastrula stage where complete random XCI and monoallelic XIST expression are established. The gastrula is color-coded to show the three primary germ layers: ectoderm (epidermis, nervous system), mesoderm (skeletal, muscular, circulatory systems), and endoderm (epithelial lining of digestive and respiratory tracts). The illustration serves as an educational model for epigenetic dosage compensation and lineage-specific XCI maintenance during early human development.
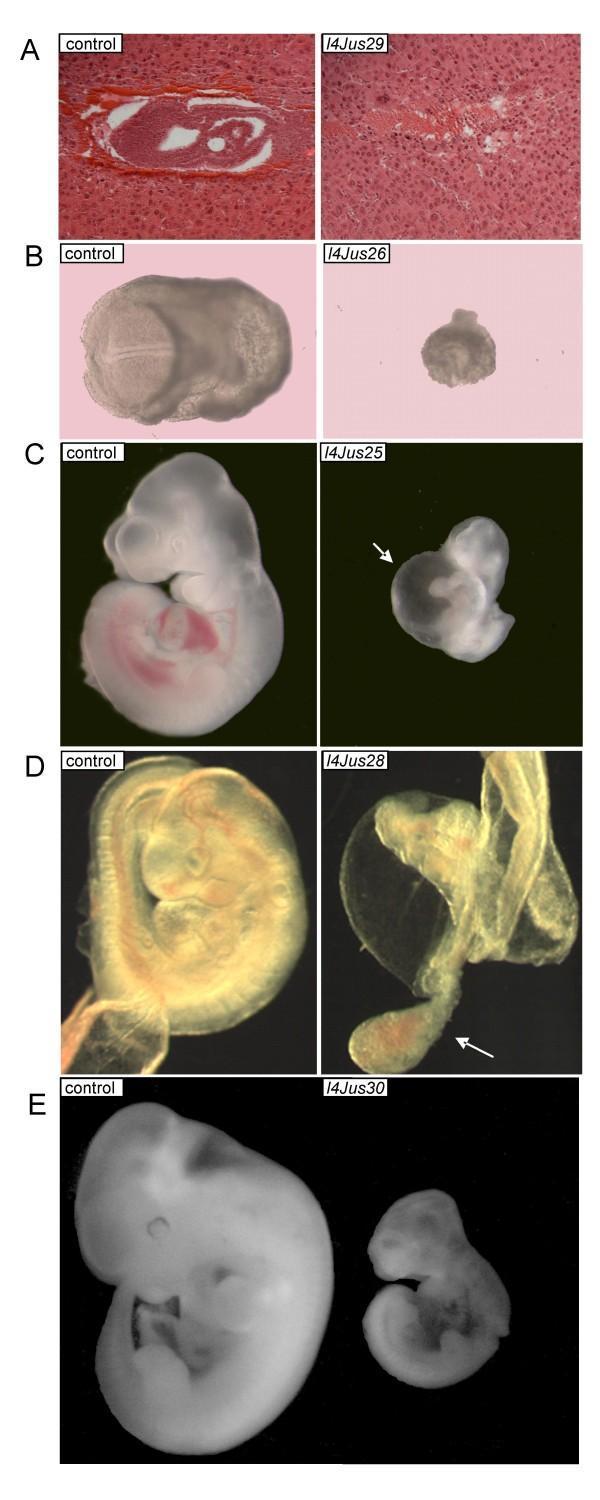
This composite educational image illustrates the phenotypic manifestations of various lethal mutations on mouse chromosome 4 (117–281) across different embryonic (E) stages. The image follows a side-by-side comparison format, with control littermates on the left and homozygous mutant embryos on the right. Panel A presents Hematoxylin and Eosin (H&E) stained histological sections at E7.5, where the l4Jus29 mutant demonstrates a failure of gastrulation. Panel B (E8.5, l4Jus26) and Panel E (E11.5, l4Jus30) show significant growth restriction and developmental delay in mutants compared to controls. Panel C (E10.5, l4Jus25) highlights cardiovascular pathology, specifically pericardial edema indicated by a white arrow. Panel D (E9.5, l4Jus28) shows a failure of embryonic turning and a defect in chorio-allantoic fusion, with a white arrow identifying the unfused allantois. This visual resource is used to teach developmental genetics, embryology, and the impact of specific chromosomal loci on organogenesis and viability.
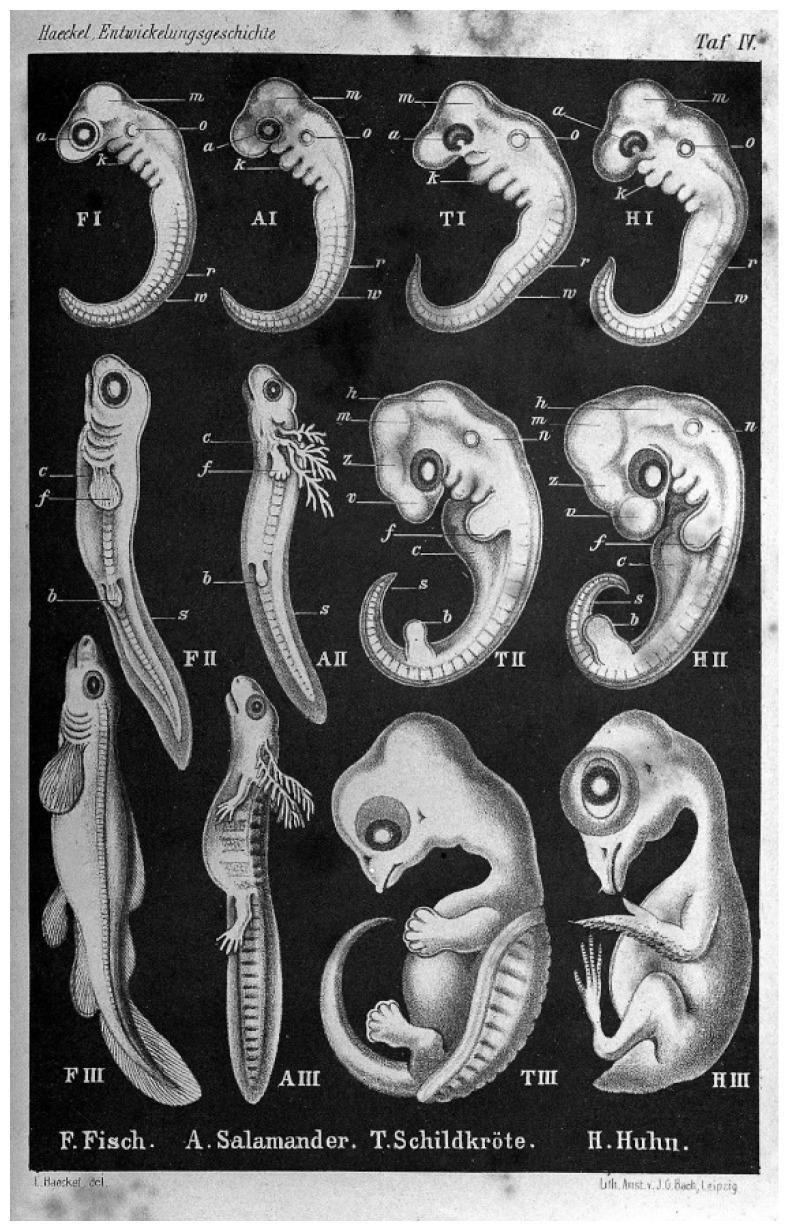
This historical comparative embryology diagram, originally by Ernst Haeckel, illustrates the developmental stages of four different vertebrate species: fish (F), salamander (A), turtle (T), and chicken (H). The visual is organized into three horizontal rows representing chronological stages of embryonic development (I, II, and III). The first row (top) demonstrates the concept of generative entrenchment, highlighting striking morphological similarities between the pharyngula stages of distal vertebrate classes. Key shared features include a curved body plan, prominent cephalic regions with developing eye structures, branchial arches (gill slits), and segmented somites along the dorsal-ventral axis. The subsequent rows (middle and bottom) depict progressive morphological divergence as species-specific traits emerge. The final stage (bottom row) clearly distinguishes the mature embryonic forms: the fish (FIII) with fins, the salamander (AIII) with external gills and limbs, the turtle (TIII) with a developing carapace and limbs, and the bird (HIII) with a distinct beak and avian limb structure. This illustration serves as a foundational educational resource for understanding comparative vertebrate anatomy, evolutionary biology, and the historical 'ontogeny recapitulates phylogeny' hypothesis.
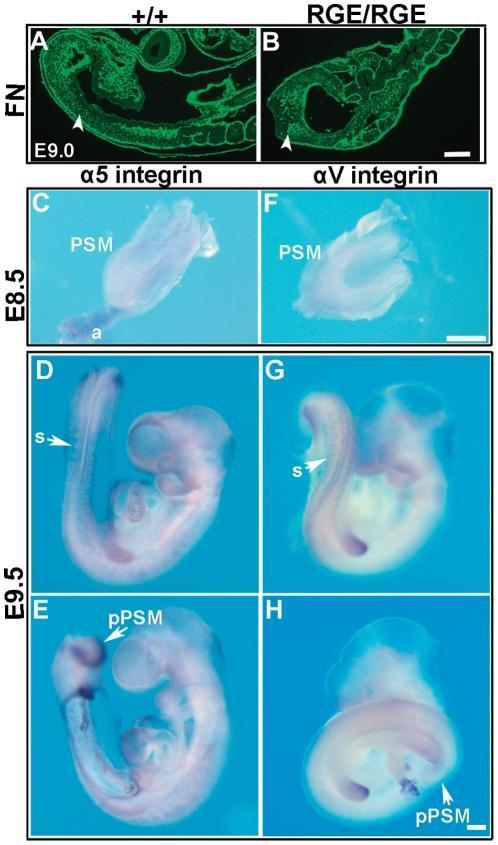
Educational panel of mouse embryology images demonstrating the expression of fibronectin (FN) and integrins during development. (A-B) Immunofluorescence images show FN expression at E9.0. In the wild-type (+/+), FN forms a dense network throughout the embryo, while in the mutant (RGE/RGE), the embryo is shortened with irregular somites despite similar FN intensity. (C-H) Whole-mount in situ hybridization images compare α5 and αv integrin mRNA expression across developmental stages E8.5 and E9.5. At E8.5, both integrins show weak, diffuse expression in the presomitic mesoderm (PSM) and allantois (a). By E9.5, α5 integrin (D, E) is strongly expressed in the posterior PSM (pPSM) and surrounding epithelial somites (s). In contrast, αv integrin (G, H) is localized around somites but specifically absent from the posterior PSM. The panel illustrates the spatiotemporal regulation of extracellular matrix components and their receptors during mesoderm segmentation and body axis elongation.
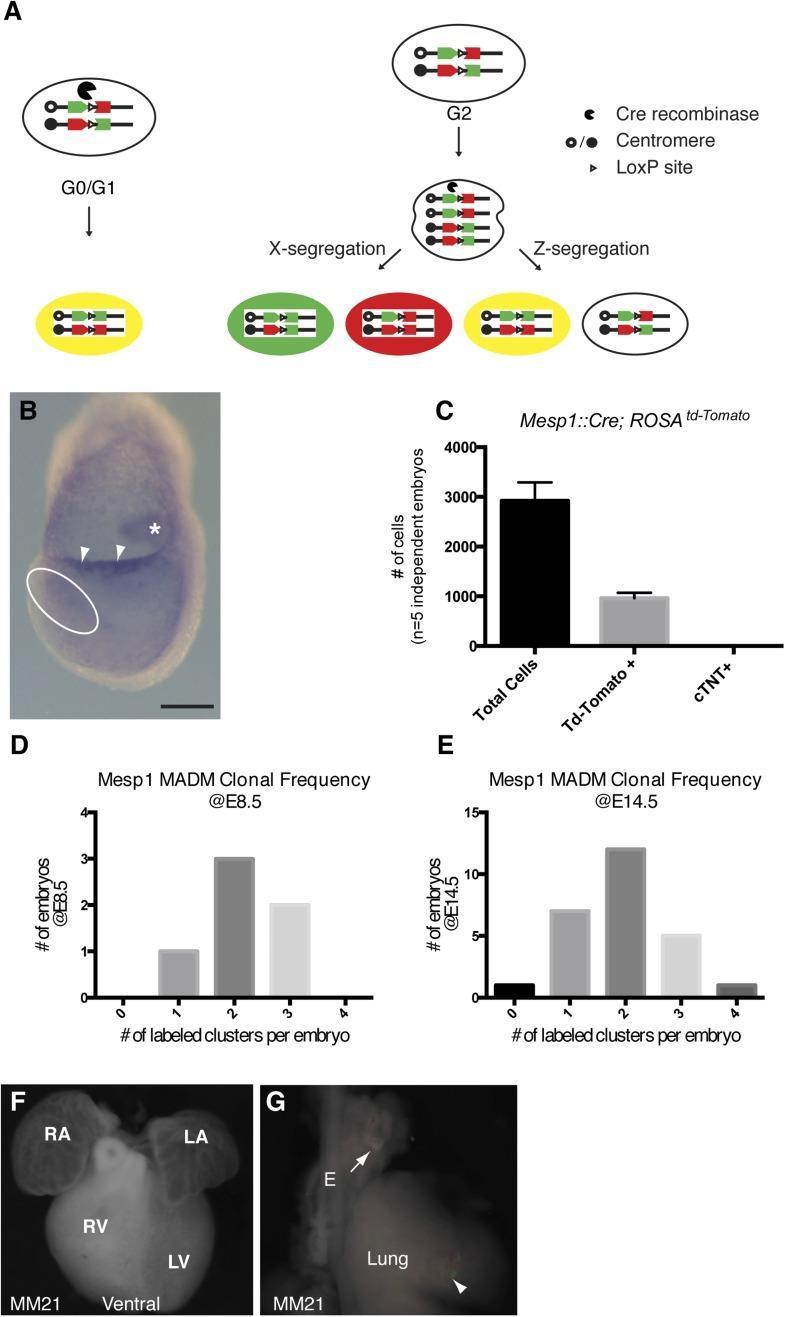
This composite educational image illustrates Mesp1Cre-mediated Mosaic Analysis with Double Markers (MADM) for studying cardiac lineage specification during embryogenesis. Panel A presents a molecular biology diagram of the MADM system, showing how Cre-mediated interchromosomal recombination at LoxP sites during different cell cycle phases (G0/G1 or G2) leads to X-segregation (generating distinct red and green twin spots) or Z-segregation (generating colorless or yellow cells). Panel B shows a whole-mount in situ hybridization of a mouse embryo at the late head fold stage (LHF). Dark staining indicates Cre mRNA expression in the allantois (asterisk) and allantoic membrane (arrowheads), while expression is absent in the cardiogenic mesoderm (dotted circle). Panel C is a bar graph of FACS analysis quantifying cells in Mesp1Cre;RosaTdTomato embryos, showing that approximately one-third of total embryonic cells are Mesp1-derived. Panels D and E are histograms comparing MADM clonal frequency at E8.5 and E14.5, demonstrating a stable distribution of labeled clusters over time. Panels F and G provide fluorescent micrographs of an E14.5 embryo heart (F: showing RA, LA, RV, LV) and lung/esophagus (G), used for spatial mapping of these early progenitors in mature mesodermal organs.
Pre-Allantoic Parts of the Hindgut
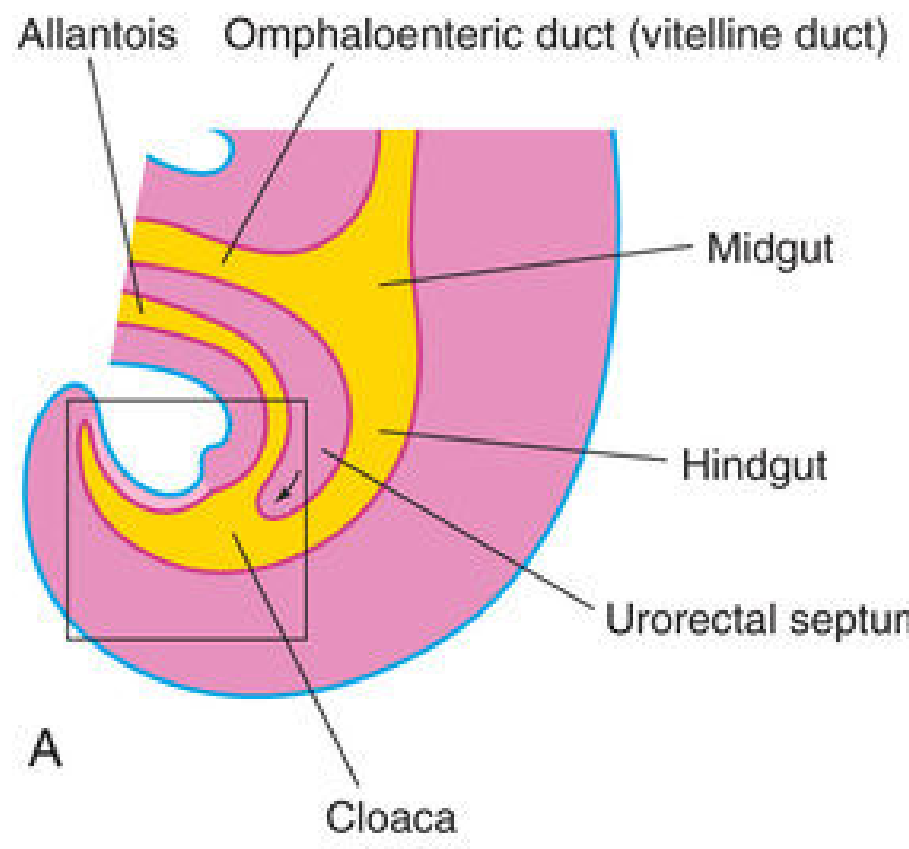
Division of the Hindgut Relative to the Allantois
| Part | Landmark | Adult Derivatives |
|---|---|---|
| Pre-allantoic | Cranial to the allantois origin | Descending colon, sigmoid colon, rectum, upper anal canal |
| Allantoic (cloaca) | Terminal dilation of hindgut where allantois joins | Divides into urogenital sinus (anterior) and anorectal canal (posterior) |
| Post-allantoic | Caudal tail gut beyond the cloaca | Degenerates and disappears |
Pre-Allantoic Parts in Detail
- Left one-third to one-half of the transverse colon - the junction with midgut-derived bowel is marked by the change in blood supply (superior mesenteric artery → inferior mesenteric artery)
- Descending colon - swings to the left; its mesentery fuses with parietal peritoneum making it retroperitoneal
- Sigmoid colon - retains its mesentery (sigmoid mesocolon); passes through the pelvic inlet
- Rectum - continuous with the sigmoid at the level of vertebra S3
- Superior two-thirds of the anal canal - derived from the hindgut endoderm, supplied by the superior rectal artery (continuation of the inferior mesenteric artery)
What Happens at the Allantoic Junction (The Cloaca)
- Anterior part (urogenital sinus) - receives the allantois; forms the bladder and urethra
- Posterior part (anorectal canal) - hindgut continuation; forms the inferior rectum and upper anal canal
Key Takeaway
Pre-allantoic hindgut = left transverse colon + descending colon + sigmoid colon + rectum + upper 2/3 of anal canal