
ECG from basics to advance in detail
Reading File
Now let me search the medical library for comprehensive ECG content, running multiple parallel searches.
Finding Sources
Finding Sources
Searching the Web
ECG interpretation basics to advanced complete guide 2024
Good - I found key textbook sources. Let me now read the most relevant ECG sections in parallel from Miller's Anesthesia and Fuster's Heart, plus search for more ECG-specific content.
Reading File
Finding Sources
Finding Sources
Excellent - found a Medical Physiology section on ECG interpretation. Let me read it and also search for more advanced content.
Reading File
Finding Sources
Finding Sources
Good data. Let me read several more key sections and fetch important ECG images.
Reading File
Reading File
Loading Image
Excellent - got the cardiac cycle diagram. Now let me fetch the STEMI ECG images and read more content on arrhythmias and advanced topics.
Loading Image
Loading Image
Finding Sources
Now let me read key sections on arrhythmias and advanced ECG topics from Harrison's and Goldman-Cecil.
Reading File
Finding Sources
Finding Sources
I now have comprehensive content from multiple authoritative textbooks. Let me compile the full, detailed ECG guide.
ECG: From Basics to Advanced - A Complete Guide
Sources: Medical Physiology (Boron & Boulpaep), Miller's Anesthesia 10e, Fuster & Hurst's The Heart 15e, Harrison's Principles of Internal Medicine 22e, Goldman-Cecil Medicine, Rosen's Emergency Medicine, Tintinalli's Emergency Medicine, Katzung's Pharmacology
PART 1 - FUNDAMENTALS
What Is an ECG?
The electrocardiogram (ECG/EKG) is a graphical recording of the electrical activity generated by the heart, detected at the body surface. It provides direct measurement of rate, rhythm, and the time-dependent electrical vector of the heart, and gives fundamental information about the origin and conduction of cardiac action potentials.
- Medical Physiology, p. 731
The Cardiac Conduction System
Understanding the ECG starts with understanding what generates its signals:
| Structure | Function | ECG Representation |
|---|---|---|
| SA (Sinoatrial) node | Primary pacemaker; initiates impulse | Beginning of P wave |
| Atria | Depolarize after SA node fires | P wave |
| AV (Atrioventricular) node | Slows conduction intentionally | PR interval delay |
| His bundle | Bridges AV node to ventricles | Part of PR interval |
| Left & right bundle branches | Rapid conduction to both ventricles | QRS complex |
| Purkinje fibers | Spread depolarization to myocardium | QRS complex |
| Ventricular myocardium | Contracts during systole | QRS + ST segment |
| Repolarization | Electrical recovery of ventricles | T wave |
The AV node is an area of relatively slow conduction, creating a physiologic delay between atrial and ventricular contraction. This is why the PR interval exists.
- Miller's Anesthesia 10e, p. 1364
The Cardiac Cycle and ECG Correlation
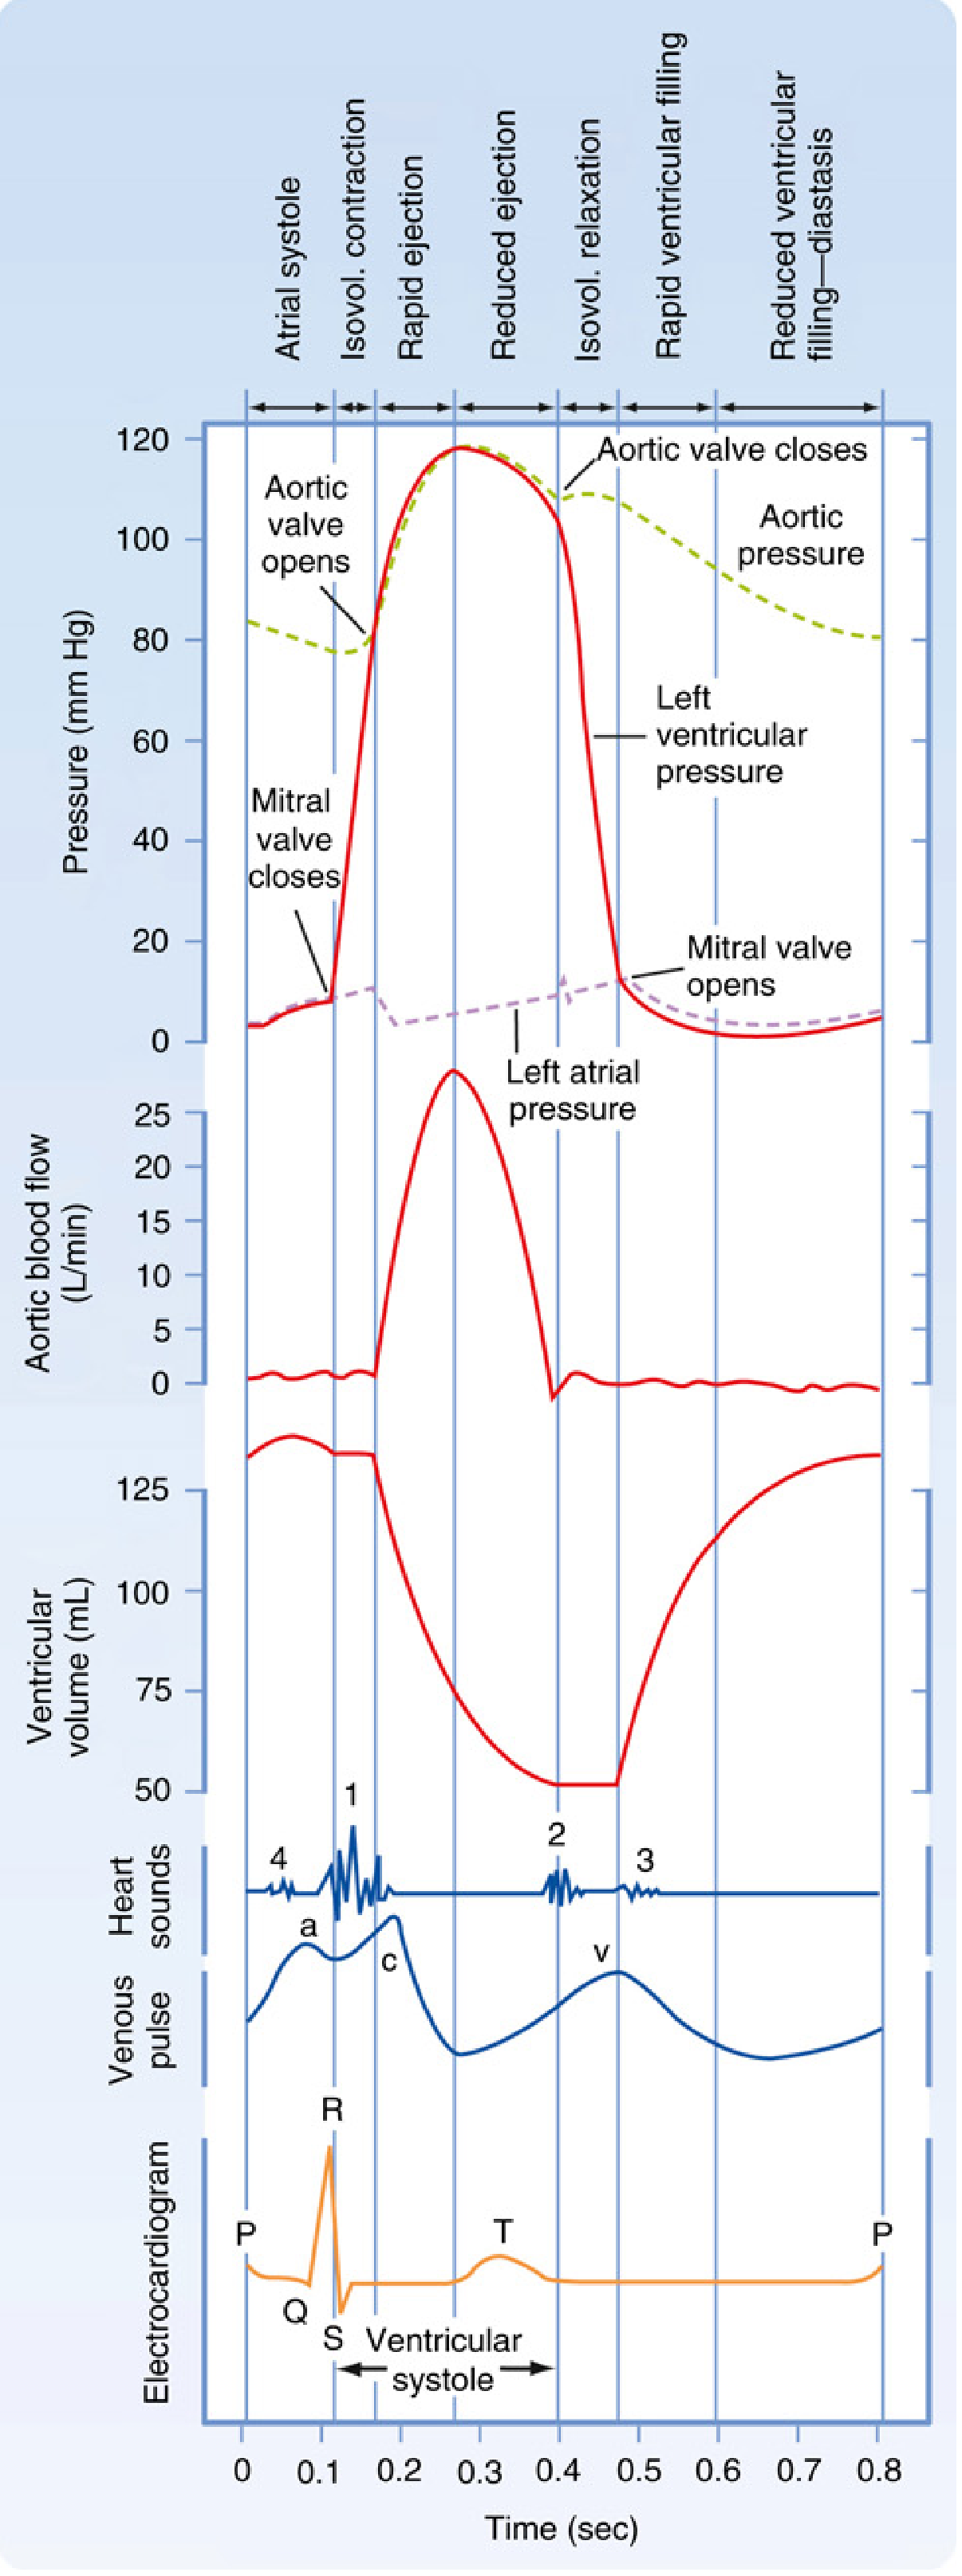
Fig. 13.1 from Miller's Anesthesia - Electrical and mechanical events during a single cardiac cycle.
- P wave - Atrial depolarization; onset of atrial systole coincides with SA node firing
- PR interval - Conduction delay through AV node; onset of P wave to start of QRS
- QRS complex - Ventricular depolarization; mitral valve closes at end of R wave
- ST segment - Plateau phase of ventricular action potential (isoelectric in normal)
- T wave - Ventricular repolarization
- QT interval - Total ventricular depolarization + repolarization time; shortens as heart rate increases
PART 2 - ECG PAPER AND LEADS
ECG Paper Calibration
- Horizontal axis (time): 0.04 sec per small box (1 mm); 0.2 sec per large box (5 mm)
- Vertical axis (voltage): 0.1 mV per mm; standard calibration = 1 mV = 10 mm tall
- 5 large boxes = 1.0 second
The 12-Lead System
Limb leads (frontal plane):
| Lead | View of Heart |
|---|---|
| I | Lateral (left arm to right arm) |
| II | Inferior (right arm to left foot) |
| III | Inferior (left arm to left foot) |
| aVR | From right shoulder - looks "into" the heart |
| aVL | Lateral (left arm) |
| aVF | Inferior (left foot) |
Precordial (chest) leads (horizontal plane):
| Lead | Position | View |
|---|---|---|
| V1 | 4th intercostal space, right sternal border | Septal |
| V2 | 4th intercostal space, left sternal border | Septal |
| V3 | Between V2 and V4 | Anterior |
| V4 | 5th intercostal space, midclavicular line | Anterior |
| V5 | Anterior axillary line | Lateral |
| V6 | Midaxillary line | Lateral |
PART 3 - SYSTEMATIC ECG INTERPRETATION
A reliable approach to every ECG follows this sequence:
Step 1 - Rate
Method 1 (regular rhythm): 300 ÷ number of large boxes between R waves
| Large boxes between R waves | Rate (bpm) |
|---|---|
| 1 | 300 |
| 2 | 150 |
| 3 | 100 |
| 4 | 75 |
| 5 | 60 |
| 6 | 50 |
Method 2 (exact): 60 ÷ R-R interval in seconds
Method 3 (irregular rhythm): Count QRS complexes in a 10-second strip, multiply by 6
- Normal: 60-100 bpm
- Bradycardia: <60 bpm
- Tachycardia: >100 bpm
Medical Physiology, p. 731
Step 2 - Rhythm
Ask: Is the rhythm regular or irregular? Are P waves present? Is each P wave followed by a QRS? Is the PR interval constant?
Normal Sinus Rhythm (NSR):
- Rate 60-100 bpm
- Regular R-R intervals
- Upright P waves in leads I, II, aVF
- Constant PR interval (0.12-0.20 sec)
- Each P followed by a QRS
Step 3 - Intervals and Durations
| Measurement | Normal Range | Significance if Abnormal |
|---|---|---|
| P wave duration | <0.12 sec (3 small boxes) | >0.12 sec = atrial enlargement/conduction delay |
| PR interval | 0.12-0.20 sec (3-5 small boxes) | Short = preexcitation; Long = AV block |
| QRS duration | <0.12 sec (<3 small boxes) | >0.12 sec = bundle branch block or ventricular rhythm |
| QT interval | Varies with rate; QTc <0.44 sec men, <0.46 sec women | Prolonged = risk of torsades de pointes |
| ST segment | Isoelectric (no elevation/depression) | Elevation = injury/STEMI; Depression = ischemia |
The QT interval shortens as heart rate increases. Use the corrected QT (QTc) using Bazett's formula: QTc = QT ÷ √(R-R interval in seconds).
Step 4 - Electrical Axis
The normal QRS axis in the frontal plane is -30° to +90°.
Quick method: Check leads I and aVF.
| Lead I | aVF | Axis |
|---|---|---|
| Positive | Positive | Normal (0° to +90°) |
| Positive | Negative | Left axis deviation (-30° to -90°) |
| Negative | Positive | Right axis deviation (+90° to +180°) |
| Negative | Negative | Extreme/northwest axis |
Causes of Left Axis Deviation (LAD): Left anterior fascicular block (most common), LVH, inferior MI, LBBB
Causes of Right Axis Deviation (RAD): RVH, RBBB, left posterior fascicular block, pulmonary embolism, dextrocardia
Causes of Right Axis Deviation (RAD): RVH, RBBB, left posterior fascicular block, pulmonary embolism, dextrocardia
Step 5 - P Wave Morphology
- P pulmonale: Tall, peaked P waves >2.5 mm in lead II - right atrial enlargement
- P mitrale: Broad, notched P wave >0.12 sec in lead II with biphasic P in V1 - left atrial enlargement
Step 6 - QRS Morphology
Look for: Q waves (normal vs. pathologic), R wave progression across precordial leads, bundle branch blocks.
Normal R wave progression: R wave grows from V1 to V5, with transition (R = S) around V3-V4.
Pathologic Q waves:
- Width >0.04 sec (1 small box) OR
- Depth >1/4 of following R wave
- Indicate prior myocardial infarction
Step 7 - ST Segment and T Wave
- ST elevation (>1 mm limb leads, >2 mm precordial leads): STEMI, pericarditis, Brugada, early repolarization
- ST depression: Subendocardial ischemia, digoxin effect, LVH strain
- T wave inversion: Ischemia, PE (right-sided), RBBB, LVH, normal in aVR and V1
PART 4 - BUNDLE BRANCH BLOCKS
When QRS duration is >0.12 sec (3 small boxes), suspect a bundle branch block (BBB). Use the WILLIAM MARROW mnemonic or the pattern in V1 and V6.
Right Bundle Branch Block (RBBB)
Criteria:
- QRS ≥ 0.12 sec
- RSR' ("M" or "rabbit ears") pattern in V1 (rSR')
- Wide, slurred S wave in leads I and V6
- T wave inversion in V1-V3 (appropriate discordance)
Causes: Normal variant, RVH, pulmonary embolism, ASD, ischemia, myocarditis
Left Bundle Branch Block (LBBB)
Criteria:
- QRS ≥ 0.12 sec
- Broad, notched R wave in V5, V6, I, aVL (no S wave)
- Deep, wide QS complex in V1
- No septal Q waves in lateral leads
- Discordant ST changes (opposite to QRS deflection)
Causes: IHD, cardiomyopathy, hypertension, aortic stenosis - LBBB is almost always pathological.
Clinical note: New LBBB in the context of chest pain was historically treated as STEMI equivalent. Current guidelines are more nuanced (use Sgarbossa criteria to assess for true STEMI in LBBB).
PART 5 - ARRHYTHMIAS
Bradyarrhythmias
Sinus Bradycardia
- Rate <60 bpm, normal P waves, regular rhythm
- Causes: Athletes, vagal tone, hypothyroidism, beta-blockers, sick sinus syndrome
AV Blocks:
| Type | ECG Features | Location | Progression Risk |
|---|---|---|---|
| 1st degree | PR > 0.20 sec, all P waves conduct | AV node | Benign |
| 2nd degree Mobitz I (Wenckebach) | Progressive PR lengthening until P wave drops; then resets | AV node | Rarely progresses |
| 2nd degree Mobitz II | Constant PR, sudden dropped QRS without warning | Below AV node (His-Purkinje) | High - may progress to CHB |
| 3rd degree (Complete heart block) | P waves and QRS completely dissociated; atrial rate > ventricular rate | Any level | Emergency |
Diagnosis of complete AV block: P waves are dissociated from QRS complexes, with the atrial rate faster than the ventricular escape rate. Ventricular escape rate is typically 20-40 bpm if the escape pacemaker is in the ventricles (wide QRS) or 40-60 bpm if in the AV junction (narrow QRS).
- Goldman-Cecil Medicine, p. 1764
Supraventricular Tachyarrhythmias
Atrial Fibrillation (AF):
- Irregularly irregular rhythm
- No visible P waves - replaced by chaotic fibrillatory baseline (best seen in V1)
- Narrow QRS (unless aberrant conduction)
- Rate: Usually 100-170 bpm (ventricular response)
Atrial Flutter:
- Regular "sawtooth" flutter waves at 300 bpm (F waves)
- Typically 2:1 AV block giving ventricular rate of 150 bpm
- Flutter waves best seen in inferior leads (II, III, aVF) and V1
- Unlike AF, flutter waves are organized and regular
AVNRT (AV Nodal Reentrant Tachycardia) - most common SVT:
- Rate 150-250 bpm, regular
- Narrow QRS
- P waves buried in or just after QRS (retrograde P waves)
- Responds to vagal maneuvers and adenosine
AVRT (AV Reentrant Tachycardia - WPW related):
- May be narrow (orthodromic) or wide (antidromic)
- Short PR (<0.12 sec) + delta wave on baseline ECG = WPW pattern
- During tachycardia, typically narrow QRS (conduction goes normal route down His and back via accessory pathway)
Goldman-Cecil Medicine, p. 1753-1762
Differentiating SVT from VT in wide-complex tachycardia:
- AV dissociation = VT (P waves march through at own rate, independent of QRS)
- Fusion beats = VT (hybrid complexes where normal conduction fuses with ventricular focus)
- Capture beats = VT
- Concordance in precordial leads (all positive or all negative) = VT
Ventricular Arrhythmias
Premature Ventricular Complexes (PVCs):
- Wide (>0.12 sec), bizarre QRS
- No preceding P wave
- Followed by compensatory pause
- Isolated PVCs in structurally normal hearts are generally benign
Ventricular Tachycardia (VT):
- ≥3 consecutive PVCs at rate >100 bpm
- Wide QRS (>0.12 sec), regular
- AV dissociation, fusion beats, capture beats confirm VT
- Monomorphic VT: all QRS complexes look alike - often from a fixed scar (post-MI)
- Polymorphic VT: changing QRS morphology
Ventricular Fibrillation (VF):
- Chaotic, disorganized electrical activity
- No identifiable QRS complexes
- No cardiac output - immediately fatal without defibrillation
PART 6 - ISCHEMIA AND INFARCTION
The Progression of ECG Changes in MI
Myocardial ischemia and infarction produce characteristic, time-dependent ECG changes:
| Time | ECG Change | Mechanism |
|---|---|---|
| Minutes (hyperacute) | Tall, peaked (hyperacute) T waves | Early ischemia |
| Hours | ST elevation (STEMI) | Transmural injury current |
| Hours-days | Q wave development | Electrically dead tissue |
| Days-weeks | T wave inversion | Repolarization abnormality |
| Weeks-months | Persistent Q waves, T wave normalization | Scarring |
STEMI Localization by Leads
| Territory | Leads with ST Elevation | Culprit Artery |
|---|---|---|
| Anterior | V1-V4 | LAD (Left Anterior Descending) |
| Anterolateral | V1-V6, I, aVL | Proximal LAD or LCx |
| Inferior | II, III, aVF | RCA (Right Coronary Artery) |
| Lateral | I, aVL, V5, V6 | LCx (Left Circumflex) |
| Posterior | ST depression V1-V3 + tall R in V1 | RCA or LCx |
| Right ventricular | ST elevation in V4R | Proximal RCA |
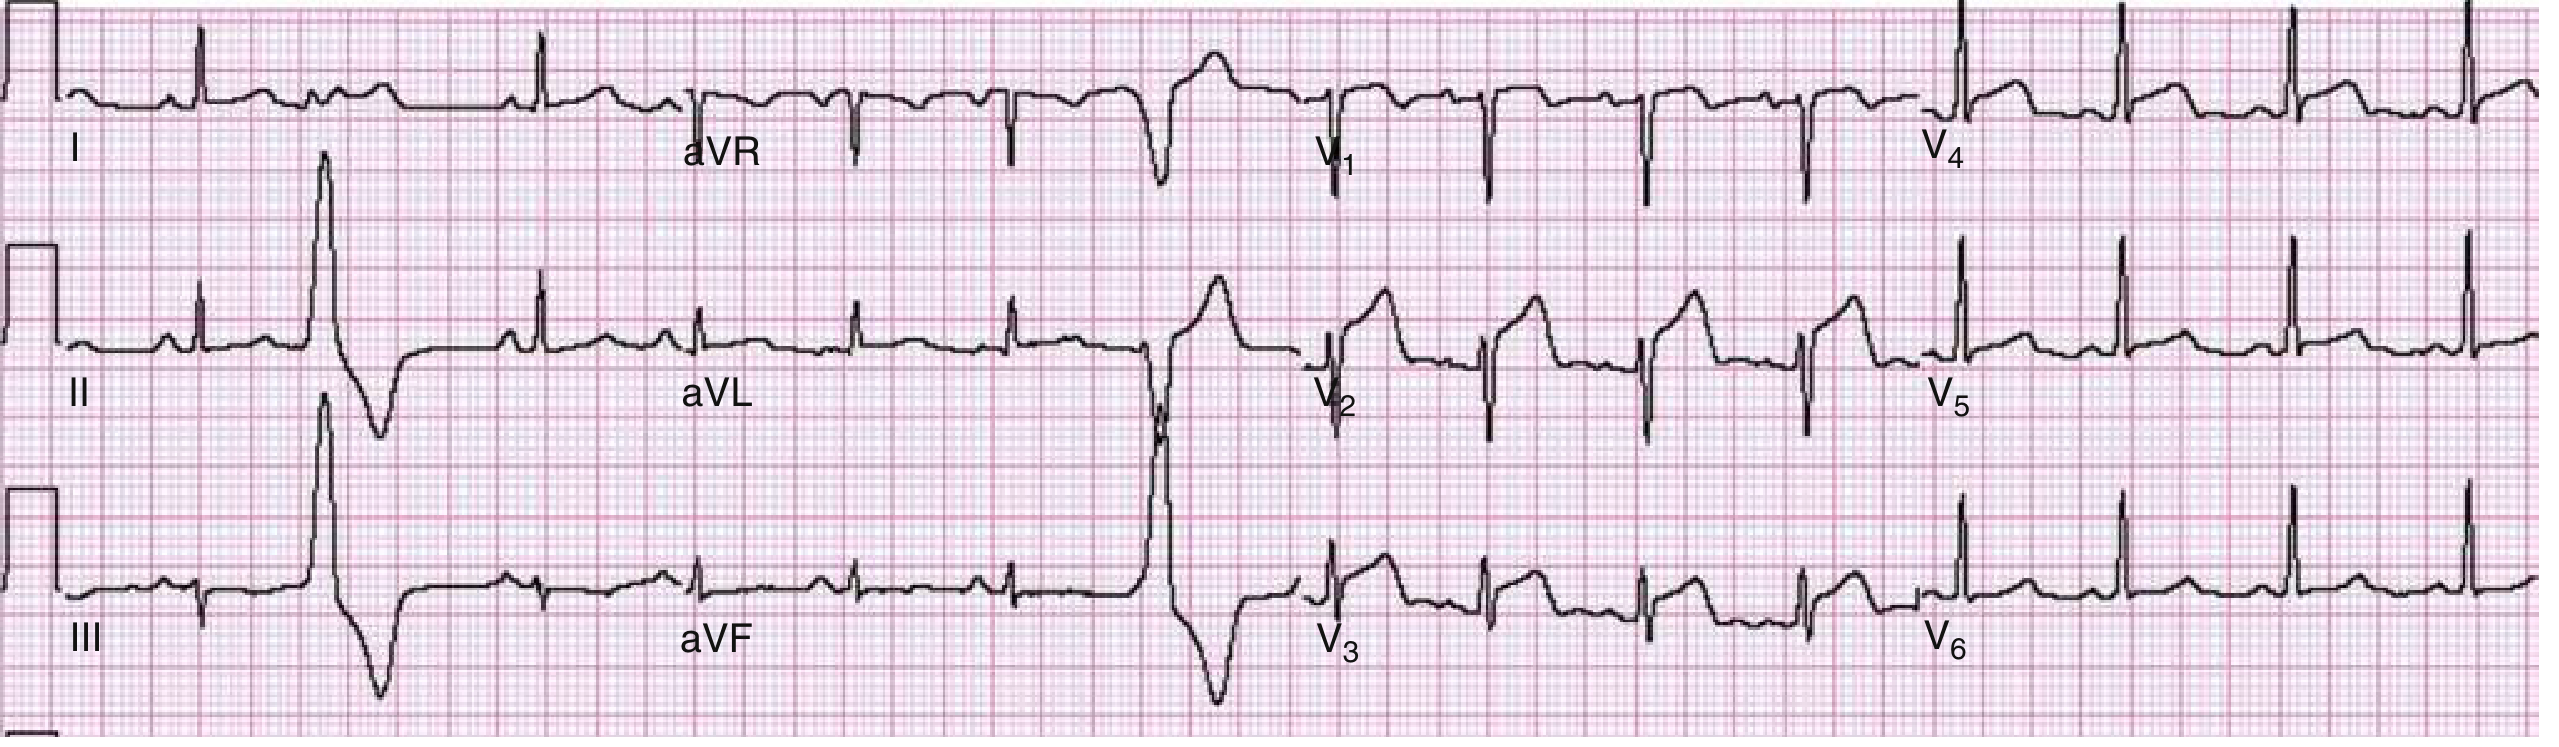
Fig. 64.6 from Rosen's Emergency Medicine - Anterior wall STEMI with ST elevation in V1-V4. LAD 90% stenosis confirmed on catheterization.
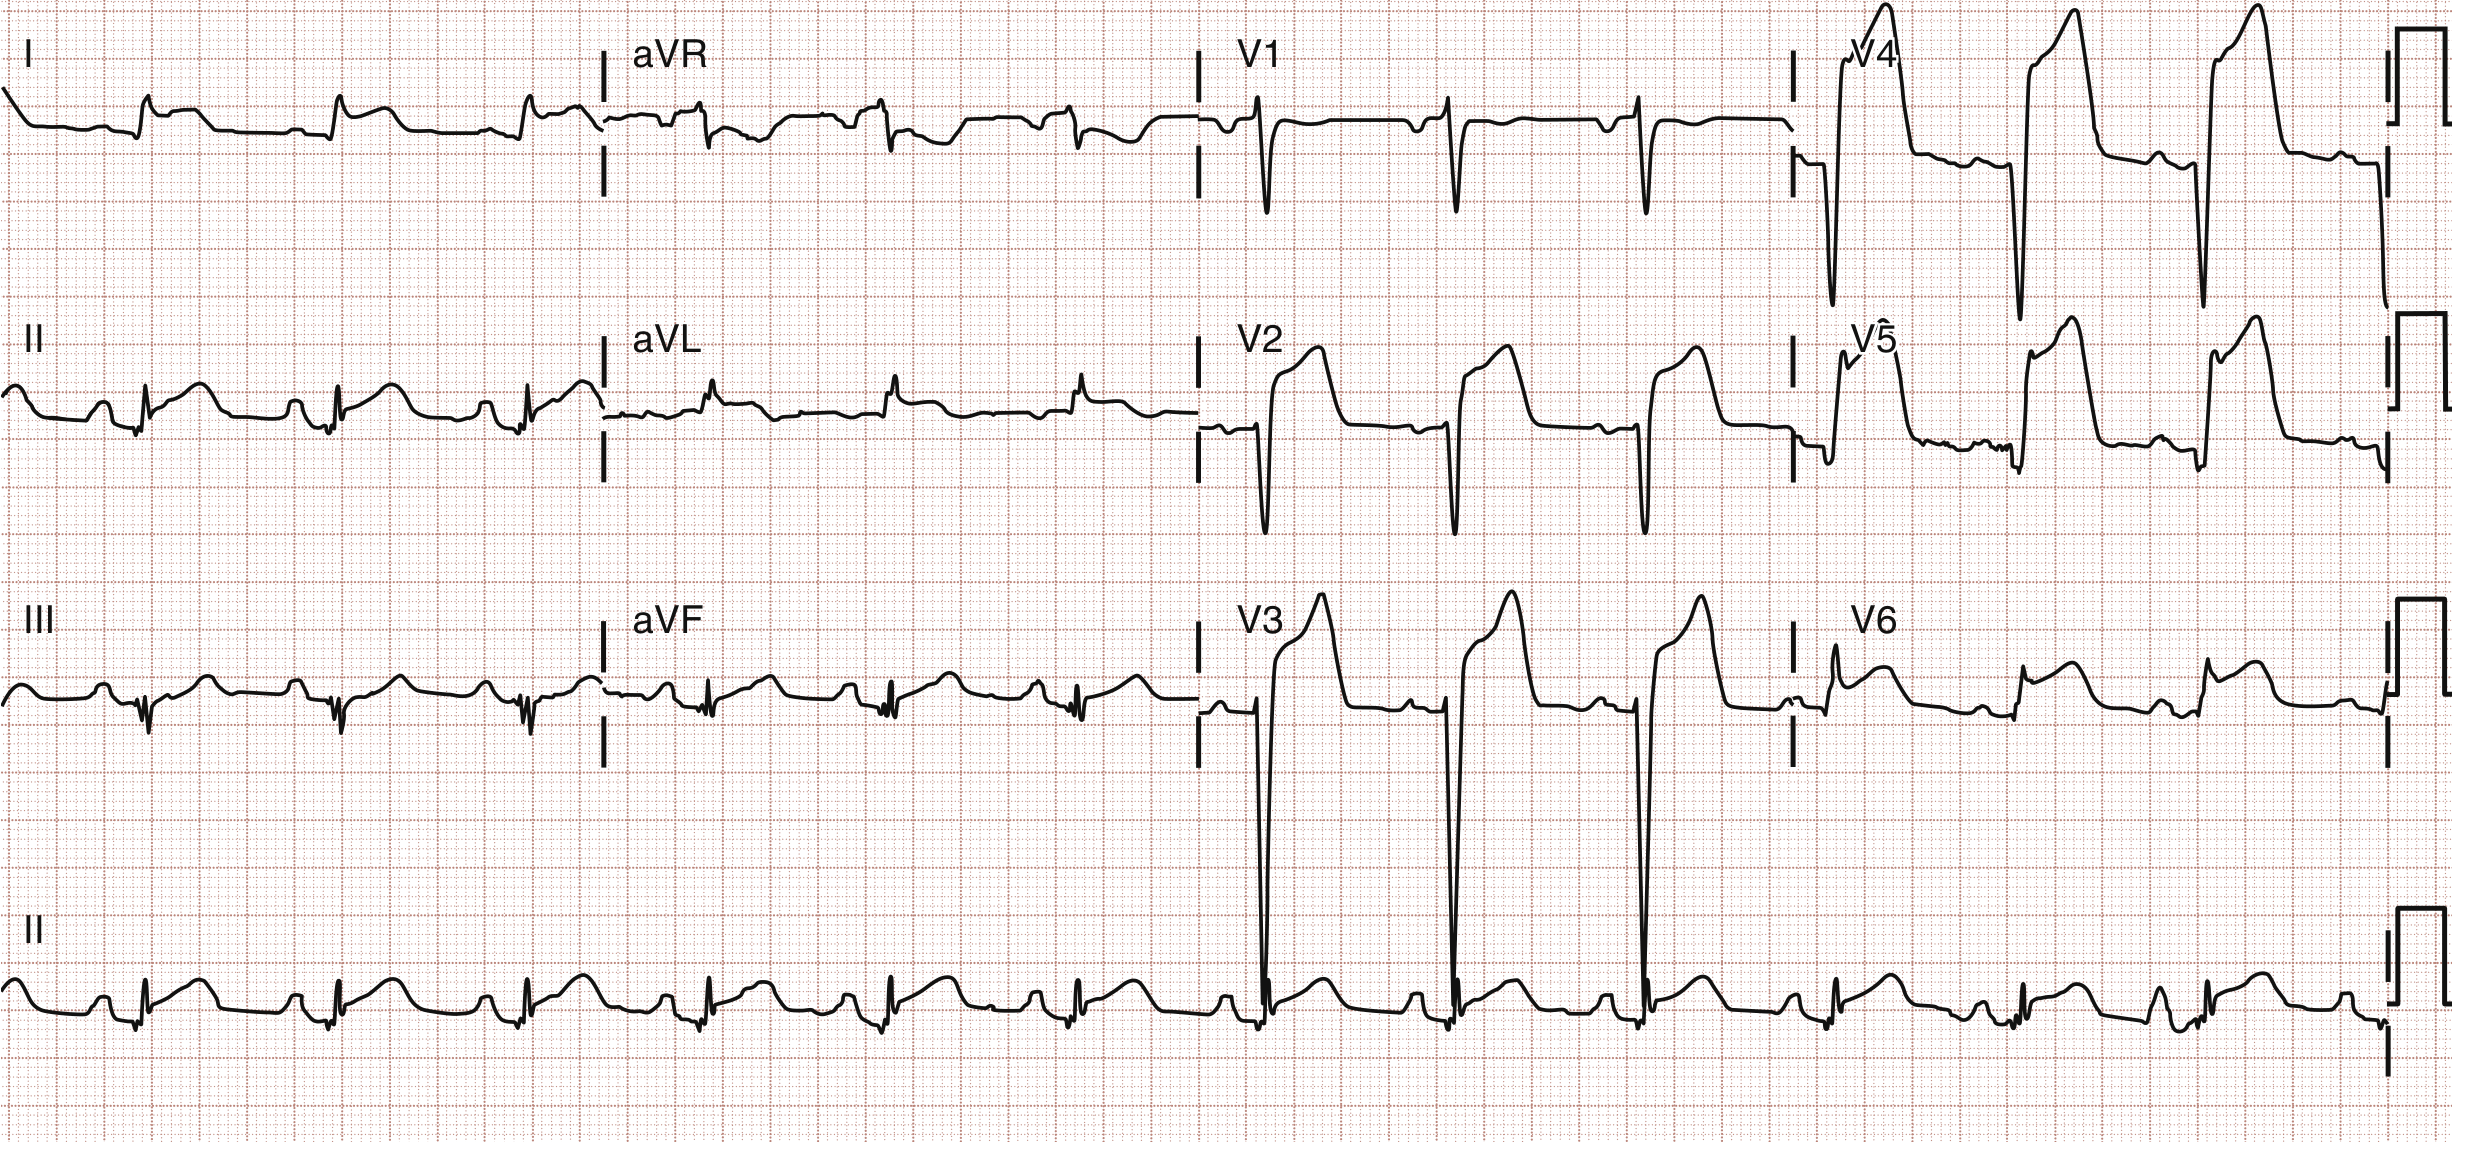
Fig. 64.7 from Rosen's Emergency Medicine - Anterolateral STEMI with STE in V2-V6, I, and aVL. In-stent thrombosis of LAD stent.
Special STEMI Patterns
aVR ST Elevation: >0.5 mV elevation in aVR is ~78% sensitive and 83% specific for left main coronary artery (LMCA) disease. Also consider proximal LAD occlusion or multivessel disease. If aVR elevation > V1 elevation, favors LMCA; if V1 > aVR, favors proximal LAD.
- Rosen's Emergency Medicine, p. 1004
de Winter Pattern (STEMI equivalent):
- Prominent tall T waves with J-point depression (ST depression) in precordial leads
- ST elevation in aVR
- Indicates proximal LAD occlusion; must be treated as STEMI
Wellens Syndrome:
- Deep symmetric T-wave inversions or biphasic T waves in V2-V3
- Occurs during pain-free period
- Indicates critical proximal LAD stenosis - do NOT stress test; needs urgent cath
PART 7 - ADVANCED PATTERNS
LVH (Left Ventricular Hypertrophy)
Most used criteria:
- Sokolow-Lyon: S in V1 + R in V5 or V6 ≥ 35 mm (sensitivity low ~40-60% in middle-age adults)
- Cornell: R in aVL + S in V3 > 28 mm (men) or >20 mm (women)
- Associated with ST-T changes in lateral leads ("strain pattern")
RVH (Right Ventricular Hypertrophy)
- Right axis deviation
- R > S in V1 (dominant R in V1)
- Deep S waves in V5-V6
- ST depression and T inversion in V1-V3
Pericarditis
- Diffuse ST elevation in multiple leads (not restricted to one territory)
- ST elevation is concave (saddle-shaped) upward
- PR depression (a key distinguishing feature from STEMI)
- No reciprocal ST depression (unlike STEMI)
- T wave inversion occurs after ST returns to baseline
Pulmonary Embolism (PE) - S1Q3T3 pattern
- S wave in lead I
- Q wave in lead III
- T wave inversion in lead III
- Also: sinus tachycardia (most common), new RBBB, right heart strain pattern (T inversion V1-V4), right axis deviation
- S1Q3T3 is specific but not sensitive - present in <20% of PE cases
Hyperkalemia - Progressive ECG Changes
- Peaked (tall, narrow) T waves - earliest sign
- Prolonged PR interval
- Widened QRS (loss of P waves)
- Sine wave pattern (merged QRS and T)
- Ventricular fibrillation / asystole
Hypokalemia
- Flattened T waves
- Prominent U waves (after T wave, best in V2-V3)
- Prolonged QU interval
- ST depression
Brugada Syndrome
- Type 1 (diagnostic): Coved-type (downsloping) ST elevation ≥2 mm in ≥1 of V1-V2, followed by negative T wave
- Can cause sudden cardiac death from polymorphic VT/VF
- ECG may be dynamic (appears and disappears)
Long QT Syndrome
- Congenital (mutations in ion channel genes) or acquired (drugs, electrolyte disturbances)
- QTc > 0.44 sec (men) or >0.46 sec (women)
- Risk of Torsades de Pointes - polymorphic VT with "twisting" QRS around the isoelectric line
- Acquired causes: hypokalemia, hypomagnesemia, antiarrhythmics (class Ia, III), antipsychotics, azole antifungals, fluoroquinolones
Wolff-Parkinson-White (WPW) Syndrome
- Accessory pathway (Bundle of Kent) bypasses AV node
- ECG features: short PR interval (<0.12 sec) + delta wave (slurred upstroke of QRS) + wide QRS
- Risk: AF with rapid accessory pathway conduction can lead to VF
- Never give AV nodal blocking agents (adenosine, verapamil, digoxin) in AF with WPW - can accelerate conduction down accessory pathway
PART 8 - STEP-BY-STEP SYSTEMATIC APPROACH (Summary Checklist)
When reading any ECG, use this structured sequence:
1. RATE         - Calculate bpm (regular: 300/large boxes; irregular: count x6)
2. RHYTHM       - Regular or irregular? P before every QRS?
3. P WAVES      - Present? Morphology? Axis (upright in II)?
4. PR INTERVAL  - 0.12-0.20 sec? Short (preexcitation)? Long (AV block)?
5. QRS          - Width <0.12 sec? Morphology? Pathologic Q waves?
6. AXIS         - Check leads I and aVF; Normal / LAD / RAD?
7. ST SEGMENT   - Elevation or depression? Which leads?
8. T WAVES      - Upright? Inverted? Hyperacute? Location?
9. QT INTERVAL  - Calculate QTc; prolonged?
10. OVERALL     - Clinical context + synthesize findings
Quick Reference: Key Normal Values
| Parameter | Normal Value |
|---|---|
| Heart rate | 60-100 bpm |
| PR interval | 0.12-0.20 sec |
| QRS duration | <0.12 sec |
| QTc | <0.44 sec (men), <0.46 sec (women) |
| QRS axis | -30° to +90° |
| R wave transition | V3-V4 |
| ST elevation threshold | <1 mm limb leads, <2 mm precordial leads |
Sources: Medical Physiology (Boron & Boulpaep); Miller's Anesthesia 10e; Fuster and Hurst's The Heart 15e; Harrison's Principles of Internal Medicine 22e; Goldman-Cecil Medicine International Edition; Rosen's Emergency Medicine; Tintinalli's Emergency Medicine; Katzung's Basic and Clinical Pharmacology 16e; The Washington Manual of Medical Therapeutics.
Prepare me for nclex exam from scratch
Asking for Preferences
Where are you starting from? · Which NCLEX are you preparing for? · What do you need most right now?
Reading File
Searching the Web
NCLEX-RN 2024 2025 exam format Next Generation NCLEX NGN changes high yield topics
Reading Web Page
https://bootcamp.com/blog/how-to-study-for-the-nclex-what-th…
Finding Sources
I now have everything I need. Let me deliver the complete NCLEX-RN preparation guide.
NCLEX-RN Complete Preparation Guide - From Scratch to Pass
For: Recently graduated RN, first attempt | Based on current 2026 NGN exam format
SECTION 1 - UNDERSTAND THE EXAM FIRST
What the NCLEX-RN Actually Is
The NCLEX-RN is NOT a knowledge memorization test. It is a clinical judgment exam - it tests whether you can think safely as a nurse in real patient situations. The National Council of State Boards of Nursing (NCSBN) redesigned it as the "Next Generation NCLEX" (NGN), which is now the permanent standard.
Key mindset shift: You're not answering "what is the right fact?" You're answering "what would a safe nurse do right now?"
Exam Format (2026 - Current)
| Feature | Details |
|---|---|
| Format | Computerized Adaptive Testing (CAT) |
| Minimum questions | 85 |
| Maximum questions | 150 |
| Time limit | 5 hours |
| Passing | Algorithm determines you're consistently making safe decisions above the passing standard |
| Case studies | 3 unfolding case studies per exam (6 questions each = 18 questions) |
| Lab values | Normal ranges are PROVIDED on-screen (don't memorize numbers, understand meaning) |
| Scoring | Polytomous (partial credit) on NGN items |
The CAT adapts to your ability level. More questions does NOT mean you're failing - it means the algorithm needs more data points. Some people pass at 85 questions, others at 150.
2026 NCLEX-RN Content Blueprint (Client Needs Categories)
This is how the exam distributes its questions:
| Category | % of Exam | What It Tests |
|---|---|---|
| Safe & Effective Care Environment | 25-37% | |
| - Management of Care | 15-21% | Delegation, prioritization, legal/ethical, continuity of care |
| - Safety & Infection Prevention | 10-16% | PPE, isolation, fall prevention, medication safety |
| Health Promotion & Maintenance | 6-12% | Lifespan development, screenings, immunizations, OB/GYN |
| Psychosocial Integrity | 6-12% | Mental health, crisis, therapeutic communication, abuse |
| Physiological Integrity | 38-62% | |
| - Basic Care & Comfort | 6-12% | ADLs, nutrition, mobility, wound care |
| - Pharmacological & Parenteral Therapies | 13-19% | Medications, IV fluids, blood products, TPN |
| - Reduction of Risk Potential | 9-15% | Labs, diagnostic tests, procedures, complications |
| - Physiological Adaptation | 11-17% | Disease management, emergencies, pathophysiology |
Takeaway: Physiological Integrity makes up nearly 60% of the exam. Pharmacology alone is 13-19%. These are your biggest ROI study areas.
NGN Question Types You'll See
| Type | What It Looks Like |
|---|---|
| Standard multiple choice | Pick 1 of 4 options |
| Select All That Apply (SATA) | Check all that are correct (partial credit now!) |
| Drag-and-Drop | Order steps, pair items, arrange priorities |
| Cloze/Drop-Down | Fill in blanks in a narrative scenario (up to 6 responses) |
| Matrix Grid | Check boxes in a table for multiple findings/actions |
| Enhanced Hot Spot | Click on specific parts of an image, chart, or note |
| Unfolding Case Study | 6 sequential questions about one evolving patient; tests clinical judgment across the 6 NGN cognitive skills |
The 6 NGN Clinical Judgment Skills (NCSBN Model):
- Recognize Cues - what findings matter?
- Analyze Cues - what do they mean?
- Prioritize Hypotheses - what is most likely/urgent?
- Generate Solutions - what can be done?
- Take Actions - what do I do first?
- Evaluate Outcomes - did the intervention work?
Every unfolding case study walks you through these 6 steps.
SECTION 2 - HIGH-YIELD CONTENT MASTERY
These topics appear heavily and repeatedly. Master them first.
#1 - PRIORITIZATION FRAMEWORKS (most tested concept)
You will prioritize on almost every question. Know these hierarchies:
ABCs (Airway, Breathing, Circulation) - always comes first clinically
- Airway obstruction > respiratory failure > hemorrhage > everything else
Maslow's Hierarchy - physiological needs before psychosocial needs
- Hunger/pain/breathing > safety > belonging > esteem > self-actualization
Acute vs. Chronic - always address the acute/unstable patient first
NCLEX Priority Rule: When two patients are both sick, choose the one who is:
- Newly deteriorating (not baseline)
- Has an airway/breathing/circulation threat
- Is postoperative (higher risk for complications)
- Has an unexpected/abnormal finding (vs. expected)
#2 - DELEGATION RULES
Delegation is tested on 15-21% of the exam. Know this cold:
| Role | Can Do |
|---|---|
| RN | Assess, plan, educate, evaluate, initiate care plans, complex wound care, titrate IV drips, give blood, first dose of new meds |
| LPN/LVN | Routine care, dressing changes (stable wounds), administer meds (not IV push in most states), monitor (not initial assessment) |
| UAP/CNA | ADLs, vital signs (stable patients), hygiene, ambulation, I&O, non-sterile tasks, repositioning |
Never delegate to UAP: Assessment, teaching, care planning, interpretation of data, unstable patients, anything requiring nursing judgment.
Cannot delegate to LPN: Initial patient assessment, care plan development, evaluation of outcomes, IV push medications, blood administration (in many states), teaching new skills.
NCLEX tip for delegation questions: Ask - "Does this task require nursing judgment or assessment?" If yes, keep it with the RN.
#3 - INFECTION CONTROL & ISOLATION PRECAUTIONS
| Precaution Type | Diseases | PPE Required |
|---|---|---|
| Standard | All patients | Gloves, gown if splash risk |
| Airborne | TB, measles, varicella, disseminated herpes zoster | N95 respirator, negative pressure room |
| Droplet | Influenza, meningitis, pertussis, mumps, rubella, COVID-19 | Surgical mask, gloves |
| Contact | C. diff, MRSA, VRE, wound infections, RSV | Gloves, gown |
PPE donning order (put ON): Gown → Mask/Respirator → Goggles → Gloves
PPE doffing order (take OFF): Gloves → Goggles → Gown → Mask (most contaminated off first)
PPE doffing order (take OFF): Gloves → Goggles → Gown → Mask (most contaminated off first)
NCLEX tip: C. diff requires soap and water - NOT alcohol-based hand sanitizer (alcohol doesn't kill spores).
#4 - PHARMACOLOGY ESSENTIALS
The most high-yield drug categories on NCLEX:
Anticoagulants
| Drug | Antidote | Key Nursing Action |
|---|---|---|
| Heparin (IV/SQ) | Protamine sulfate | aPTT monitoring (therapeutic 1.5-2.5x normal) |
| Warfarin | Vitamin K (phytonadione) | PT/INR monitoring (therapeutic 2-3); many food/drug interactions |
| Enoxaparin (Lovenox) | Protamine sulfate (partial) | No monitoring needed for most; check renal function |
| Dabigatran | Idarucizumab (Praxbind) |
Cardiac Drugs
| Drug | Key Side Effect / Nursing Point |
|---|---|
| Digoxin | Narrow therapeutic index (0.5-2 ng/mL); toxicity: N/V, visual halos, bradycardia; hold if HR <60 |
| Beta-blockers (metoprolol, atenolol) | Hold if HR <60 or SBP <90; do NOT stop abruptly (rebound angina) |
| ACE inhibitors (-pril) | Dry cough (switch to ARB), hyperkalemia, first-dose hypotension; hold if Cr rising |
| Nitroglycerin | Headache, hypotension; store in dark glass; max 3 doses 5 min apart |
| Amiodarone | Pulmonary toxicity, thyroid dysfunction, photosensitivity, corneal deposits |
Pain Management
- Opioids: Monitor respirations (hold if RR <12), have naloxone (Narcan) available
- NSAIDs: Avoid with renal impairment, peptic ulcers, anticoagulant use
Psychiatric Medications
| Drug Class | Key Points |
|---|---|
| Lithium | Therapeutic level 0.6-1.2 mEq/L; toxicity at >1.5; monitor Na, fluids, and renal function |
| Clozapine (Clozaril) | Weekly CBC for agranulocytosis; never skip blood draws |
| MAOIs | Tyramine-free diet (no aged cheese, wine, cured meats); lethal hypertensive crisis |
| SSRIs | Serotonin syndrome if combined with other serotonergic drugs |
| Antipsychotics (haloperidol, risperidone) | EPS (dystonia, akathisia, tardive dyskinesia); neuroleptic malignant syndrome |
Electrolyte-Altering Drugs
- Loop diuretics (furosemide): cause hypokalemia, hyponatremia, hypomagnesemia
- Potassium-sparing diuretics (spironolactone): cause hyperkalemia
- Corticosteroids: cause hyperglycemia, hypokalemia, Na/fluid retention, immunosuppression
#5 - CRITICAL LAB VALUES (understand meaning, not numbers)
Lab values ARE provided on NCLEX now, but you need to know what they mean clinically.
| Lab | Critical Low | Critical High | NCLEX Action |
|---|---|---|---|
| Potassium (K+) | <3.5 (hypokalemia) | >5.5 (hyperkalemia) | Hypo: cardiac arrhythmias, muscle weakness; Hyper: peaked T waves, cardiac arrest risk |
| Sodium (Na+) | <120 (severe hyponatremia) | >155 (hypernatremia) | Hypo: seizures, confusion; Hyper: thirst, confusion, seizures |
| Glucose | <70 (hypoglycemia) | >400 (diabetic crisis) | Hypo: give glucose immediately; Hyper: assess for DKA/HHS |
| Hemoglobin | <7 (transfusion likely needed) | Assess for bleeding, symptoms of anemia | |
| Platelets | <50,000 (bleeding risk) | >1,000,000 (clotting risk) | Bleeding precautions; avoid injections |
| WBC | <2,000 (neutropenia) | >30,000 (infection/leukemia) | Neutropenic precautions |
| INR | >3.0 (supratherapeutic) | Hold warfarin; assess for bleeding | |
| pH | <7.35 (acidosis) | >7.45 (alkalosis) | ROME mnemonic for ABGs (below) |
ABG Interpretation - ROME Mnemonic:
- Respiratory Opposite: pH up + CO2 down = respiratory alkalosis; pH down + CO2 up = respiratory acidosis
- Metabolic Equal: pH up + HCO3 up = metabolic alkalosis; pH down + HCO3 down = metabolic acidosis
- Normal values: pH 7.35-7.45, PaCO2 35-45, HCO3 22-26
#6 - PRIORITY CONDITIONS BY BODY SYSTEM
Cardiovascular
- Chest pain - first priority is always 12-lead ECG and oxygen; STEMI = activate cath lab
- Heart failure - assess lung sounds, daily weights (1 kg = ~1L fluid); position HOB 30-45°
- Hypertensive crisis - SBP >180 + end organ damage = emergency; gradual reduction (not too fast)
Respiratory
- Airway obstruction - #1 priority always; jaw thrust in trauma
- Tension pneumothorax - tracheal deviation, absent breath sounds, hypotension = needle decompression
- PE - sudden dyspnea, tachycardia, pleuritic chest pain; anticoagulate immediately
- COPD - low-flow O2 (target SpO2 88-92%); high O2 removes hypoxic drive
Neurological
- Stroke (FAST) - Face drooping, Arm weakness, Speech difficulty, Time to call 911
- Ischemic stroke: tPA within 4.5 hours (check contraindications)
- Hemorrhagic stroke: NO tPA, control BP
- Increased ICP - HOB at 30°, avoid hip flexion, avoid Valsalva, hyperventilate if herniation imminent
OB/Maternity (heavily tested)
| Condition | Key Findings | Priority Action |
|---|---|---|
| Preeclampsia | BP >140/90 after 20 weeks, proteinuria, headache, visual changes, RUQ pain | IV magnesium sulfate; have calcium gluconate (antidote) at bedside |
| Eclampsia | Seizures in pregnant patient | Protect airway, position on left side, mag sulfate |
| Placenta previa | Painless bright red bleeding | No vaginal exams; C-section likely |
| Abruptio placentae | Painful dark bleeding, rigid uterus | Emergency delivery |
| Fetal bradycardia | FHR <110 | Reposition mother to left lateral, O2, stop oxytocin, notify MD |
Pediatrics
Growth and development milestones (commonly tested):
- 2 months: social smile
- 4 months: head control, laughs
- 6 months: sits with support, rolls
- 9 months: sits alone, says mama/dada
- 12 months: walks with support, 1-3 words
- 18 months: walks well, 10-word vocabulary
- 2 years: 2-word phrases, runs
- 3 years: 3-word sentences, rides tricycle
- 5 years: ties shoes, 5-6 word sentences
Epiglottitis (emergency): High fever, drooling, "tripod" position, muffled voice - Do NOT attempt to visualize throat; prepare for emergency airway.
Pyloric stenosis: Projectile non-bilious vomiting in infant 2-6 weeks old; olive-shaped mass in abdomen.
#7 - MENTAL HEALTH / PSYCHIATRIC NURSING
Therapeutic Communication Rules:
- ALWAYS acknowledge feelings first ("You seem upset. Tell me more about what you're feeling.")
- AVOID: false reassurance ("Everything will be fine"), giving advice, yes/no questions, changing the subject
- AVOID: "Why" questions ("Why did you do that?") - implies judgment
Suicide Assessment:
- Direct questions do NOT plant the idea - always ask directly about suicidal ideation
- Highest risk: specific plan + lethal means + timeline
- Nursing priority: safety first - remove all sharp objects, cords, shoelaces; 1:1 monitoring
Involuntary hospitalization: For imminent danger to self or others; requires physician/court order (rules vary by state but NCLEX tests the general principle).
Defense Mechanisms (commonly tested):
- Denial: refuses to accept reality
- Projection: attributing own feelings to others
- Rationalization: making excuses
- Regression: reverting to earlier behavior under stress
- Displacement: redirecting feelings to safer target
#8 - POST-OPERATIVE CARE PRIORITIES
Immediately post-op, always assess in this order: Airway → Breathing → Circulation → Surgical site → Neuro status
Complications to monitor:
| Complication | Signs | Priority Action |
|---|---|---|
| Malignant hyperthermia | Rapidly rising temp, muscle rigidity, tachycardia (intraop/early postop) | Dantrolene immediately; stop anesthesia |
| Respiratory depression | RR <12, SpO2 dropping, somnolence | Stimulate patient; naloxone if opioid-induced |
| Hemorrhage | Tachycardia, falling BP, increasing wound drainage | Notify surgeon; apply pressure; IV fluid |
| DVT | Unilateral leg swelling, warmth, Homan's sign | Anticoagulation; compression devices |
SECTION 3 - TEST-TAKING STRATEGIES
The NCLEX Thinking Process
For every question, ask:
- What is the question actually asking? (Reread the last sentence of the stem)
- What are the key clinical data? (Vitals, symptoms, timing, history)
- Who is the sickest/most unstable?
- What would a safe, reasonable nurse do FIRST?
Elimination Strategies
- Eliminate options that are harmful - never choose an action that could hurt the patient
- Eliminate options that delay care - "call the doctor and wait" is rarely the first action
- Eliminate options that pass the buck - "refer to another nurse" is rarely correct
- Prefer assessment over intervention (when the patient status is unclear)
- Prefer independent nursing actions over calling the physician (for initial steps)
When You See "Which patient do you see FIRST?"
Choose the patient who is:
- Airway/breathing compromised
- Hemodynamically unstable
- Newly worsening (not at their baseline)
- Post-procedure/post-op within first hours
- Presenting with unexpected or abnormal findings
When You See "What do you do FIRST?"
The answer often follows this hierarchy:
- Assess the problem fully (if unknown status)
- Ensure patient safety (position, airway)
- Independent nursing action
- Notify physician
- Document
Reading NGN Case Studies
- Read the chief complaint and initial vitals first
- Identify what's abnormal/unexpected
- Apply the 6 clinical judgment steps
- For each subsequent question, note how the patient's condition evolves
- Remember: partial credit means attempting all answers thoughtfully is better than leaving any blank
SECTION 4 - STUDY PLAN (8-Week Schedule)
Before You Start
- Get your ATT (Authorization to Test) letter from your state board
- Choose a question bank: UWorld (gold standard), Kaplan, NCLEX Bootcamp, or Saunders
- Get a content review book (Saunders NCLEX-RN or Lippincott Q&A)
- Schedule 4-6 hours of focused study daily
8-Week Study Plan
| Week | Focus | Daily Goal |
|---|---|---|
| Week 1 | Exam format + Management/Delegation/Prioritization | 50 questions + review ALL rationales |
| Week 2 | Pharmacology (cardiac, anticoagulants, psych meds) | 75 questions + drug flashcards |
| Week 3 | Cardiovascular + Respiratory pathophysiology | 75 questions + content review |
| Week 4 | OB/Maternity + Pediatrics + Growth/Development | 75 questions + milestone table |
| Week 5 | Neurology + Musculoskeletal + Endocrine (DKA, thyroid) | 75 questions |
| Week 6 | Mental Health + Therapeutic communication + Crisis | 75 questions |
| Week 7 | Infection control + Lab values + ABGs + Fluids/Electrolytes | 100 questions |
| Week 8 | Full practice exams + timed 85-150 question sets + weak area review | 2 full practice tests |
Daily structure:
- 15 questions BEFORE studying content (reveals gaps)
- 45-60 min content review on that topic
- 35 more questions on the same topic
- 20 min reviewing ALL rationales (right AND wrong answers)
Study Method: Question-First Learning
Don't read chapter → then practice. Instead:
- Do 10-15 questions on Topic X
- Note what you got wrong AND what you guessed on
- Study only the concepts you're unsure of
- Do 20 more questions
- Review all rationales
This builds exam-style thinking from day 1.
SECTION 5 - EXAM DAY CHECKLIST
Night before:
- No new studying (sleep is more valuable)
- Pack: valid ID, ATT confirmation, snacks, water
- Know the testing center location and parking
Morning of:
- Light meal (complex carbs + protein)
- Arrive 30 min early
- No phone in testing room
During the exam:
- Read every word of the stem carefully (what type of patient? what phase of care?)
- Trust your first instinct if you genuinely know it
- Flag uncertain questions and come back
- If you see 85 questions and the exam stops - you could have passed or failed; there is no way to tell
- If the exam runs long (100+), stay calm - it means the algorithm still needs data and is NOT a sign of failure
Mental strategies:
- Every question is independent - forget the last question
- Think "What would a safe nurse do?" not "What would I do?"
- Avoid the "analysis paralysis" trap: if 2 answers both seem correct, ask which one addresses the PRIMARY concern
SECTION 6 - FREE AND PAID RESOURCES
| Resource | Cost | Best For |
|---|---|---|
| UWorld NCLEX-RN | ~$300/yr | Highest quality questions; detailed rationales; performance analytics |
| NCLEX Bootcamp | Free tier available | NGN case studies; strategy videos |
| Kaplan NCLEX | ~$450 | Decision tree framework; adaptive tests |
| Saunders NCLEX-RN Review (book) | ~$50 | Best content review book; 5,000+ questions |
| YouTube: RegisteredNurseRN | Free | Visual content explanations |
| YouTube: Simple Nursing | Free | Pharmacology made easy |
| NCSBN Learning Extension | ~$50 | Official NCLEX practice from the exam makers |
QUICK REFERENCE CARD - Most Tested NCLEX Facts
PRIORITY ORDER:    Airway > Breathing > Circulation > Safety
DELEGATION:        Assessment = RN only; Stable ADLs = UAP
ISOLATION:         Airborne = N95 + negative pressure room
PPE ON:            Gown → Mask → Goggles → Gloves
PPE OFF:           Gloves → Goggles → Gown → Mask
C. DIFF:           Soap & water (not hand sanitizer)
DIGOXIN HOLD:      HR < 60
BETA BLOCKER:      Never stop abruptly
HEPARIN ANTIDOTE:  Protamine sulfate
WARFARIN ANTIDOTE: Vitamin K (Phytonadione)
LITHIUM TOXICITY:  Level > 1.5 mEq/L
CLOZAPINE:         Weekly CBC (agranulocytosis)
MAOI + TYRAMINE:   Hypertensive crisis
O2 IN COPD:        88-92% SpO2 target
STROKE + tPA:      Within 4.5 hours (ischemic only)
PREECLAMPSIA:      Mag sulfate; antidote = calcium gluconate
PLACENTA PREVIA:   NO vaginal exams
EPIGLOTTITIS:      Don't look in throat; protect airway
MALIGNANT HYPERT:  Dantrolene immediately
You're starting from a strong position as a recent graduate - the content is fresh. The main shift from nursing school to NCLEX is moving from "what is the answer?" to "what does a safe nurse do first?" Keep that lens on every single question, do a high volume of practice questions daily, and review every rationale. Most graduates who prepare consistently for 6-8 weeks pass on the first attempt.
Find recent practice test questions on delegation and priority setting
Searching the Web
NCLEX-RN delegation priority setting practice questions 2025 NGN with rationales
Finding Sources
Reading Web Page
https://nurseslabs.com/prioritization-delegation-assignment-…
I have solid material. Here is a full set of practice questions built from current NCLEX-RN format standards, incorporating content from NursesLabs, GoodNurse 2026, and SimpleNursing, all written in NGN-style stems.
NCLEX-RN Practice Questions: Delegation & Priority Setting
30 questions with full rationales - NGN format (2026 standards)
PART A - DELEGATION (Who Does What?)
Question 1
The RN is caring for four patients on a medical-surgical unit. Which task is most appropriate to delegate to the unlicensed assistive personnel (UAP)?
A. Administering a scheduled oral antibiotic to a stable patient
B. Measuring and recording urine output for a patient post-Foley removal
C. Reinforcing discharge teaching about a new insulin regimen
D. Performing a focused assessment on a patient reporting new chest pain
B. Measuring and recording urine output for a patient post-Foley removal
C. Reinforcing discharge teaching about a new insulin regimen
D. Performing a focused assessment on a patient reporting new chest pain
Answer: B
Rationale: Measuring and recording urine output is a non-invasive, predictable, stable task that falls within UAP scope. Oral medication administration belongs to the LPN/RN. Discharge teaching and assessment always belong to the RN - these require nursing judgment and evaluation.
Question 2
A registered nurse is delegating tasks to an LPN and a UAP. Which assignment is appropriate for the LPN?
A. Developing the care plan for a newly admitted patient with COPD
B. Performing the initial assessment on a postoperative patient just returned from the PACU
C. Changing a simple wound dressing on a patient with a stable, healing surgical incision
D. Evaluating whether a patient's pain medication is effective after administration
B. Performing the initial assessment on a postoperative patient just returned from the PACU
C. Changing a simple wound dressing on a patient with a stable, healing surgical incision
D. Evaluating whether a patient's pain medication is effective after administration
Answer: C
Rationale: Changing a routine dressing on a stable wound is within LPN scope. Developing care plans, performing initial assessments, and evaluating the effectiveness of interventions all require professional nursing judgment and belong to the RN.
Question 3
The RN is charge nurse and receives a report about these four patients. Which patient should the RN personally assess first before delegating care?
A. A patient with COPD, SpO2 94% on 2L O2 at baseline, requesting a bath
B. A post-thyroidectomy patient (2 hours post-op) now reporting hoarseness and stridor
C. A patient with hip replacement (day 3) reporting pain 6/10, vital signs stable
D. A patient with a colostomy (day 2) who needs discharge teaching later today
B. A post-thyroidectomy patient (2 hours post-op) now reporting hoarseness and stridor
C. A patient with hip replacement (day 3) reporting pain 6/10, vital signs stable
D. A patient with a colostomy (day 2) who needs discharge teaching later today
Answer: B
Rationale: Stridor after thyroidectomy signals laryngospasm or recurrent laryngeal nerve damage - an immediate airway emergency. This cannot be delegated; the RN must assess and prepare to secure the airway immediately. All other patients are stable or have needs that can be addressed later. Source: GoodNurse.com 2026
Question 4
Which statement by a UAP indicates a correct understanding of delegation boundaries?
A. "I can take vital signs on any patient, including those just transferred from the ICU."
B. "I can ambulate a post-op patient if the RN confirms the orders first."
C. "I can reinforce the nurse's teaching about wound care after the nurse has already taught the patient."
D. "I can take vital signs and inform the RN if anything seems unusual to me."
B. "I can ambulate a post-op patient if the RN confirms the orders first."
C. "I can reinforce the nurse's teaching about wound care after the nurse has already taught the patient."
D. "I can take vital signs and inform the RN if anything seems unusual to me."
Answer: B
Rationale: Ambulating a stable post-op patient is appropriate for a UAP when orders are confirmed and the RN has assessed the patient. Option A is incorrect - recently transferred ICU patients are unstable, not appropriate for UAP-level monitoring. Option C is incorrect - a UAP cannot reinforce teaching (that requires nursing judgment). Option D sounds reasonable but is incomplete - "seems unusual" is not an adequate safety net; the RN must define which values to report.
Question 5
The RN is delegating morning care assignments. Which patient should NOT be assigned to the UAP for vital signs?
A. A 68-year-old post-op day 2 cholecystectomy patient with stable vitals
B. A 55-year-old with pneumonia responding to antibiotics, afebrile x24 hours
C. A 72-year-old admitted 1 hour ago with new onset confusion and slurred speech
D. A 45-year-old with Type 2 diabetes, fasting glucose 180, awaiting breakfast
B. A 55-year-old with pneumonia responding to antibiotics, afebrile x24 hours
C. A 72-year-old admitted 1 hour ago with new onset confusion and slurred speech
D. A 45-year-old with Type 2 diabetes, fasting glucose 180, awaiting breakfast
Answer: C
Rationale: New onset confusion and slurred speech are red-flag neurological symptoms suggesting possible stroke. This patient is unstable and requires immediate RN assessment - not UAP monitoring. The other patients are stable with predictable, routinized needs.
Question 6
Which nursing action can the RN appropriately delegate to an LPN on a medical unit? Select all that apply.
A. Administering IV push furosemide to a patient in fluid overload
B. Administering scheduled oral medications to stable patients
C. Completing the admission assessment for a new patient with chest pain
D. Reinforcing (not initiating) teaching about a low-sodium diet
E. Monitoring a stable patient's wound drain output and reporting to the RN
F. Titrating a heparin drip based on aPTT results
B. Administering scheduled oral medications to stable patients
C. Completing the admission assessment for a new patient with chest pain
D. Reinforcing (not initiating) teaching about a low-sodium diet
E. Monitoring a stable patient's wound drain output and reporting to the RN
F. Titrating a heparin drip based on aPTT results
Answers: B, D, E
Rationale:
- B - Scheduled oral meds to stable patients = within LPN scope
- D - Reinforcing (not initiating) existing teaching = LPN scope; initial teaching belongs to RN
- E - Monitoring and reporting drain output on a stable patient = LPN scope
- A - IV push medications are not in LPN scope in most states
- C - Initial assessment is an RN-only responsibility
- F - Titrating IV drips requires clinical judgment; RN only
Question 7
A patient with active C. difficile needs transport to CT scan. The RN should:
A. Personally transport the patient to maintain infection control standards
B. Delegate transport to the UAP after ensuring contact precautions are in place
C. Call the physician before the patient can leave the unit
D. Postpone the CT until the C. diff resolves
B. Delegate transport to the UAP after ensuring contact precautions are in place
C. Call the physician before the patient can leave the unit
D. Postpone the CT until the C. diff resolves
Answer: B
Rationale: Transporting a patient to CT is a non-judgment task that a UAP can safely perform. The RN's responsibility is to coordinate care and ensure contact precautions (gown + gloves) are applied - which is appropriate to do before handoff. There is no reason to call the physician or delay medically indicated imaging. Source: GoodNurse.com 2026
Question 8
A nurse manager observes the RN delegating the following task. Which delegation requires immediate intervention?
A. RN asks the UAP to obtain a routine fingerstick blood glucose on a stable diabetic patient
B. RN asks the LPN to administer scheduled PO acetaminophen to a post-op day 3 patient
C. RN asks the UAP to perform a focused respiratory assessment on a patient with new dyspnea
D. RN asks the LPN to reinforce walking technique after the RN completed initial physical therapy teaching
B. RN asks the LPN to administer scheduled PO acetaminophen to a post-op day 3 patient
C. RN asks the UAP to perform a focused respiratory assessment on a patient with new dyspnea
D. RN asks the LPN to reinforce walking technique after the RN completed initial physical therapy teaching
Answer: C
Rationale: Assessment requires professional nursing judgment and cannot be delegated to a UAP under any circumstances. "New dyspnea" indicates a change in condition - an unstable, unpredictable finding. The RN must personally assess this patient. All other delegations are appropriate.
PART B - PRIORITY SETTING (Which Patient First?)
Question 9
The RN on a medical floor is notified of the following situations at the same time. Which requires the nurse's IMMEDIATE attention?
A. A patient with heart failure who gained 1.5 kg overnight and has 2+ pedal edema
B. A patient with COPD whose SpO2 dropped from 94% to 86% on 2L O2, with increased respiratory effort
C. A patient with hypertension whose blood pressure is 162/94 mmHg (baseline is 155-165/90-95)
D. A patient with chronic low back pain requesting their scheduled morphine 30 minutes early
B. A patient with COPD whose SpO2 dropped from 94% to 86% on 2L O2, with increased respiratory effort
C. A patient with hypertension whose blood pressure is 162/94 mmHg (baseline is 155-165/90-95)
D. A patient with chronic low back pain requesting their scheduled morphine 30 minutes early
Answer: B
Rationale: SpO2 of 86% with increased respiratory effort is acute respiratory compromise - the highest priority. This is a new, worsening change from the patient's baseline. Heart failure with chronic edema and weight gain needs prompt attention but is not immediately life-threatening. The hypertensive patient is at their baseline. Controlled pain management can wait.
Question 10
The RN is assigned four postoperative patients. Which patient should be assessed FIRST?
A. Post-appendectomy day 1, pain 5/10, tolerating clear liquids
B. Post-total knee replacement day 2, requesting assistance to ambulate
C. Post-cholecystectomy day 1, temperature 38.1°C (100.6°F), mild incisional pain
D. Post-abdominal hysterectomy, just returned from the PACU 20 minutes ago, BP 88/54 mmHg, HR 118
B. Post-total knee replacement day 2, requesting assistance to ambulate
C. Post-cholecystectomy day 1, temperature 38.1°C (100.6°F), mild incisional pain
D. Post-abdominal hysterectomy, just returned from the PACU 20 minutes ago, BP 88/54 mmHg, HR 118
Answer: D
Rationale: A fresh post-op patient (20 minutes from PACU) with BP 88/54 and HR 118 indicates possible hemorrhagic shock - this is the highest priority. Newly returned PACU patients are always high-risk; hemodynamic instability (hypotension + tachycardia) demands immediate RN assessment. The other patients are stable with expected post-op findings.
Question 11
The RN receives a call from the UAP about a patient with a new cast on their left forearm. The UAP reports the patient has severe pain, pale fingers, and states they "can't feel" their fingertips. What is the priority nursing action?
A. Administer the PRN opioid analgesic ordered for cast pain
B. Elevate the extremity above heart level and reassess in 30 minutes
C. Immediately assess the patient for signs of compartment syndrome and notify the provider
D. Document the finding and add it to the end-of-shift report
B. Elevate the extremity above heart level and reassess in 30 minutes
C. Immediately assess the patient for signs of compartment syndrome and notify the provider
D. Document the finding and add it to the end-of-shift report
Answer: C
Rationale: Severe pain, pallor, and paresthesia (the "Ps" of neurovascular compromise) after casting are classic signs of compartment syndrome - a limb-threatening emergency. The nurse must assess immediately and escalate to the provider. Giving pain medication without addressing the cause delays treatment and can mask worsening symptoms. Elevating above heart level is actually contraindicated in compartment syndrome (reduces perfusion further). Source: GoodNurse.com 2026
Question 12
The nurse is caring for a patient with Type 1 diabetes on an insulin drip for DKA. The UAP reports the blood glucose is 58 mg/dL and the patient is diaphoretic. The priority action is:
A. Slow the insulin drip rate and reassess glucose in 1 hour
B. Stop the insulin drip, treat the hypoglycemia per protocol immediately, and notify the provider
C. Ask the UAP to give the patient orange juice
D. Document the finding and continue current management
B. Stop the insulin drip, treat the hypoglycemia per protocol immediately, and notify the provider
C. Ask the UAP to give the patient orange juice
D. Document the finding and continue current management
Answer: B
Rationale: BG of 58 mg/dL with diaphoresis = symptomatic hypoglycemia, which is immediately dangerous (brain requires continuous glucose). Stop the insulin drip first, treat hypoglycemia per protocol (likely IV dextrose in a DKA patient who may have altered consciousness), and notify the provider. The UAP should not independently administer oral intake without RN assessment. This is time-critical. Source: GoodNurse.com 2026
Question 13
The nurse receives morning report on five patients. Using priority-setting principles, rank these patients from HIGHEST to LOWEST priority for initial assessment.
- Patient with HIV/AIDS, CD4 count 85, temperature 102.4°F (39.1°C), new cough
- Patient with stable CHF, SpO2 94% on 2L O2 at their usual baseline
- Patient with schizophrenia expressing active suicidal ideation with a specific plan
- Patient post-laparoscopic appendectomy day 1, pain 4/10, tolerating diet
- Patient in a new cast with pain 8/10, toes cool and pale
Correct order: 5 → 3 → 1 → 2 → 4
Rationale:
- 5 first - Cool, pale toes in a new cast = possible compartment syndrome, limb-threatening emergency requiring immediate vascular assessment
- 3 second - Active suicidal ideation with a plan = immediate safety risk, 1:1 precautions needed now
- 1 third - Fever in an immunocompromised patient (CD4 <200 = AIDS) with new cough = possible opportunistic infection / sepsis risk; needs rapid assessment
- 2 fourth - Stable CHF at baseline; needs attention but not urgent
- 4 last - Expected post-op day 1 findings; stable and predictable
Question 14
The charge RN receives calls from three staff nurses simultaneously. Which call takes priority?
A. "My patient with COPD has a respiratory rate of 22 and SpO2 92% - she says she feels 'about the same.'"
B. "My patient just had a generalized tonic-clonic seizure - it stopped 90 seconds ago and he's now post-ictal but breathing."
C. "My patient with heart failure is reporting sudden onset chest pain 8/10 and diaphoresis."
D. "My patient's IV infiltrated and the site is swollen - she's due for her next antibiotic dose."
B. "My patient just had a generalized tonic-clonic seizure - it stopped 90 seconds ago and he's now post-ictal but breathing."
C. "My patient with heart failure is reporting sudden onset chest pain 8/10 and diaphoresis."
D. "My patient's IV infiltrated and the site is swollen - she's due for her next antibiotic dose."
Answer: C
Rationale: Sudden chest pain with diaphoresis in a cardiac patient = potential acute MI or serious cardiac event - the highest priority. The post-ictal patient is actively being monitored and breathing; the airway is patent. The COPD patient is at their baseline. IV infiltration is uncomfortable but not life-threatening.
Question 15
The nurse enters a patient's room and finds them unresponsive, not breathing, with no palpable carotid pulse. After calling for help, what is the FIRST action?
A. Apply supplemental oxygen via non-rebreather mask
B. Begin chest compressions at a rate of 100-120 per minute
C. Attach the cardiac monitor to determine the rhythm
D. Obtain IV access and prepare IV fluids
B. Begin chest compressions at a rate of 100-120 per minute
C. Attach the cardiac monitor to determine the rhythm
D. Obtain IV access and prepare IV fluids
Answer: B
Rationale: For an unresponsive, apneic, pulseless patient - start CPR immediately with chest compressions. Per current AHA guidelines (CAB sequence: Compressions first, then Airway, then Breathing), compressions take priority over all other interventions. Oxygenation and monitoring are important but come after initiating compressions.
PART C - COMBINED DELEGATION + PRIORITY (NGN-Style Scenarios)
Question 16 - Matrix Grid Style
The nurse is caring for four patients at the start of the shift. For each patient, indicate whether the action should be performed by the RN, LPN, or UAP.
| Patient / Task | RN | LPN | UAP |
|---|---|---|---|
| Patient with new onset confusion - perform initial neurological assessment | |||
| Stable patient with UTI - administer scheduled oral trimethoprim/sulfamethoxazole | |||
| Post-op day 2 hip replacement - assist with ambulation to hallway | |||
| CHF patient gaining 2 kg overnight - interpret significance and call provider | |||
| Stable wound healing normally - reinforce dressing while RN is occupied |
Answers:
| Task | Answer |
|---|---|
| Neurological assessment (new onset confusion) | RN - Initial assessment, change in condition |
| Scheduled oral antibiotic (stable patient) | LPN - Routine oral medication |
| Assist with ambulation (stable, day 2) | UAP - Non-invasive, predictable |
| Interpret weight gain + call provider | RN - Requires nursing judgment and clinical decision-making |
| Reinforce stable wound dressing | LPN - Routine dressing on stable, predictable wound |
Question 17 - Unfolding Case Study (NGN Format)
Read the following scenario. Answer questions 17a through 17c.
A 78-year-old male with a history of atrial fibrillation and CHF is admitted for diuresis. Current medications include furosemide 40 mg IV daily, digoxin 0.125 mg PO daily, and warfarin. This morning's labs: K+ 3.1, INR 3.4, digoxin level 1.9 ng/mL, Na+ 138. VS: BP 118/72, HR 58, RR 16, SpO2 96%.
17a. The nurse reviews the lab results. Which finding requires the MOST urgent action?
A. Na+ 138 mEq/L
B. K+ 3.1 mEq/L
C. INR 3.4
D. Digoxin level 1.9 ng/mL
B. K+ 3.1 mEq/L
C. INR 3.4
D. Digoxin level 1.9 ng/mL
Answer: B
Rationale: K+ 3.1 = hypokalemia (below normal 3.5-5.0). This is MOST urgent in this patient because hypokalemia potentiates digoxin toxicity - even a digoxin level within the therapeutic range (0.5-2.0 ng/mL) becomes dangerous when potassium is low. Combined with HR of 58, this patient is at risk for serious cardiac arrhythmias. Immediate potassium replacement is needed.
17b. Which actions should the nurse take at this time? Select all that apply.
A. Administer the digoxin as scheduled
B. Hold the digoxin and notify the provider
C. Administer the scheduled furosemide as ordered
D. Report the low potassium and hold furosemide pending provider clarification
E. Apply supplemental oxygen
F. Place the patient on continuous cardiac monitoring
B. Hold the digoxin and notify the provider
C. Administer the scheduled furosemide as ordered
D. Report the low potassium and hold furosemide pending provider clarification
E. Apply supplemental oxygen
F. Place the patient on continuous cardiac monitoring
Answers: B, D, F
Rationale:
- B - Hold digoxin: HR is 58 (below 60 = hold), plus hypokalemia increases toxicity risk
- D - Furosemide (loop diuretic) will further lower potassium - hold and clarify
- F - Cardiac monitoring is prudent given hypokalemia + digoxin risk for arrhythmia
- A - Incorrect: never give digoxin when HR <60
- C - Incorrect: furosemide worsens hypokalemia
- E - SpO2 is 96% and patient is not in distress; O2 not indicated
17c. The provider is notified. Which task can the RN appropriately delegate to the LPN?
A. Performing a reassessment of the patient's apical pulse after 30 minutes
B. Administering IV potassium chloride per the new provider order
C. Educating the patient about high-potassium foods to eat at home
D. Recording the patient's intake and output for the past 8 hours
B. Administering IV potassium chloride per the new provider order
C. Educating the patient about high-potassium foods to eat at home
D. Recording the patient's intake and output for the past 8 hours
Answer: D
Rationale: Recording I&O is a documentation/monitoring task appropriate for LPN. IV potassium administration requires careful RN-level monitoring (cardiac monitoring required; extravasation risk). Post-intervention reassessment and discharge education require RN judgment.
Question 18
The nurse receives a call from the UAP: "Mr. Santos in 412 is saying he feels like his heart is 'fluttering' and he looks pale and sweaty." The nurse's FIRST action is:
A. Tell the UAP to obtain the patient's vital signs and report back
B. Go to the patient's room immediately and assess the patient
C. Call the provider to report the change in condition
D. Ask the UAP to apply a cardiac monitor
B. Go to the patient's room immediately and assess the patient
C. Call the provider to report the change in condition
D. Ask the UAP to apply a cardiac monitor
Answer: B
Rationale: New onset palpitations with pallor and diaphoresis indicate a potentially serious cardiac event. The nurse must personally assess the patient immediately - you cannot direct care for an unstable, potentially deteriorating patient through a UAP. Calling the provider before assessing provides incomplete information. The UAP should not apply or interpret a cardiac monitor. Assess first, then escalate.
Question 19
The nurse is preparing to make assignments for the shift. A float nurse from the oncology unit is working the medical-surgical floor. Which patient is MOST appropriate to assign to the float nurse?
A. A patient with new-onset sepsis requiring a vasopressor titration
B. A post-op patient 4 hours after coronary artery bypass graft (CABG)
C. A stable patient with community-acquired pneumonia on oral antibiotics, day 3
D. A patient with end-stage renal disease awaiting dialysis access placement today
B. A post-op patient 4 hours after coronary artery bypass graft (CABG)
C. A stable patient with community-acquired pneumonia on oral antibiotics, day 3
D. A patient with end-stage renal disease awaiting dialysis access placement today
Answer: C
Rationale: Float nurses should be assigned the most stable patients with the most predictable needs. A patient with CAP on oral antibiotics (day 3) is stable and predictable - safe for a float. The sepsis patient (vasopressor titration), fresh post-CABG (complex monitoring), and ESRD patient awaiting an invasive procedure all require specialized, high-level nursing judgment that should not be assigned to a nurse unfamiliar with the unit's protocols.
Question 20 - Drop-Down Cloze Style (NGN)
Complete the following sentence by selecting the most appropriate response for each blank.
The nurse enters the room of a patient who had a total thyroidectomy 3 hours ago and finds the patient is experiencing muscle twitching, tingling around the mouth, and a positive Chvostek's sign. The nurse recognizes this as __________ and the priority intervention is __________.
Blank 1 options: A) hypocalcemia, B) hyperkalemia, C) hypomagnesemia, D) hyponatremia
Blank 2 options: A) administer calcium gluconate IV as ordered and notify provider, B) apply oxygen and call a rapid response, C) reposition the patient and reassess in 15 minutes, D) administer IV magnesium sulfate
Answers: A (hypocalcemia) and A (administer calcium gluconate)
Rationale: After thyroidectomy, accidental removal or damage to the parathyroid glands causes hypocalcemia. Chvostek's sign (facial twitch on tapping the cheek near the facial nerve) and Trousseau's sign (carpal spasm with BP cuff inflation) are classic findings. The immediate intervention is IV calcium gluconate per provider order. Calcium gluconate should always be at the bedside post-thyroidectomy. This is also the antidote to magnesium sulfate toxicity.
PART D - QUICK-FIRE SCENARIOS (10 Questions, Rapid Review)
Q21. A patient with active suicidal ideation states, "I have a plan and I know how to do it." The FIRST action is:
→ Initiate 1:1 monitoring and ensure immediate safety (remove access to means; notify provider). Do not leave the patient alone.
Q22. The UAP reports a patient's BP is 210/118. The nurse's first action is:
→ Go assess the patient immediately. Determine if there are signs of hypertensive emergency (headache, visual changes, chest pain, confusion). Then notify the provider.
Q23. The RN is preparing to do discharge teaching for a new diabetic patient. The LPN offers to do it. The appropriate response is:
→ RN must perform initial teaching. LPN can reinforce teaching that has already been provided, but initial patient education belongs to the RN.
Q24. Four patients need PRN medications. Who gets medicated FIRST?
- A. Pain 8/10 post-op day 1 (stable, VS normal)
- B. Chest pain 6/10, diaphoretic, HR 110
- C. Headache 5/10, BP 138/86, stable
- D. Nausea after chemotherapy
→ B. Chest pain with diaphoresis and tachycardia = cardiac emergency, not just pain management.
Q25. Which patient can be safely discharged to create a bed for an incoming emergency?
- A. Patient 2 hours post-op from knee replacement
- B. Patient with pneumonia who is afebrile x24 hrs, SpO2 96% on RA, tolerating PO
- C. Patient with new insulin regimen who hasn't completed diabetes teaching
- D. Patient awaiting cardiac catheterization tomorrow
→ B. Medically stable, treatment complete, tolerating oral intake. All others have unmet needs that require continued inpatient monitoring or care.
Q26. The nurse is about to give digoxin. The apical pulse is 56. The action is:
→ Hold the digoxin and notify the provider. The threshold is HR <60 - never administer digoxin when the heart rate is below 60 bpm.
Q27. Which patient should be seen LAST?
- A. Post-op patient with fever 38.8°C on day 1
- B. Patient with COPD at their baseline, requesting water
- C. Patient reporting sudden vision loss in one eye
- D. Patient on a heparin drip with aPTT result just returned
→ B. The stable COPD patient requesting water has the least urgent need. Sudden monocular vision loss (C) is a possible stroke/retinal emergency. Post-op fever (A) needs assessment. aPTT result (D) may require drip titration.
Q28. The nurse can delegate taking vital signs to the UAP for which patient?
- A. A patient 30 minutes post-cardiac catheterization
- B. A patient with new-onset atrial fibrillation
- C. A patient with stable hypertension, day 3 of admission, awaiting discharge
- D. A patient just transferred from the PACU
→ C. Stable, predictable, nearing discharge. All others represent unstable or newly changed conditions requiring RN-level monitoring.
Q29. Which is the RN's priority action when a patient on a ventilator sets off the high-pressure alarm?
→ Assess the patient first (not the machine). Check for coughing, biting the tube, secretions, or worsening respiratory distress. If unable to identify and correct the cause quickly, manually ventilate with a bag-valve-mask and call for help.
Q30. The RN's patient load includes: a post-op bowel resection day 1, a patient with a UTI on IV antibiotics, a patient with stable angina awaiting stress test, and a new admission with uncontrolled blood glucose of 540 mg/dL and Kussmaul respirations. Who is the HIGHEST priority?
→ The new admission with BG 540 and Kussmaul respirations - this is DKA, a life-threatening metabolic emergency. Kussmaul (deep, labored) respirations indicate severe metabolic acidosis. Immediate IV fluid resuscitation, insulin, and electrolyte monitoring are required.
Strategy Summary Card
ALWAYS RN:          Assess · Teach · Evaluate · Unstable patients
                    New symptoms · IV push meds · Care planning
                    Titrate drips · First dose of new meds · Blood

LPN CAN DO:         Routine oral/SQ/IM meds · Reinforce teaching
                    Stable dressing changes · Monitor & report
                    Routine procedures (predictable, stable)

UAP CAN DO:         Vitals (stable patients) · Bathing/hygiene
                    Ambulation (confirmed orders) · I&O recording
                    Specimen collection · Positioning

PRIORITY TRIGGERS:  Stridor · SpO2 <90% acutely · HR >120 or <50
                    Chest pain + diaphoresis · BP extremes with symptoms
                    New confusion · Active bleeding · BG <70 or >400
                    Fever in neutropenia · Suicidal plan · Limb pallor/pain
Resources for more practice questions:
- NursesLabs - 100 Prioritization & Delegation Questions - free, large question bank
- GoodNurse 2026 Scenarios - 25 mini-scenarios with rationales
- SimpleNursing - Patient Prioritization - visual-style explanations
This is a shared conversation. Sign in to Orris to start your own chat.