
How spo2 works , detailed explanation
Reading File
Finding Sources
Searching Images
pulse oximeter mechanism light absorption oxyhemoglobin deoxyhemoglobin diagram
Searching the Web
how pulse oximetry SpO2 works mechanism light absorption
Reading File
Reading File
Reading File
Reading File
Reading File
query_images_db
Searching PubMed
pulse oximetry accuracy skin pigmentation
Now I have enough to give a complete, well-grounded explanation.
How SpO₂ (Pulse Oximetry) Works
SpO₂ stands for peripheral capillary oxygen saturation - the percentage of hemoglobin in arterial blood that is carrying oxygen (bound as oxyhemoglobin), estimated non-invasively via a finger, earlobe, or forehead probe. It's often called the "fifth vital sign."
1. The core physics: two colors of light
Oxygenated hemoglobin (O₂Hb) and deoxygenated hemoglobin (deO₂Hb) absorb light differently depending on wavelength - this is why oxygenated blood looks bright red and deoxygenated blood looks dark red/blue. A pulse oximeter probe has two LEDs and one photodetector on opposite sides of the tissue:
- Red light (~660 nm): absorbed much more by deoxygenated hemoglobin
- Infrared light (~940 nm): absorbed much more by oxygenated hemoglobin
The device rapidly alternates the two LEDs (often flickering at up to several hundred Hz, with brief "both off" intervals to subtract ambient light) and measures how much of each wavelength gets through the tissue (Costanzo Physiology, p. 226; Miller's Anesthesia, 10e).
2. The Beer-Lambert Law
The underlying math is the Beer-Lambert law, which relates transmitted light intensity to the concentration of an absorbing substance in solution:
I_trans = I_in × e^(-D·C·ε)
where D = path length (tissue thickness), C = concentration of the solute (hemoglobin species), and ε = the extinction coefficient of that solute at a given wavelength. Since blood contains multiple hemoglobin species (oxy-, deoxy-, carboxy-, met-, sulfhemoglobin), fully solving this requires absorption measurements at multiple wavelengths - that's what a lab co-oximeter does (5 wavelengths, considered the gold standard). A pulse oximeter simplifies this to just two wavelengths and therefore only estimates functional saturation: O₂Hb / (O₂Hb + deO₂Hb) × 100, ignoring the minor dyshemoglobin species (Miller's Anesthesia, 10e).
3. Isolating arterial blood: photoplethysmography
A key trick: skin, bone, venous blood, and capillary blood also absorb light, but they don't pulse. Only arterial blood volume changes with each heartbeat. The oximeter measures light absorption continuously and separates it into:
- A DC (constant) component - absorption from tissue, bone, venous/capillary blood
- A pulsatile AC component - the small extra absorption that appears only with each arterial pulse (this is the photoplethysmographic waveform you see as the oximeter's waveform trace)
By analyzing only the AC pulsatile fraction at each wavelength, the device isolates the signal attributable to arterial blood, effectively subtracting out the non-pulsating background (Costanzo Physiology, p. 226; Miller's Anesthesia, 10e).
4. The "ratio of ratios" and calibration
The device computes a ratio, often called R:
R = (AC_red/DC_red) / (AC_infrared/DC_infrared)
Because real tissue causes light scattering (not just simple absorption as Beer-Lambert assumes), manufacturers don't calculate SpO₂ from pure theory. Instead, each oximeter is calibrated empirically: R values are correlated against actual arterial oxygen saturation (SaO₂) measured by co-oximetry in healthy volunteers across a range of saturations, producing a built-in calibration curve/algorithm that converts R directly to a displayed SpO₂ percentage.
5. From SpO₂ back to PaO₂ - the oxyhemoglobin dissociation curve
SpO₂ doesn't directly measure the partial pressure of oxygen in blood (PaO₂); it measures percent saturation. The two are linked by the sigmoid-shaped oxyhemoglobin dissociation curve, so clinicians can roughly estimate PaO₂ from SpO₂ (e.g., SpO₂ 90% ≈ PaO₂ 60 mmHg - the steep part of the curve, where saturation drops quickly). Because the curve is flat at the top, SpO₂ is poor at detecting hyperoxia (can't distinguish PaO₂ of 100 from 300 mmHg), but very sensitive to falling oxygenation at the steep, lower portion of the curve (Costanzo Physiology, p. 226-227).
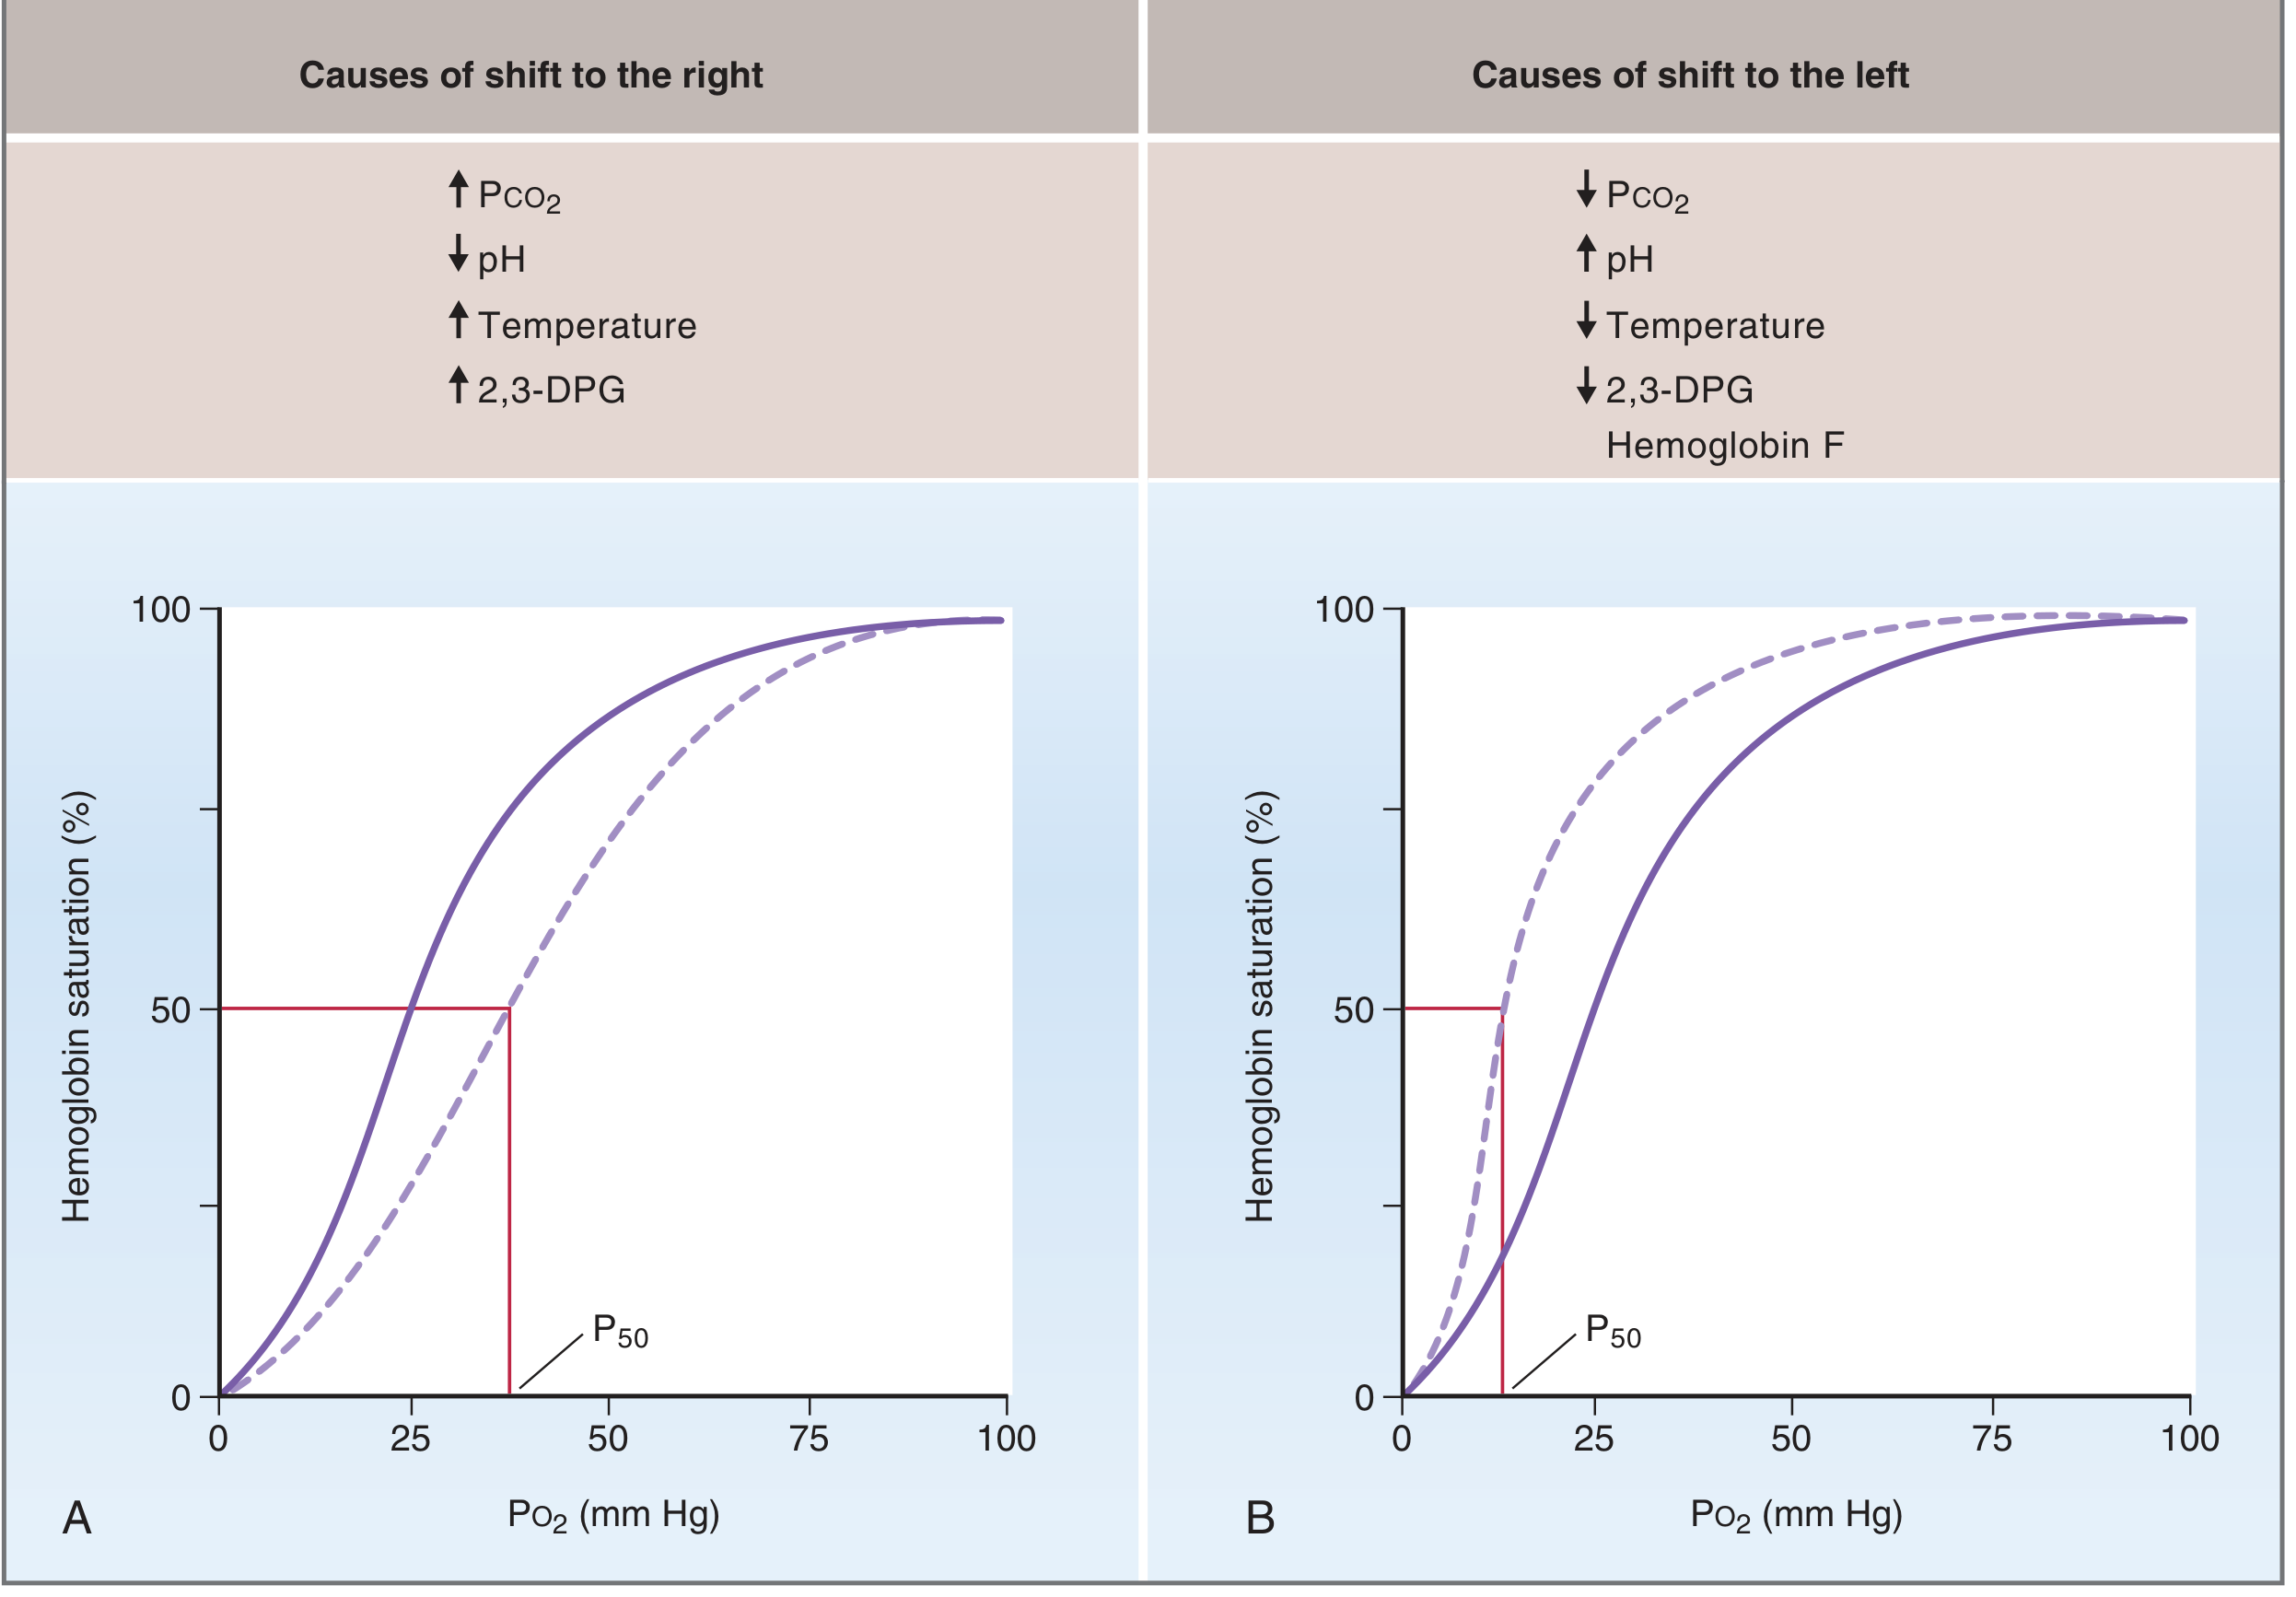
6. Why SpO₂ can be wrong: key limitations
- Carboxyhemoglobin (CO poisoning): absorbs light similarly to oxyhemoglobin at these wavelengths, so standard pulse oximeters read a falsely high SpO₂ even when the patient is critically hypoxic - a major clinical pitfall.
- Methemoglobinemia: drives SpO₂ toward ~85% regardless of true saturation.
- Poor perfusion / hypotension / cold extremities / vasoconstriction: weak pulsatile signal reduces accuracy or gives no reading.
- Motion artifact, ambient light, nail polish (especially dark colors), and skin pigmentation: can degrade or bias the signal.
- Lag time: SpO₂ can take minutes to fall after ventilation stops, especially if the patient was preoxygenated - so it is not a substitute for direct ventilation monitoring like capnography (Roberts & Hedges' Clinical Procedures in Emergency Medicine, p. 711-712).
- Anemia and dyshemoglobinemias affect oxygen content and delivery even when SpO₂ looks normal, since SpO₂ only reflects the fraction of available hemoglobin that's saturated, not total oxygen-carrying capacity.
Note on an active area of research: Several recent systematic reviews and meta-analyses (2024-2025, e.g., British Journal of Anaesthesia 2024, PMID 38368234; JMIR 2024, PMID 39388258; Clinical Nursing Research 2025, PMID 41045137) have found that pulse oximeters can overestimate true oxygen saturation in patients with darker skin pigmentation, particularly during hypoxemia, likely because melanin also absorbs light at these wavelengths and calibration datasets historically underrepresented darker skin tones. This is a recognized limitation that clinicians should factor in, especially in critically ill patients, and regulatory bodies (FDA) have been revising testing/labeling standards in response.
Quick summary
Two LEDs (red + infrared) shine through a pulsating capillary bed → a photodetector measures how much of each wavelength gets through → the device isolates the pulsatile (arterial) component of the signal → it computes a ratio of red-to-infrared absorption → that ratio is matched against an empirical calibration curve to output an SpO₂ percentage, which approximates the fraction of hemoglobin carrying oxygen.
Detailed explanation of reports of CBC and PBF , teach easy way of reading
Finding Sources
Finding Sources
CBC & Peripheral Blood Film - Topic Map
Reading a CBC and PBF (peripheral blood film/smear) well is really about mastering a system, not memorizing values. Here's how the topic breaks down:
- CBC basics - the RBC line (Hb, Hct, RBC count, and the indices: MCV, MCH, MCHC, RDW) - tells you if anemia exists and its likely category (microcytic/normocytic/macrocytic)
- CBC - the WBC line (total WBC count + differential: neutrophils, lymphocytes, monocytes, eosinophils, basophils) - tells you about infection, inflammation, allergy, or marrow pathology
- CBC - the platelet line (platelet count, MPV) - bleeding/clotting risk, marrow production
- A step-by-step system for reading any CBC report - the "vertical scan" method clinicians use to avoid missing things
- PBF - red cell morphology (size, shape, color/hemoglobinization, inclusions - e.g., spherocytes, target cells, schistocytes, Howell-Jolly bodies) - the visual fingerprint of anemia type
- PBF - white cell morphology (toxic granulation, blasts, hypersegmented neutrophils, atypical lymphocytes) - visual clues to infection vs. leukemia vs. reactive states
- PBF - platelet morphology/estimate on smear - clumping, giant platelets, true vs. spurious thrombocytopenia
- Putting CBC + PBF together - pattern recognition (e.g., microcytic anemia + target cells = thalassemia; macrocytic + hypersegmented neutrophils = B12/folate deficiency)
Quick overview: A CBC report has three main "lines" - red cells, white cells, and platelets - each with a count plus derived indices. The fastest way to read one without getting lost is to always scan the same order every time (Hb → indices → WBC total → differential → platelets) rather than randomly. The PBF is the microscope's version of the same three lines - it shows you why the numbers look the way they do, by letting you see the actual shape, size, and color of the cells, plus catch things a machine counter can miss (abnormal cells, parasites, clumped platelets).
This is a lot of ground to cover well in one go - which part do you want me to go deep on first?
Asking for Preferences
Which part should I explain in detail first, with a step-by-step reading method?
Now I have enough to give a complete, well-grounded explanation.
How SpO₂ (Pulse Oximetry) Works
SpO₂ stands for peripheral capillary oxygen saturation - the percentage of hemoglobin in arterial blood that is carrying oxygen (bound as oxyhemoglobin), estimated non-invasively via a finger, earlobe, or forehead probe. It's often called the "fifth vital sign."
1. The core physics: two colors of light
Oxygenated hemoglobin (O₂Hb) and deoxygenated hemoglobin (deO₂Hb) absorb light differently depending on wavelength - this is why oxygenated blood looks bright red and deoxygenated blood looks dark red/blue. A pulse oximeter probe has two LEDs and one photodetector on opposite sides of the tissue:
- Red light (~660 nm): absorbed much more by deoxygenated hemoglobin
- Infrared light (~940 nm): absorbed much more by oxygenated hemoglobin
The device rapidly alternates the two LEDs (often flickering at up to several hundred Hz, with brief "both off" intervals to subtract ambient light) and measures how much of each wavelength gets through the tissue (Costanzo Physiology, p. 226; Miller's Anesthesia, 10e).
2. The Beer-Lambert Law
The underlying math is the Beer-Lambert law, which relates transmitted light intensity to the concentration of an absorbing substance in solution:
I_trans = I_in × e^(-D·C·ε)
where D = path length (tissue thickness), C = concentration of the solute (hemoglobin species), and ε = the extinction coefficient of that solute at a given wavelength. Since blood contains multiple hemoglobin species (oxy-, deoxy-, carboxy-, met-, sulfhemoglobin), fully solving this requires absorption measurements at multiple wavelengths - that's what a lab co-oximeter does (5 wavelengths, considered the gold standard). A pulse oximeter simplifies this to just two wavelengths and therefore only estimates functional saturation: O₂Hb / (O₂Hb + deO₂Hb) × 100, ignoring the minor dyshemoglobin species (Miller's Anesthesia, 10e).
3. Isolating arterial blood: photoplethysmography
A key trick: skin, bone, venous blood, and capillary blood also absorb light, but they don't pulse. Only arterial blood volume changes with each heartbeat. The oximeter measures light absorption continuously and separates it into:
- A DC (constant) component - absorption from tissue, bone, venous/capillary blood
- A pulsatile AC component - the small extra absorption that appears only with each arterial pulse (this is the photoplethysmographic waveform you see as the oximeter's waveform trace)
By analyzing only the AC pulsatile fraction at each wavelength, the device isolates the signal attributable to arterial blood, effectively subtracting out the non-pulsating background (Costanzo Physiology, p. 226; Miller's Anesthesia, 10e).
4. The "ratio of ratios" and calibration
The device computes a ratio, often called R:
R = (AC_red/DC_red) / (AC_infrared/DC_infrared)
Because real tissue causes light scattering (not just simple absorption as Beer-Lambert assumes), manufacturers don't calculate SpO₂ from pure theory. Instead, each oximeter is calibrated empirically: R values are correlated against actual arterial oxygen saturation (SaO₂) measured by co-oximetry in healthy volunteers across a range of saturations, producing a built-in calibration curve/algorithm that converts R directly to a displayed SpO₂ percentage.
5. From SpO₂ back to PaO₂ - the oxyhemoglobin dissociation curve
SpO₂ doesn't directly measure the partial pressure of oxygen in blood (PaO₂); it measures percent saturation. The two are linked by the sigmoid-shaped oxyhemoglobin dissociation curve, so clinicians can roughly estimate PaO₂ from SpO₂ (e.g., SpO₂ 90% ≈ PaO₂ 60 mmHg - the steep part of the curve, where saturation drops quickly). Because the curve is flat at the top, SpO₂ is poor at detecting hyperoxia (can't distinguish PaO₂ of 100 from 300 mmHg), but very sensitive to falling oxygenation at the steep, lower portion of the curve (Costanzo Physiology, p. 226-227).
6. Why SpO₂ can be wrong: key limitations
- Carboxyhemoglobin (CO poisoning): absorbs light similarly to oxyhemoglobin at these wavelengths, so standard pulse oximeters read a falsely high SpO₂ even when the patient is critically hypoxic - a major clinical pitfall.
- Methemoglobinemia: drives SpO₂ toward ~85% regardless of true saturation.
- Poor perfusion / hypotension / cold extremities / vasoconstriction: weak pulsatile signal reduces accuracy or gives no reading.
- Motion artifact, ambient light, nail polish (especially dark colors), and skin pigmentation: can degrade or bias the signal.
- Lag time: SpO₂ can take minutes to fall after ventilation stops, especially if the patient was preoxygenated - so it is not a substitute for direct ventilation monitoring like capnography (Roberts & Hedges' Clinical Procedures in Emergency Medicine, p. 711-712).
- Anemia and dyshemoglobinemias affect oxygen content and delivery even when SpO₂ looks normal, since SpO₂ only reflects the fraction of available hemoglobin that's saturated, not total oxygen-carrying capacity.
Note on an active area of research: Several recent systematic reviews and meta-analyses (2024-2025, e.g., British Journal of Anaesthesia 2024, PMID 38368234; JMIR 2024, PMID 39388258; Clinical Nursing Research 2025, PMID 41045137) have found that pulse oximeters can overestimate true oxygen saturation in patients with darker skin pigmentation, particularly during hypoxemia, likely because melanin also absorbs light at these wavelengths and calibration datasets historically underrepresented darker skin tones. This is a recognized limitation that clinicians should factor in, especially in critically ill patients, and regulatory bodies (FDA) have been revising testing/labeling standards in response.
Quick summary
Two LEDs (red + infrared) shine through a pulsating capillary bed → a photodetector measures how much of each wavelength gets through → the device isolates the pulsatile (arterial) component of the signal → it computes a ratio of red-to-infrared absorption → that ratio is matched against an empirical calibration curve to output an SpO₂ percentage, which approximates the fraction of hemoglobin carrying oxygen.## CBC & Peripheral Blood Film - Topic Map
Reading a CBC and PBF (peripheral blood film/smear) well is really about mastering a system, not memorizing values. Here's how the topic breaks down:
- CBC basics - the RBC line (Hb, Hct, RBC count, and the indices: MCV, MCH, MCHC, RDW) - tells you if anemia exists and its likely category (microcytic/normocytic/macrocytic)
- CBC - the WBC line (total WBC count + differential: neutrophils, lymphocytes, monocytes, eosinophils, basophils) - tells you about infection, inflammation, allergy, or marrow pathology
- CBC - the platelet line (platelet count, MPV) - bleeding/clotting risk, marrow production
- A step-by-step system for reading any CBC report - the "vertical scan" method clinicians use to avoid missing things
- PBF - red cell morphology (size, shape, color/hemoglobinization, inclusions - e.g., spherocytes, target cells, schistocytes, Howell-Jolly bodies) - the visual fingerprint of anemia type
- PBF - white cell morphology (toxic granulation, blasts, hypersegmented neutrophils, atypical lymphocytes) - visual clues to infection vs. leukemia vs. reactive states
- PBF - platelet morphology/estimate on smear - clumping, giant platelets, true vs. spurious thrombocytopenia
- Putting CBC + PBF together - pattern recognition (e.g., microcytic anemia + target cells = thalassemia; macrocytic + hypersegmented neutrophils = B12/folate deficiency)
Quick overview: A CBC report has three main "lines" - red cells, white cells, and platelets - each with a count plus derived indices. The fastest way to read one without getting lost is to always scan the same order every time (Hb → indices → WBC total → differential → platelets) rather than randomly. The PBF is the microscope's version of the same three lines - it shows you why the numbers look the way they do, by letting you see the actual shape, size, and color of the cells, plus catch things a machine counter can miss (abnormal cells, parasites, clumped platelets).
This is a lot of ground to cover well in one go - which part do you want me to go deep on first?
Finding Sources
Finding Sources
Reading File
CBC & Peripheral Blood Film: A Simple System for Reading Reports
Think of both reports as having 3 cell lines (Red cells, White cells, Platelets). Read each report in that same fixed order every time — that habit alone will make you fast and thorough.
PART 1: Reading a CBC Report
Step 1 — Red Cell Line (Is there anemia? What type?)
| Parameter | What it means | Normal range (adult) |
|---|---|---|
| Hb (Hemoglobin) | Oxygen-carrying protein amount | M: 13.5–17.5 g/dL, F: 12–15.5 g/dL |
| Hct (Hematocrit) | % of blood volume that is RBCs | ~3x the Hb value |
| RBC count | Number of red cells/µL | 4.5–5.5 million/µL |
| MCV | Mean Corpuscular Volume — average size of each RBC | 80–100 fL |
| MCH | Average hemoglobin amount per cell | 27–33 pg |
| MCHC | Average hemoglobin concentration per cell (color/pallor) | 32–36 g/dL |
| RDW | Red cell Distribution Width — how much cell size varies | 11.5–14.5% |
The easy trick: Once you see low Hb (anemia is present), immediately look at MCV — this single number sorts almost every anemia into one of 3 buckets:
- MCV < 80 (microcytic) → think iron deficiency, thalassemia, chronic disease
- MCV 80–100 (normocytic) → think acute blood loss, chronic disease, hemolysis, marrow failure
- MCV > 100 (macrocytic) → think B12/folate deficiency, hypothyroidism, liver disease, reticulocytosis
Then use RDW as the tiebreaker: high RDW means the cells are mixed sizes (e.g., iron deficiency, early treated deficiency), while normal RDW means cells are uniformly small/normal/large (e.g., thalassemia trait, anemia of chronic disease).
Step 2 — White Cell Line (Infection? Inflammation? Marrow problem?)
Total WBC (normal ~4,000–11,000/µL) is only the headline — the differential (the % breakdown) is where the real information is. Always convert percentages to absolute counts (% × total WBC), because a "normal" total count can hide a dangerously low absolute neutrophil count.
| Cell type | Normal % | Elevated suggests | Low suggests |
|---|---|---|---|
| Neutrophils | 40–75% | Bacterial infection, stress, inflammation | Neutropenia, sepsis exhaustion, marrow suppression |
| Lymphocytes | 20–45% | Viral infection, chronic lymphocytic leukemia | Immunodeficiency, steroid use, HIV |
| Monocytes | 2–10% | Chronic infection (TB), recovery phase | GATA2 deficiency (rare) |
| Eosinophils | 1–6% | Allergy, parasites, drug reaction | — |
| Basophils | <1–2% | Allergic reaction, some leukemias | — |
Step 3 — Platelet Line (Bleeding or clotting risk?)
- Normal: 150,000–450,000/µL
- MPV (Mean Platelet Volume) — large platelets suggest the marrow is actively compensating for destruction (e.g., ITP); small platelets suggest a production problem.
The "vertical scan" habit
Read every CBC in this fixed order so you never miss a line: Hb → MCV/RDW → WBC total → differential (absolute counts) → platelet count/MPV. Takes 15 seconds once it's automatic.
PART 2: Reading a Peripheral Blood Film (PBF)
The PBF is simply looking under the microscope at what the CBC numbers are describing. It also catches things machines miss — abnormal cells, parasites, clumped platelets giving a false "low" count.
A. Red Cell Morphology — describe in this order every time:
- Size — Normocytic / Microcytic / Macrocytic, and anisocytosis (variation in size — corresponds to high RDW)
- Shape — poikilocytosis (abnormal shapes) — look for specific clues:
- Spherocytes → hereditary spherocytosis, autoimmune hemolysis
- Target cells → thalassemia, liver disease, hemoglobinopathies
- Schistocytes (fragmented cells) → microangiopathic hemolysis (DIC, TTP/HUS, mechanical heart valve)
- Sickle cells → sickle cell disease
- Teardrop cells → myelofibrosis, severe megaloblastic anemia
- Burr cells/echinocytes → renal failure, artifact
- Color (hemoglobinization) — normochromic vs hypochromic (pale, corresponds to low MCHC — iron deficiency, thalassemia) vs polychromasia (bluish-tinged young cells = active regeneration, e.g., hemolysis, bleeding)
- Inclusions:
- Howell-Jolly bodies (nuclear remnants) → asplenia/hyposplenism
- Basophilic stippling → lead poisoning, thalassemia
- Cabot rings → severe megaloblastic anemia
B. White Cell Morphology
- Toxic granulation / Döhle bodies in neutrophils → severe bacterial infection/sepsis
- Hypersegmented neutrophils (≥5 lobes) → B12/folate deficiency
- Blasts (immature, large nucleated cells) → leukemia — always urgent
- Atypical/reactive lymphocytes → viral infection (e.g., EBV/infectious mononucleosis)
- Left shift (increase in band forms/immature neutrophils) → active bacterial infection
C. Platelets on Film
- Estimate adequacy directly (roughly 1 platelet per 10–20 RBCs on a good field is normal)
- Clumped platelets on film but "low" count on the machine → spurious thrombocytopenia (EDTA artifact) — always check the film before treating a low automated platelet count as real
- Giant platelets → increased destruction/turnover (ITP) or some inherited disorders
Putting CBC + PBF Together — Pattern Recognition Cheat Sheet
| CBC Pattern | + PBF Finding | Likely Diagnosis |
|---|---|---|
| Microcytic, high RDW, low MCHC | Hypochromic, pencil cells | Iron deficiency anemia |
| Microcytic, normal RDW | Numerous target cells | Thalassemia trait |
| Macrocytic | Hypersegmented neutrophils, oval macrocytes | B12/folate deficiency |
| Normocytic, high reticulocytes | Spherocytes, polychromasia | Hereditary spherocytosis / hemolysis |
| Normocytic, thrombocytopenia | Schistocytes | TTP/HUS/DIC |
| High WBC, immature cells | Blasts | Acute leukemia |
| Any anemia + splenectomy history | Howell-Jolly bodies | Confirms hyposplenism |
Golden rule: the CBC tells you what the numbers are; the PBF tells you why — always correlate both before concluding a diagnosis, and always look at the film yourself when the CBC pattern doesn't fit a simple explanation or when counts look spuriously abnormal.
(Sources: Henry's Clinical Diagnosis and Management by Laboratory Methods; Tietz Textbook of Laboratory Medicine, 7e; GOLDMAN-CECIL Medicine; Quick Compendium of Clinical Pathology, 5e)
Want me to go deeper into any one piece — e.g., a full anemia workup algorithm, or a labeled image walkthrough of common PBF findings?
This is a shared conversation. Sign in to Orris to start your own chat.