
bipolar disorder
"bipolar disorder"[MeSH Terms] AND treatment
bipolar disorder mood episodes mania depression diagram
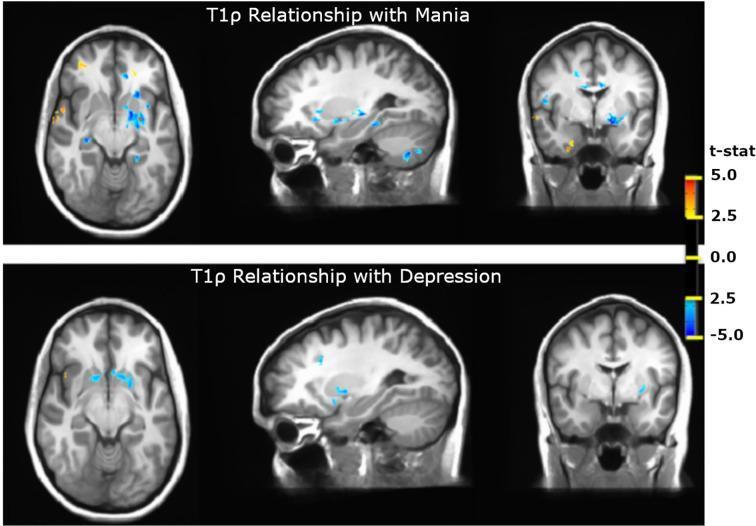
This diagnostic image set displays quantitative T1ρ (T1-rho) MR imaging maps, a specialized neuroimaging modality used to probe metabolic and pH-related changes in the brain. The visualization consists of two rows of brain slices in axial, sagittal, and coronal planes, contrasting 'T1ρ Relationship with Mania' (top) and 'T1ρ Relationship with Depression' (bottom) in the context of Bipolar Disorder. Functional data is overlaid on structural templates, with a color-coded t-statistic scale ranging from -5.0 (blue) to +5.0 (yellow/orange). In both mania and depression states, there is a consistent decrease in T1ρ signal (blue regions) within the basal ganglia and thalamus, indicating a negative t-statistic between -2.5 and -5.0. During the manic phase, additional signal decreases are visible in the hippocampus and cerebellum, while increased signal (yellow) is noted in the inferior frontal and temporal cortex. This comparison illustrates how T1ρ imaging can identify regional metabolic variations associated with specific psychiatric mood states.
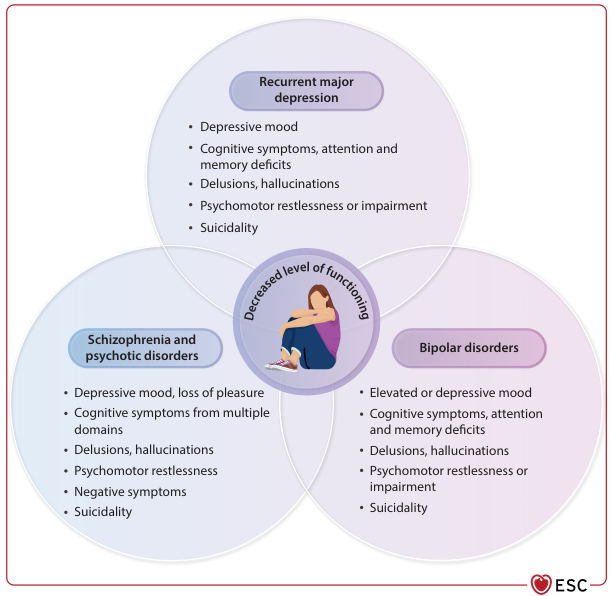
Summary : This Venn diagram compares the overlapping and distinct symptoms of three major psychiatric disorders—recurrent major depression, schizophrenia and psychotic disorders, and bipolar disorders—highlighting their shared impact on decreased level of functioning. venn diagram: # Disorders Compared : • Recurrent major depression • Schizophrenia and psychotic disorders • Bipolar disorders # Symptom Lists : ## Recurrent major depression : • Depressive mood • Cognitive symptoms, attention and memory deficits • Delusions, hallucinations • Psychomotor restlessness or impairment • Suicidality ## Schizophrenia and psychotic disorders : • Depressive mood, loss of pleasure • Cognitive symptoms from multiple domains • Delusions, hallucinations • Psychomotor restlessness • Negative symptoms • Suicidality ## Bipolar disorders : • Elevated or depressive mood • Cognitive symptoms, attention and memory deficits • Delusions, hallucinations • Psychomotor restlessness or impairment • Suicidality # Central Overlap (Shared Features) : • Decreased level of functioning (illustrated by a person sitting with head down) • Delusions, hallucinations • Psychomotor restlessness or impairment • Suicidality • Cognitive symptoms # Design Encodings : • Three overlapping circles, each shaded differently and labeled with the disorder name. • Central overlap contains an illustration of a person and the phrase “Decreased level of functioning.” • Each disorder’s symptoms are listed in bullet points within its respective circle. • ESC logo in the bottom right corner. # Analysis : • All three disorders share several core symptoms: cognitive impairment, delusions/hallucinations, psychomotor changes, and suicidality, which collectively contribute to decreased functioning. • Schizophrenia and psychotic disorders uniquely list “negative symptoms” and “loss of pleasure.” • Bipolar disorder uniquely includes “elevated mood.” • The diagram visually emphasizes the substantial overlap in symptoms and functional impairment among these psychiatric conditions.
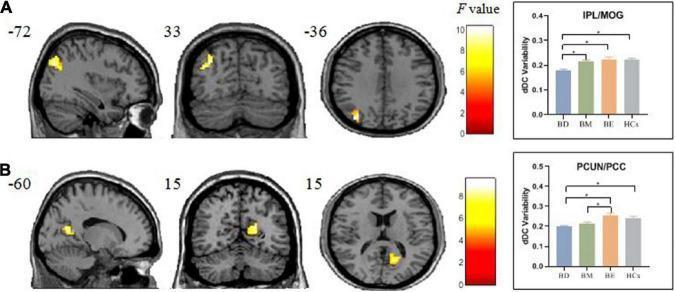
This composite diagnostic image presents statistical parametric maps and bar graphs demonstrating differences in dynamic degree centrality (dDC) variability in the brain among four clinical groups: bipolar depression (BD), bipolar mania (BM), bipolar euthymia (BE), and healthy controls (HCs). The content is organized into two panels (A and B). Panel A displays sagittal, coronal, and axial views of the brain with heat-map clusters (yellow/red) in the left inferior parietal lobule and middle occipital gyrus (IPL/MOG). An adjacent bar graph shows significant decreases in dDC variability in the BD group compared to BM, BE, and HCs in this region. Panel B displays similar brain views highlighting the right precuneus and posterior cingulate cortex (PCUN/PCC). The corresponding bar graph reveals that both BD and BM groups exhibit decreased dDC variability compared to the BE group. Color bars indicate F-values ranging from 0 to 10. The image illustrates neuroimaging findings in bipolar disorder, highlighting abnormal intrinsic brain connectivity variability as a potential biomarker for different mood states.
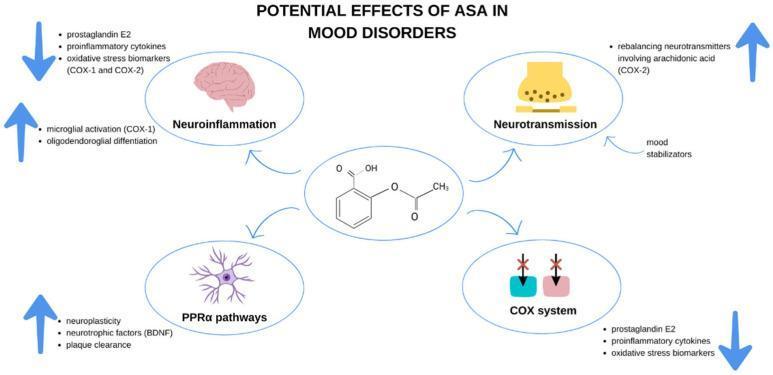
This pathophysiology diagram illustrates the potential mechanisms of action for Acetylsalicylic Acid (ASA) in the treatment and prevention of mood disorders. The central element is the chemical structure of ASA, which branches out to four key neurological and immunological domains. 1) Neuroinflammation: ASA is associated with decreased levels of prostaglandin E2, proinflammatory cytokines, and oxidative stress biomarkers (COX-1/COX-2), while potentially influencing microglial activation and oligodendroglial differentiation. 2) COX System: The diagram depicts the direct inhibition of cyclooxygenase enzymes, leading to a downstream reduction in inflammatory mediators. 3) Neurotransmission: The visual indicates a role in rebalancing neurotransmitters via the arachidonic acid pathway (COX-2), interacting with mood stabilizers. 4) PPARα Pathways: ASA is shown to enhance neuroplasticity, brain-derived neurotrophic factor (BDNF) levels, and plaque clearance. Directional arrows signify the increase or decrease of specific biological processes and molecular markers, summarizing how ASA acts as a multi-target modulator within the central nervous system to alleviate symptoms of depression and bipolar disorder.
Bipolar Disorder
Definition and Epidemiology
- Lifetime prevalence: ~1-2%; 12-month prevalence ~0.6%
- Age of onset: Late adolescence to early adulthood (late teens to mid-20s)
- Sex: Slightly higher prevalence in males for Bipolar I; Bipolar II more common in females
- Heritability: ~50% - stronger genetic contribution than unipolar depression; polygenic and multifactorial
The Bipolar Spectrum
| Type | Core Feature |
|---|---|
| Bipolar I | At least 1 manic episode (depression common but not required) |
| Bipolar II | Hypomania + major depression; never full mania |
| Cyclothymic disorder | Chronic hypomanic and low-level depressive symptoms for ≥2 years, never meeting full criteria for either |
| Rapid cycling | ≥4 mood episodes per year (any type); indicates more severe course |
DSM-5 Diagnostic Criteria
Manic Episode (DSM-5-TR)
- Distractibility
- Impulsivity / excessive involvement in pleasurable activities with high potential for harm (spending sprees, sexual indiscretions, foolish investments)
- Grandiosity / inflated self-esteem
- Flight of ideas / racing thoughts
- Activity increase (goal-directed) / psychomotor agitation
- Sleep decreased (feels rested after only 3 hours)
- Talkative / pressured speech
Hypomanic Episode
- Duration: ≥4 consecutive days
- Mood change observable by others
- NOT severe enough to cause marked impairment or require hospitalization
- NO psychotic features (if present, the episode is manic by definition)
Pathobiology
- Genetic: Polygenic; heritability ~50%; specific loci identified in rare families but genetic screening is not yet clinically useful
- Neuroimaging: Increased ventricular-brain ratios (parenchymal atrophy); dysregulation of frontostriatal systems
- Circadian rhythm: Phase advance of central circadian rhythms can precipitate mania - decreased sleep need creates a vicious cycle of further phase advancement
- Psychosocial stressors: Can precipitate both manic and depressive episodes
- Neuroinflammation: Emerging evidence that inflammatory pathways (prostaglandin E2, cytokines) and oxidative stress are involved
Clinical Features by Episode
Manic Episode
| Domain | Symptoms |
|---|---|
| Emotional | Euphoria, irritability, labile affect |
| Ideational | Grandiosity, flight of ideas |
| Somatic/neurovegetative | Increased energy, decreased sleep, distractibility, psychomotor agitation |
| Other | Pressured speech, goal-directed hyperactivity, impaired judgment |
| Psychotic features | Delusions, hallucinations, loose associations (defines "mania with psychotic features") |
Bipolar Depression
- Often clinically indistinguishable from unipolar depression
- Patients typically present for care during depressive episodes, not during hypomania
- Past hypomanic episodes are often missed (felt pleasant, not mentioned by patients)
- Key clinical rule: Always ask about past manic/hypomanic symptoms when evaluating any depressed patient - antidepressant monotherapy may worsen or precipitate mania
Differential Diagnosis
- vs. Schizophrenia: Psychotic symptoms in bipolar occur only during mood episodes; negative symptoms and pervasive cognitive deficits are absent
- vs. ADHD (especially in children): Episodic vs. chronic course; ADHD lacks elevated mood or grandiosity
- vs. Borderline personality disorder: Mood instability in BPD is reactive and trait-like; bipolar episodes are autonomous and episodic
- Substance-induced mania: Must be excluded (stimulants, corticosteroids, thyroid hormone)
- Medical causes of mania: Hyperthyroidism, CNS lesions, delirium, stroke
Treatment
Mood Stabilizers (Maintenance Therapy)
| Drug | Dose | Target Level | Key Notes |
|---|---|---|---|
| Lithium | 600-1500 mg/day (divided doses) | 0.6-1.2 mEq/L (up to 1.4 in acute mania) | First-line; anti-suicidal effect; monitor renal function, thyroid, calcium |
| Valproic acid | 500-1500 mg/day | 50-125 µg/mL | Effective for rapid cycling; avoid in pregnancy (teratogenic) |
| Carbamazepine | 400-1200 mg/day | 4-12 µg/mL | Induces hepatic enzymes; monitor for agranulocytosis/Stevens-Johnson |
| Lamotrigine | Start 25 mg/day → max 200 mg/day | - | Best for bipolar depression prophylaxis; titrate slowly to minimize risk of Stevens-Johnson syndrome |
- Lithium + valproate combination is superior to valproate alone for relapse prevention
- Lithium is associated with decline in renal function, hypothyroidism, and hypercalcemia with long-term use
Second-Generation Antipsychotics (SGAs)
- More rapidly effective than mood stabilizers for acute mania
- Limit use as long-term maintenance due to risk of metabolic syndrome (and tardive dyskinesia)
Acute Episodes
- Acute mania: SGAs (with or without a mood stabilizer) act faster than mood stabilizers alone; first-generation antipsychotics also effective
- Bipolar depression: Quetiapine, lamotrigine, or lithium; avoid antidepressant monotherapy (risk of triggering mania or rapid cycling)
- ECT: Effective for severe or refractory mood episodes and in pregnancy
Psychotherapy and Adjunctive Treatments
- Psychoeducation (patient and family) - cornerstone of long-term management
- Cognitive-behavioral therapy, interpersonal and social rhythm therapy
- Sleep hygiene and regular circadian rhythm maintenance
- Light therapy, rTMS may also be effective adjuncts
Prognosis
- Most patients return to baseline functioning between episodes
- Rapid cycling (≥4 episodes/year) indicates more severe course
- Some patients experience progressive functional deterioration over time
- Suicide risk is substantially elevated - lithium has demonstrated anti-suicidal effects in meta-analyses
- Childhood/pediatric onset carries a more complex course and diagnostic challenges
Special Population: Pregnancy
- Valproate and carbamazepine are teratogenic (avoid in first trimester especially)
- Lithium has a small risk of Ebstein's anomaly (cardiac) but is often continued with fetal echocardiography monitoring
- Lamotrigine is relatively safer in pregnancy
- Untreated bipolar disorder in pregnancy carries significant risks (postpartum mania/psychosis)